- Table of Content
- 1.USET observes ...
- 2.Naked eye suns...
- 3.Review of Spac...
- 4.The SIDC Space...
- 5.International ...
- 6.Noticeable Sol...
- 7.PROBA2 Observa...
- 8.Geomagnetic Ob...
- 9.Review of Iono...
- 10.Upcoming Activ...
2. Naked eye sunspots
3. Review of Space Weather
4. The SIDC Space Weather Briefing
5. International Sunspot Number by SILSO
6. Noticeable Solar Events
7. PROBA2 Observations
8. Geomagnetic Observations in Belgium
9. Review of Ionospheric Activity
10. Upcoming Activities
USET observes sunspots by eye
There was quite the excitement last week in the USET team that makes ground-based solar observations. Not one, but two sunspot regions were visible with the naked eye!
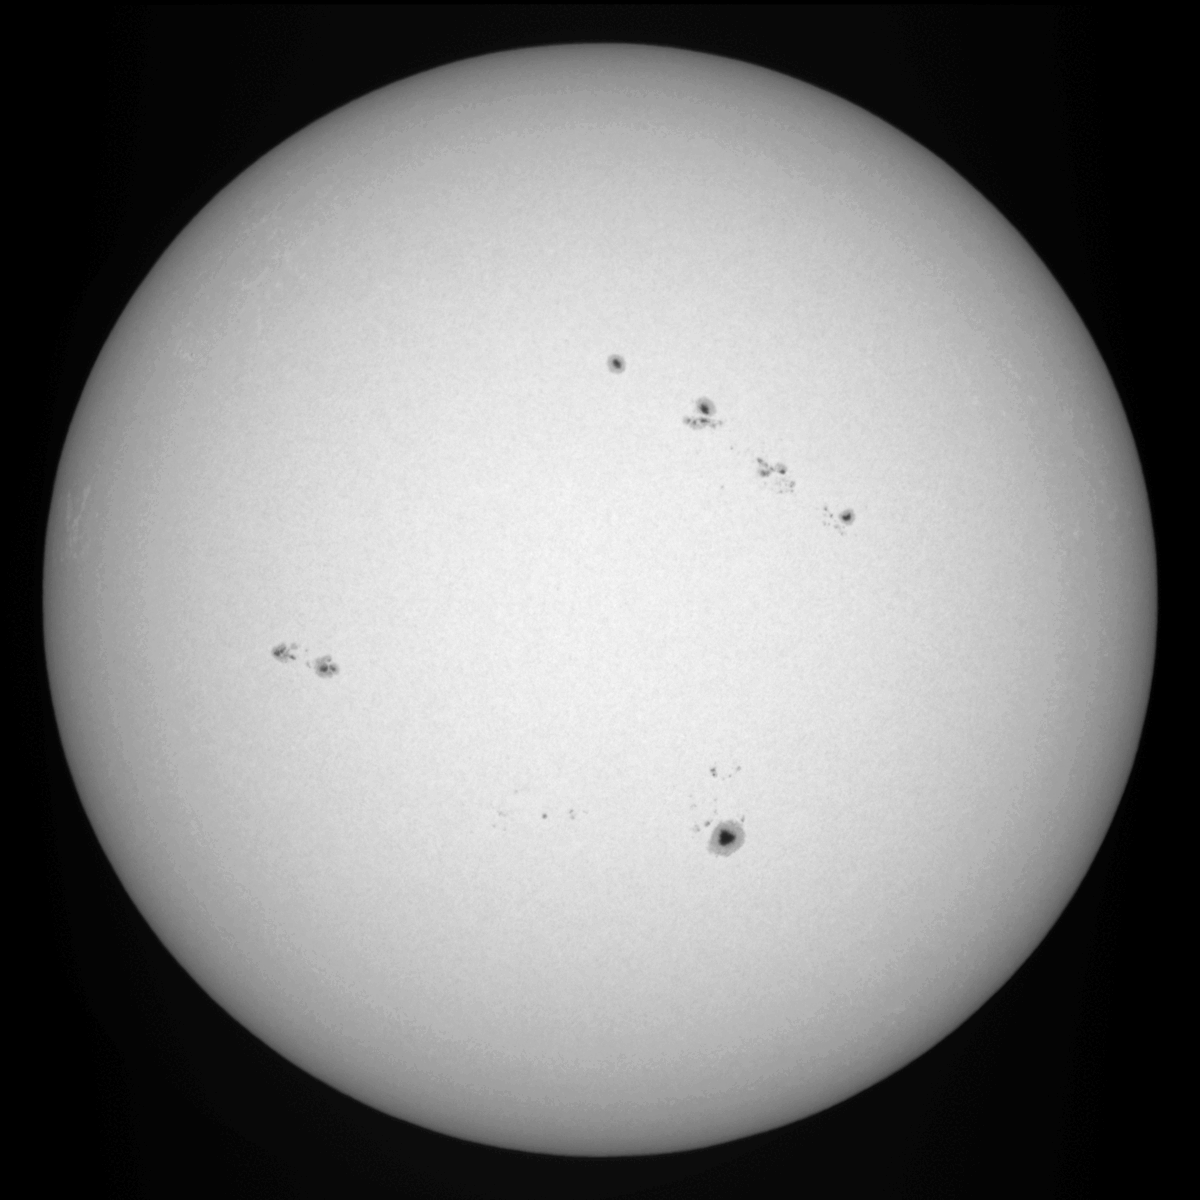
The first group started its transit over the solar disk on May 19 and was a nice circular sunspot, with some smaller spots close by. This sunspot group can be seen at the lower right of the sun in the clip above, which loops USET observations from May 25 to May 27.
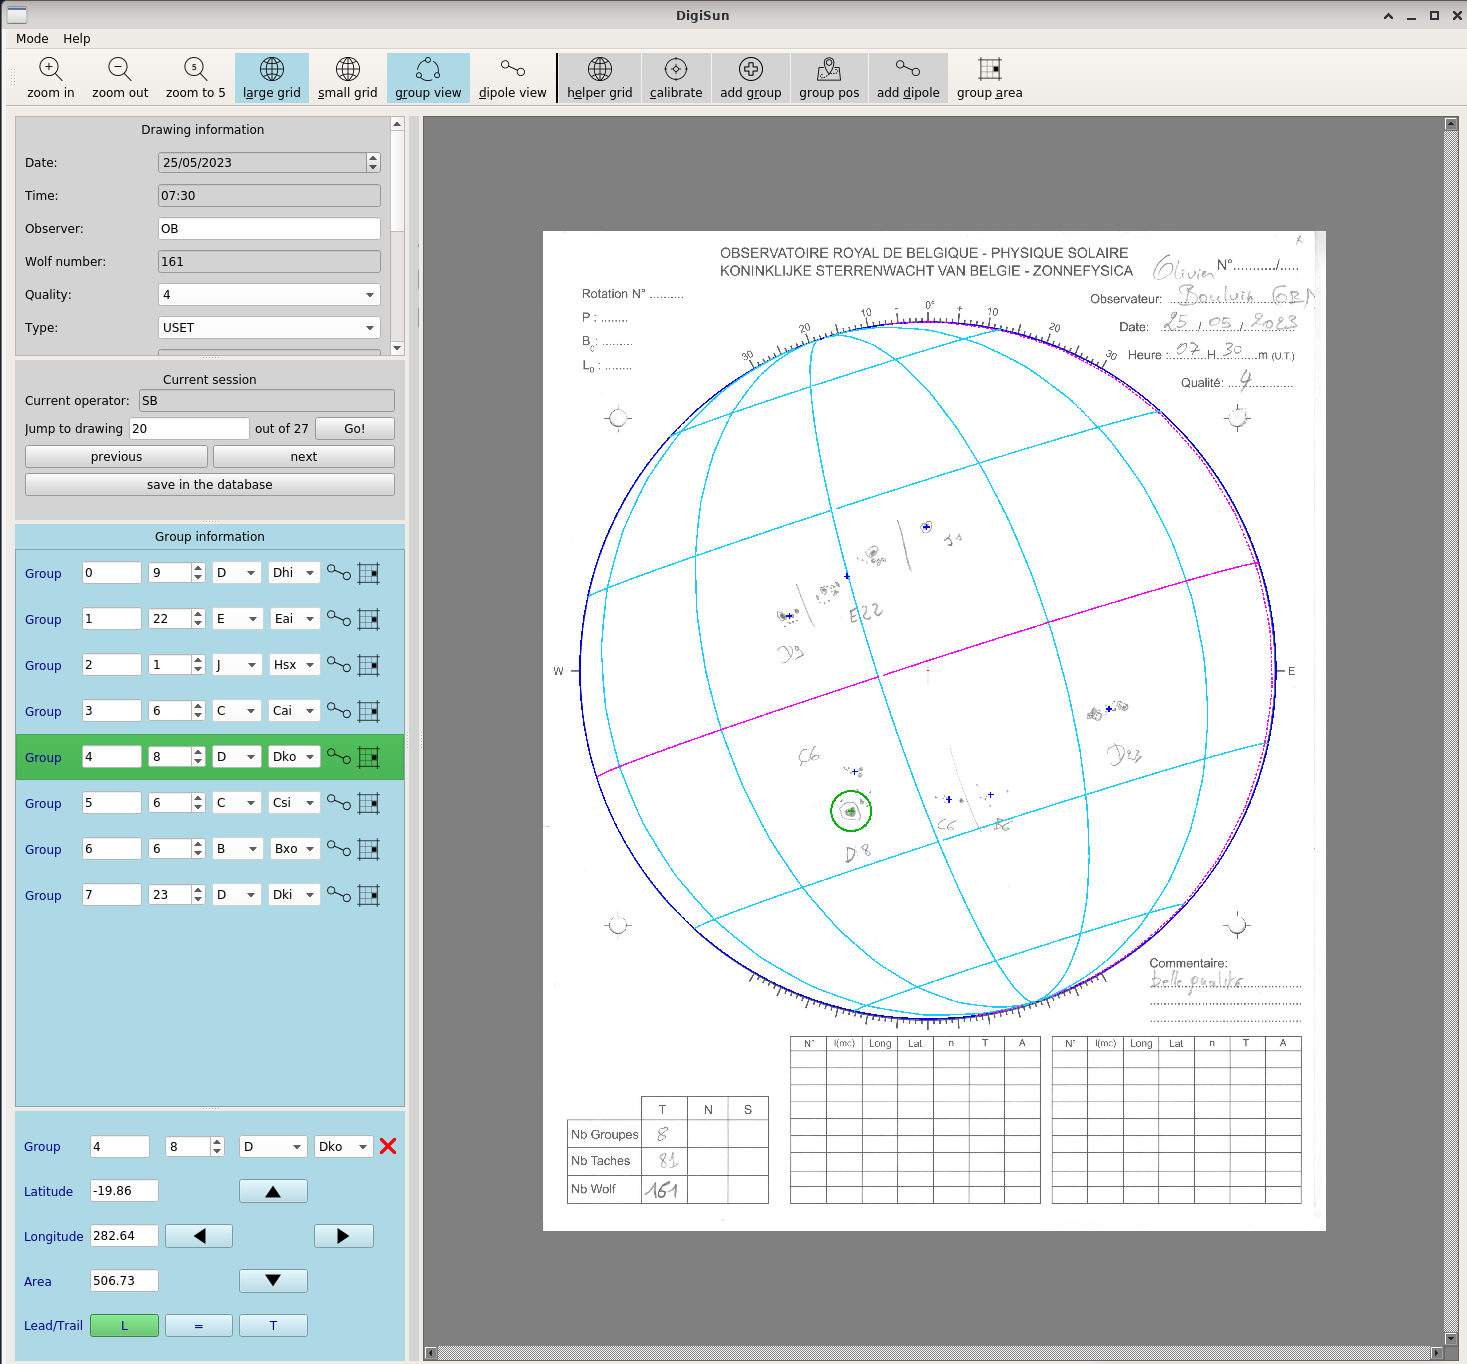
On May 25, the USET observer analysed this region using DigiSun, a software tool dedicated to scientific measurements of sunspots drawings. The application allows an operator to extract from a drawing the number of groups on the sun, their positions, the number of spots inside each group, their Zurich and McIntosh classifications, and their dipole tilt.
For this case, the observer measured an area of ~500 msh (see below; due to the projection by the telescope, the sun is mirrored in this drawing and the sunspot group is on the left).
msh means millionths of a solar hemisphere, with 167 msh corresponding to the total surface area of the Earth. This means that e.g. 300 msh concerns already quite a big sunspot, and there aren't that many during a solar cycle. According to McIntosh (1990), only 8% of all unipolar and bipolar sunspot groups contain a large sunspot (i.e. an area larger than 250 msh) at some point during their transit.
Later, on May 27th, a bipolar group takes center stage (crossing the central meridian at the end of the clip above), this time with a total area of ~ 980 msh. This was not a single sunspot, but a compact bipolar group and was therefore also visible with the naked eye.
Disclaimer: of course one should never look up at the sun with unprotected eyes. Keep your eclipse glasses close. With the ongoing rise in solar activity, we hope to report on more sunspot groups that you can see without a telescope!
Naked eye sunspots
When observing the Sun and its active regions, we usually think of extreme ultraviolet imagers on board satellites such as PROBA2 (https://proba2.sidc.be/ssa ) or SDO (https://sdo.gsfc.nasa.gov/data/aiahmi/ ), as well as white light or H-alpha telescopes on the ground such as the USET solar telescopes (https://www.sidc.be/uset/ ) of the Royal Observatory in Brussels, Belgium. In short: telescopes are needed, the bigger, the better. So it is always a surprize when one learns that sunspots can also be seen without a visual aid, provided of course adequate protection of our delicate eyes such as by using solar eclipse glasses. The human eye has a resolution between about 0.7 and 1 arc minutes, which corresponds to the size of a sunspot between about 250 and 450 MH. MH means millionths of a solar hemisphere, with 167 MH corresponding to the total surface area of the Earth. This means that e.g. 300 MH concerns already quite a big sunspot, and there aren't that many during a solar cycle. According to McIntosh (1990 - https://ui.adsabs.harvard.edu/abs/1990SoPh..125..251M/abstract ), only 8% of all unipolar and bipolar sunspot groups contain a large sunspot (north-south diameter larger than 2.5 degrees, i.e. an area larger than 250 MH) at some point during their transit.
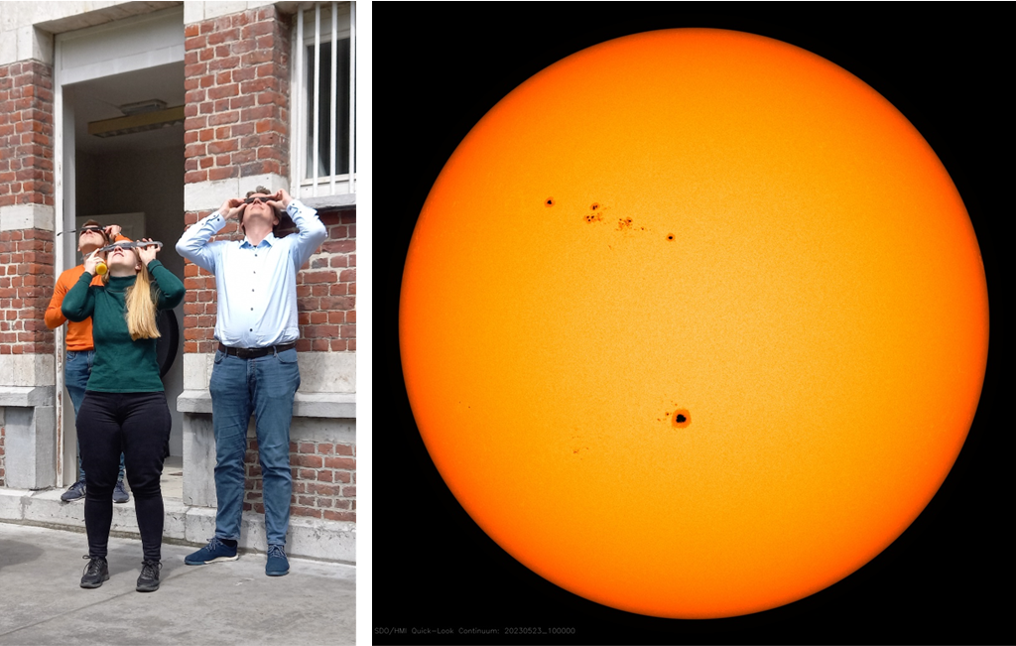
Nonetheless, last week saw 2 relatively large sunspot groups transiting the solar disk, which were both located in the southern solar hemisphere. The first one was NOAA 3310, which was basically a nice circular sunspot with some smaller satellite spots nearby. Its area was stable and varied mostly between 300 and 360 MH during the 19-25 May period (NOAA reports - https://www.solarmonitor.org/ ). Note that the NOAA reported sunspot areas are usually about 40% lower than the true values (see the Solar Cycle Science webpage at http://solarcyclescience.com/activeregions.html ). The author saw the sunspot with the naked eye from 21 to 25 May, and also USET solar observers as well as participants from the SWIC (STCE's Space Weather Introductory Course - https://www.stce.be/SWEC ) were able to see the "tiny dot" using eclipse glasses on 23 and 24 May, as shown in the picture above. They did comment that it was on the limit, which is no surprize in view of its size and the fact that different observers have a different eye resolution.
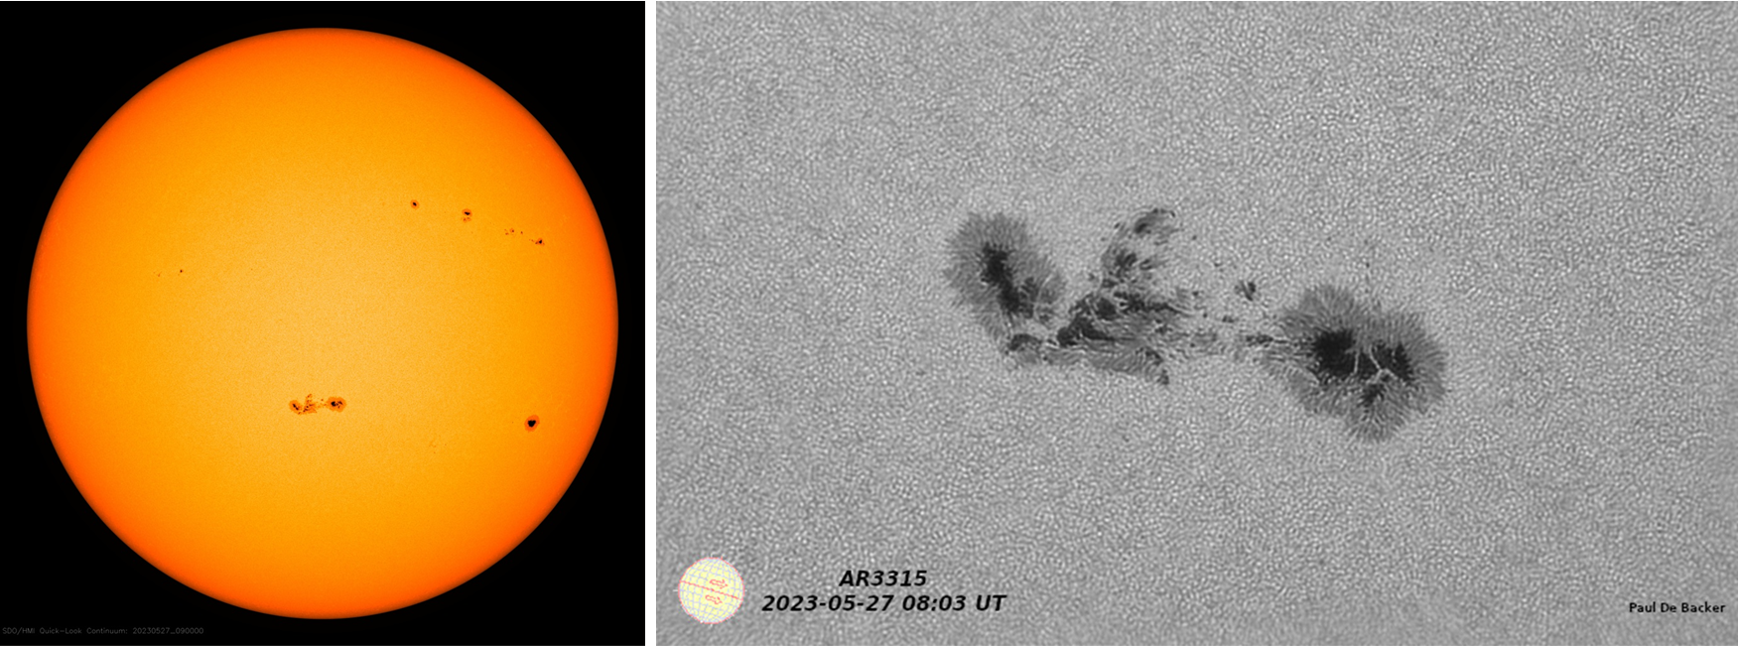
Then, from 23 May onwards, a sunspot group started to develop in the southeastern solar quadrant. NOAA 3315 became a compact sunspot group consisting of 2 big main sunspots. This can be seen in the imagery above, with next to the white light image taken by SDO/HMI on 27 May, a captivating, detailed picture of the sunspot group taken by Paul De Backer around the same time. Paul regularly contributes his amazing pictures to the Belgian Solar Section (https://www.vvs.be/werkgroepen/werkgroep-zon ). The group reached an area of 800 MH on 28 May, and was visible with the naked eye on 27 and 28 May (no reports yet from the 29th). In fact, with the naked eye, the group seemed somewhat "smeared" which is logical because of the 2 closely spaced main spots give it a more rectangular shape than NOAA 3310. Ancient Asian observations have described naked eye sunspot groups as plumes, peaches, eggs, coins, pears,... indicating that sunspot groups on occasion were so large that certain shapes could be distinguished with the naked eye (See e.g. Vaquero and Vazquez, 2009 - https://link.springer.com/book/10.1007/978-0-387-92790-9 ).
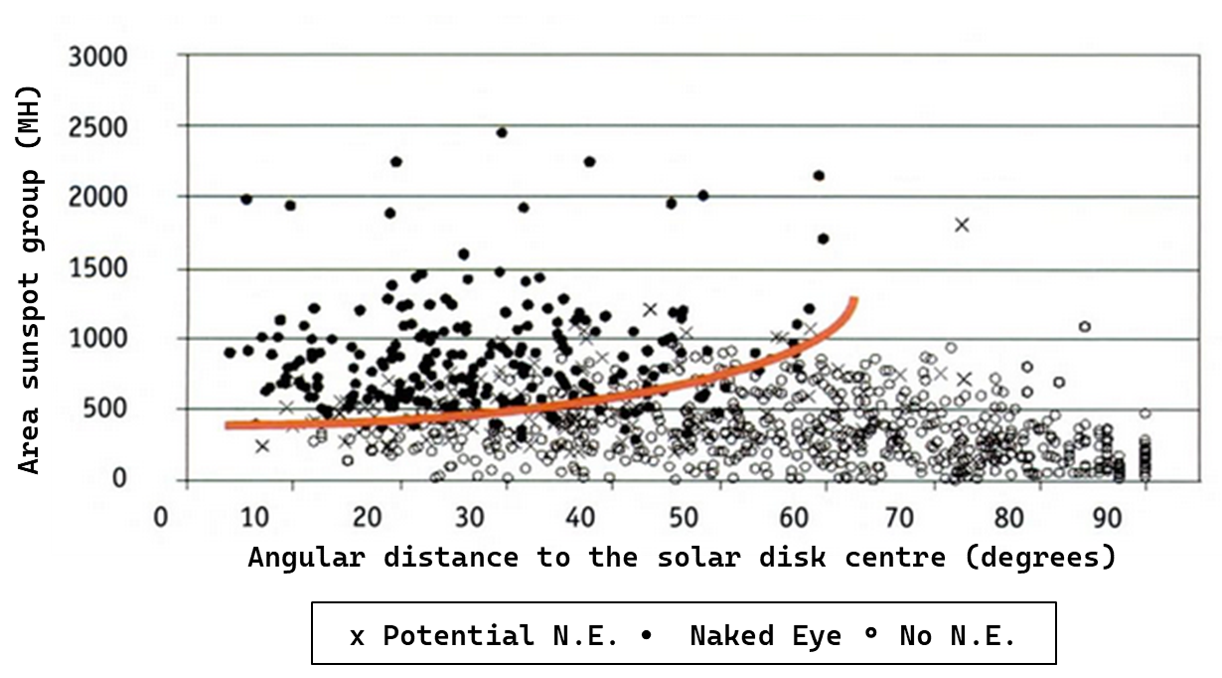
The diagram above was compiled by the author several years ago. It shows whether or not a sunspot group is visible with the naked eye (resp. the black and open dots) as a function of its area (vertical axis) and its angular distance to the solar disk's centre (horizontal axis). The data cover about 1000 naked eye observations done by solar observers from the Belgian Solar Section and the British Astronomical Association (https://britastro.org/sections/solar ) between May 1996 and December 2001. The crosses ("x") indicate a potentially naked eye sunspot, i.e. an isolated report of naked eye visibility, which usually means an observer with exceptionally good eye view. The red curve provides an idea of the lower limit of sunspot's size and location for naked eye visibility: a minimum sunspot area of around 300-350 MH near disk centre and a maximum angular distance of about 60 degrees for the largest sunspots - that's very close to the solar limb! A transition zone from "naked eye" to "not naked eye" visibility is also apparent in the diagram. This is in large part because the area of the sunspot group as a whole is taken. NOAA 3310 was basically a single sunspot of about 350 MH, but there are plenty of sunspot groups that consist of e.g. 2 well-spaced main spots of 150 MH and a few other smaller spots, also summing up to 350 MH. For a similar angular distance from the solar disk centre as NOAA 3310, the latter sunspot groups will not be visible with the naked eye. Another contributing factor is how much of the sunspot area consists of penumbra (the greyish zone around the dark core sunspot), as it contrasts less with the solar disk, and thus reduces the visibility with the naked eye.
The online version of this newsitem at https://www.stce.be/news/648/welcome.html also contains 2 clips composed from SDO/HMI (20-28 May) and USET (25-27 May) images.
Review of Space Weather
Solar Active Regions (ARs) and flares
The solar flaring activity throughout the week was at low to moderate levels with multiple C-class flaring and one or up to two low M-class flares per day. There were eleven numbered active regions on the visible solar disc. The week started at moderate levels with an M2.6-flare, peak time 16:04 UTC on May 21st, from the most complex and most active region in the first half of the week, NOAA AR 3311 (beta-gamma-delta). Multiple low to high C-class flaring was also produced by NOAA AR 3305 (beta) from near the west limb. Active region NOAA 3310 (beta) was large enough to be seen by protected eye and produced multiple C-class flaring. The second half of the week was governed by activity from NOAA AR 3315, which towards the end of the week developed a beta-gamma-delta magnetic type configuration becoming the most complex region on the visible disc as NOAA AR 3311 decreased its complexity to beta-gamma.
Coronal mass ejections
Multiple filament and prominence eruptions were observed throughout the week, none of them resulted in an Earth-directed coronal mass ejection (CME). Low chances were given for a weak glancing blow arrival late on May 25th or May 26th related to a low M-class flare-driven CME on May 22nd with associated on-disc dimming, but no ICME arrival was confirmed by the solar wind data later. Two back-sided, fast, full halo CMEs were observed on May 22nd and May 23rd with no expected arrival at Earth.
No other Earth-directed CMEs were observed in the available coronagraph imagery.
Coronal Holes
A negative polarity equatorial coronal hole crossed the central meridian on May 21st and the related high speed stream was expected to arrive at Earth as early as May 23rd.
Proton flux levels
The greater than 10 MeV GOES proton flux was at nominal levels throughout the entire week.
Electron fluxes at GEO
The greater than 2 MeV electron flux was below the 1000 pfu threshold at the start of the week and frequently exceeded the threshold for prolonged periods of time until May 28th, when it returned back to background values.
The corresponding electron fluence started at nominal levels and quickly increased towards moderate levels. It dropped back to nominal levels at the end of the week.
Solar wind
The solar wind parameters as measured by ACE and DSCOVR at the beginning of the week were under the mixed influence of a high speed stream (HSS) arrival from a negative polarity coronal hole and a weak ICME arrival related to the flare-driven CME from May 17th. The corresponding solar wind velocity reached up to 657 km/s on May 22nd with enhanced interplanetary magnetic field values of up to 13 nT and minimum Bz of -10 nT. Enhanced solar wind parameters due to continuous HSS influence with solar wind speeds exceeding 600 km/s (and reaching as high as 688 km/s) persisted throughout May 25th and started to wane from May 26th onwards, to reach mostly slow solar wind conditions at the end of the week.
Geomagnetism
The geomagnetic conditions globally started at moderate storm levels at the beginning of the week due to the mixed influence of a HSS and an ICME arrivals. Locally in Belgium, only mostly active conditions were observed with a single isolated minor storm period late UTC on May 21st. The geomagnetic conditions were mostly quiet to active throughout May 22nd, May 23rd and quiet to unsettled thereafter. The week ended at quiet levels.
The SIDC Space Weather Briefing
The Space Weather Briefing presented by the forecaster on duty from May 22 to 28. It reflects in images and graphs what is written in the Solar and Geomagnetic Activity report: https://www.stce.be/briefings/20230529_SWbriefing.pdf

If you need to access the movies, contact us: stce_coordination at stce.be
International Sunspot Number by SILSO
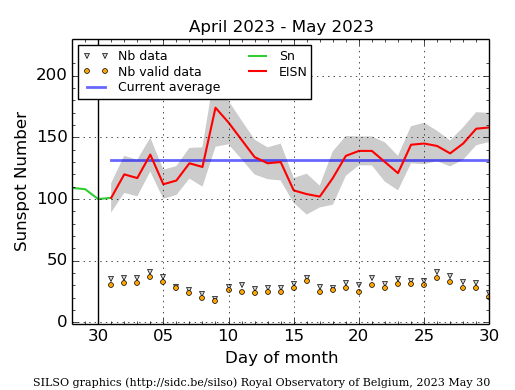
The daily Estimated International Sunspot Number (EISN, red curve with shaded error) derived by a simplified method from real-time data from the worldwide SILSO network. It extends the official Sunspot Number from the full processing of the preceding month (green line), a few days more than one solar rotation. The horizontal blue line shows the current monthly average. The yellow dots give the number of stations that provided valid data. Valid data are used to calculate the EISN. The triangle gives the number of stations providing data. When a triangle and a yellow dot coincide, it means that all the data is used to calculate the EISN of that day.
Noticeable Solar Events
| DAY | BEGIN | MAX | END | LOC | XRAY | OP | 10CM | TYPE | Cat | NOAA |
| 22 | 1331 | 1337 | 1343 | N18E24 | M1.9 | SF | 110 | VI/2III/2II/2 | 3311 | |
| 22 | 1330 | 1337 | 0655 | M1.9 | VI/2 | |||||
| 23 | 1207 | 1213 | 1217 | M3.0 | III/1 | 97 | 3311 | |||
| 24 | 0951 | 0958 | 1002 | N18E0 | M1.0 | SN | 97 | 3311 | ||
| 24 | 1704 | 1721 | 1748 | N18W3 | M1.8 | 1F | 97 | 3311 | ||
| 24 | 1753 | 1800 | 1818 | S17E38 | M1.0 | SF | 1 | 3315 | ||
| 25 | 1437 | 1446 | 1453 | S25W4 | M1.1 | 1N | III/2 | 98 | 3312 | |
| 28 | 1021 | 1036 | 1055 | S15W11 | M1.0 | 1N | III/1 | 1 | 3315 |
| LOC: approximate heliographic location | TYPE: radio burst type |
| XRAY: X-ray flare class | Cat: Catania sunspot group number |
| OP: optical flare class | NOAA: NOAA active region number |
| 10CM: peak 10 cm radio flux |
PROBA2 Observations
Solar Activity
Solar flare activity fluctuated from low to moderate during the week.
In order to view the activity of this week in more detail, we suggest to go to the following website from which all the daily (normal and difference) movies can be accessed: https://proba2.oma.be/ssa
This page also lists the recorded flaring events.
A weekly overview movie can be found here (SWAP week 687): https://proba2.oma.be/swap/data/mpg/movies/weekly_movies/weekly_movie_2023_05_22.mp4
Details about some of this week's events can be found further below.
If any of the linked movies are unavailable they can be found in the P2SC movie repository here: https://proba2.oma.be/swap/data/mpg/movies/
Tuesday May 23
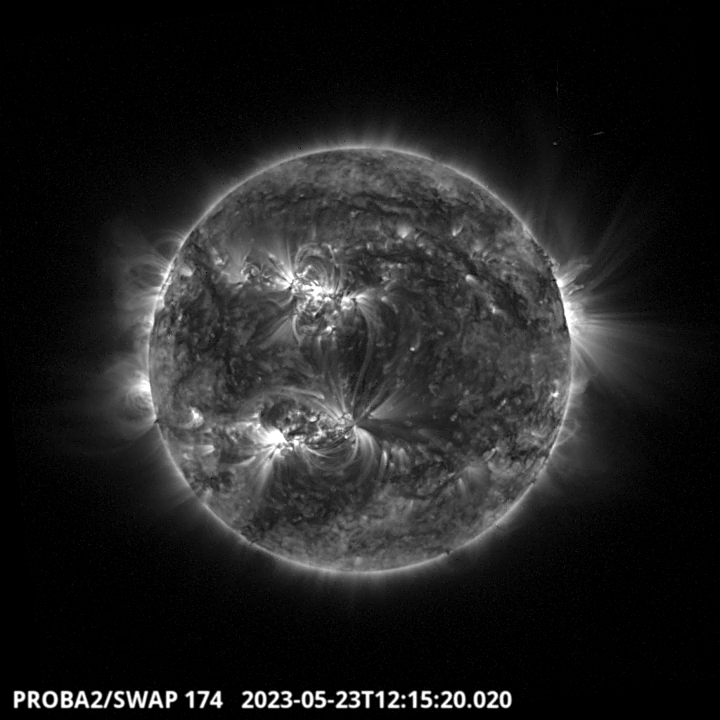
Flows on the North East part of the solar disk around 12:15 UT, associated with the largest flare of the week, a M3.0, produced by the NOAA active region 3311. Find a SWAP movie of the event here. https://proba2.sidc.be/swap/movies/20230523_swap_movie.mp4
Geomagnetic Observations in Belgium
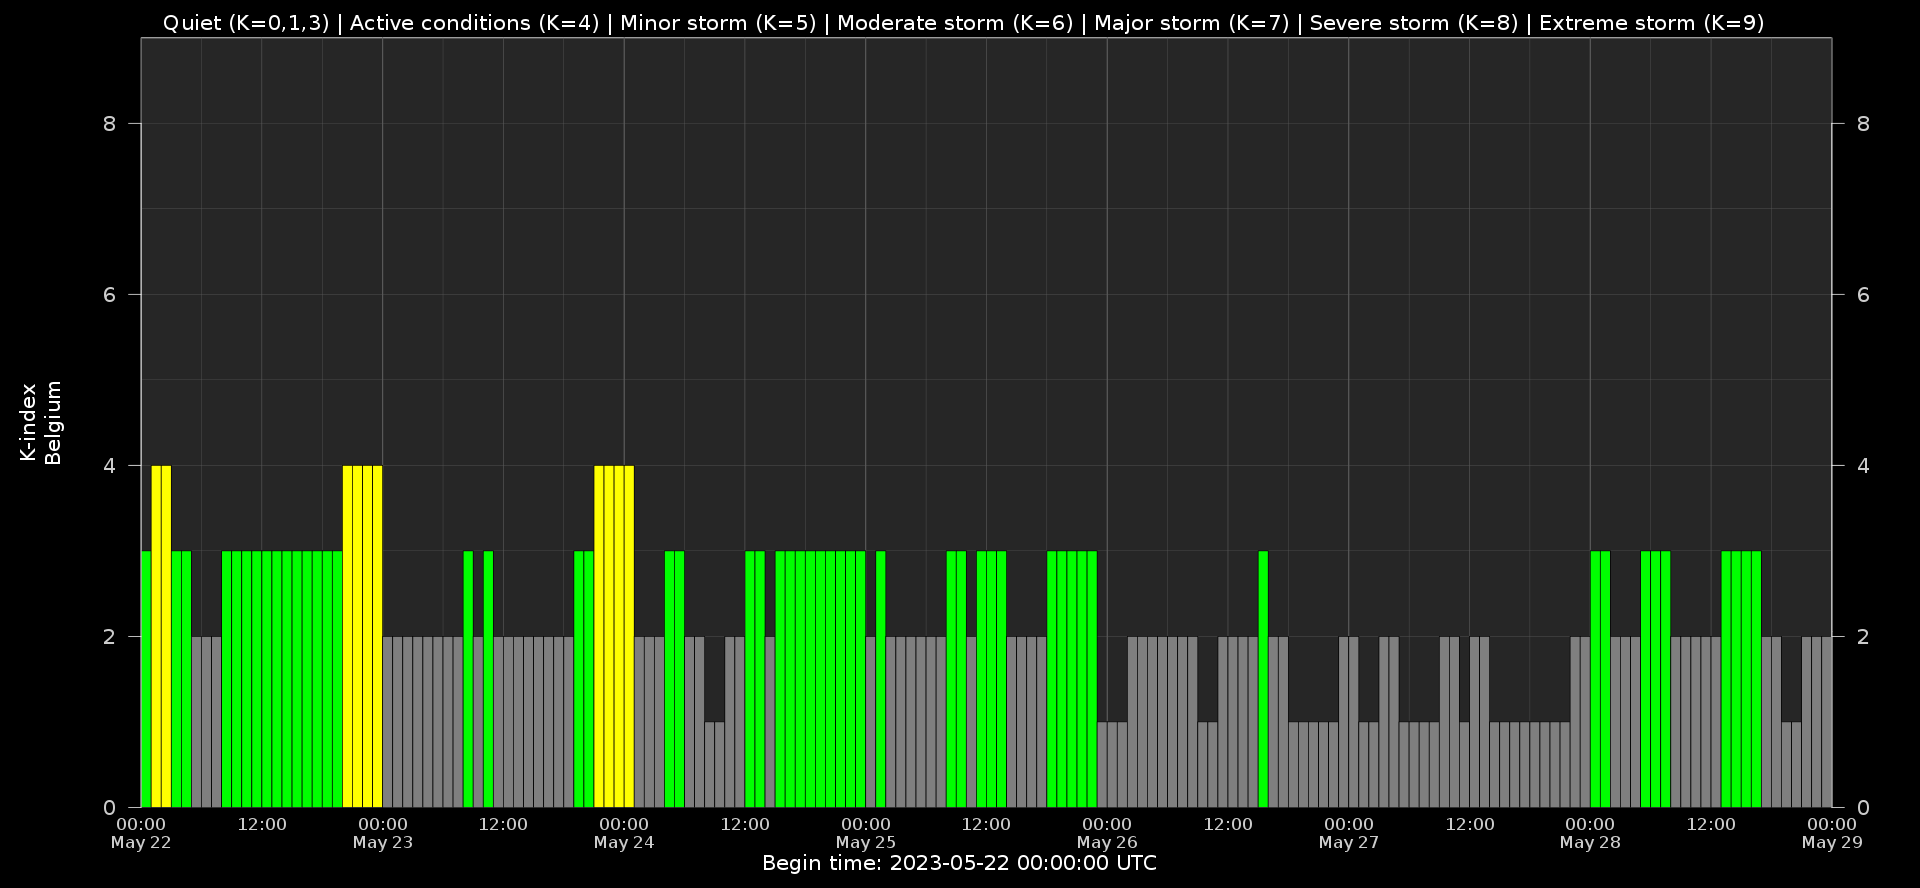
Local K-type magnetic activity index for Belgium based on data from Dourbes (DOU) and Manhay (MAB). Comparing the data from both measurement stations allows to reliably remove outliers from the magnetic data. At the same time the operational service availability is improved: whenever data from one observatory is not available, the single-station index obtained from the other can be used as a fallback system.
Both the two-station index and the single station indices are available here: http://ionosphere.meteo.be/geomagnetism/K_BEL/
Review of Ionospheric Activity

The figure shows the time evolution of the Vertical Total Electron Content (VTEC) (in red) during the last week at three locations:
a) in the northern part of Europe(N 61deg E 5deg)
b) above Brussels(N 50.5deg, E 4.5 deg)
c) in the southern part of Europe(N 36 deg, E 5deg)
This figure also shows (in grey) the normal ionospheric behaviour expected based on the median VTEC from the 15 previous days.
The VTEC is expressed in TECu (with TECu=10^16 electrons per square meter) and is directly related to the signal propagation delay due to the ionosphere (in figure: delay on GPS L1 frequency).
The Sun's radiation ionizes the Earth's upper atmosphere, the ionosphere, located from about 60km to 1000km above the Earth's surface.The ionization process in the ionosphere produces ions and free electrons. These electrons perturb the propagation of the GNSS (Global Navigation Satellite System) signals by inducing a so-called ionospheric delay.
See http://stce.be/newsletter/GNSS_final.pdf for some more explanations ; for detailed information, see http://gnss.be/ionosphere_tutorial.php
Upcoming Activities
Check out our activity calendar: activities and encounters with the Sun-Space-Earth system and Space Weather as the main theme. We provide occasions to get submerged in our world through educational, informative and instructive activities.
If you want your event in our calendar, contact us: stce_coordination at stce.be
* June 7, STCE seminar: Physics-informed neural networks for solar magnetic field simulations, Meridian room@ROB and online, Brussels, Belgium
* June 12-14, STCE Space Weather Course for BKG, Brussels, Belgium
* June 29, STCE annual meeting, Brussels, Belgium
* Nov 18-19, e-SWAN Space Weather School: data, models and services, by the STCE, Toulouse, France
Check: https://www.stce.be/calendar
