- Table of Content
- 1.Solar eruption...
- 2.The STCE Annua...
- 3.New SWIC cours...
- 4.Review of sola...
- 5.International ...
- 6.Noticeable Sol...
- 7.PROBA2 Observa...
- 8.Geomagnetic Ob...
- 9.Review of Iono...
- 10.The SIDC Space...
- 11.Activities at ...
2. The STCE Annual Meeting is back!
3. New SWIC courses (Corrected dates)
4. Review of solar and geomagnetic activity
5. International Sunspot Number by SILSO
6. Noticeable Solar Events
7. PROBA2 Observations
8. Geomagnetic Observations in Belgium
9. Review of Ionospheric Activity
10. The SIDC Space Weather Briefing
11. Activities at the STCE
Solar eruptions in EUV
Over the last few weeks, sunspot activity has been high with the daily estimated international sunspot number (EISN ; SILSO - https://www.sidc.be/SILSO/home ) above 200 from 20 till 24 June. Despite the numerous sunspot groups present on the solar disk, the resulting number of strong flares was rather meager with only about a dozen of low-level M-class flares and a single X-class event. The latter occurred on 20 June and took the space weather forecasters by surprize, as discussed in this newsflash at https://www.stce.be/news/650/welcome.html
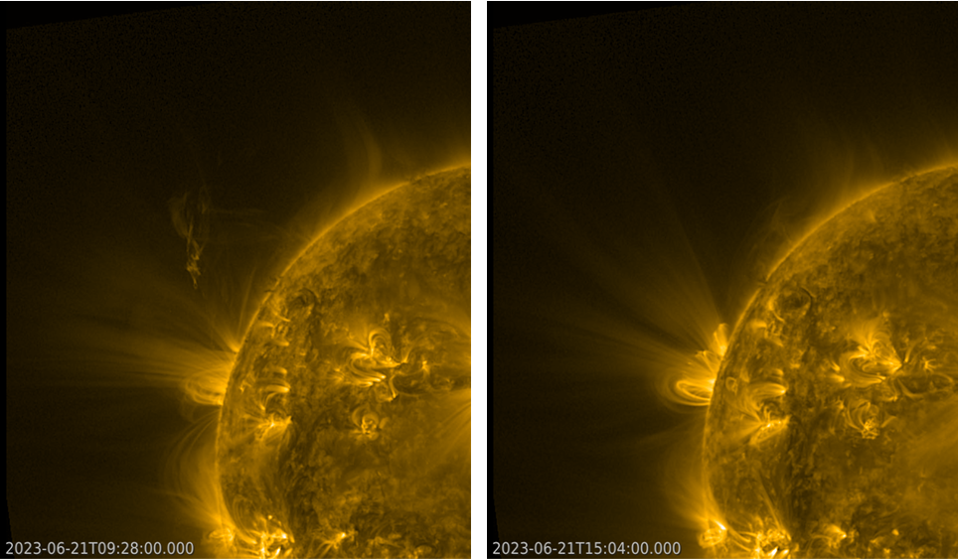
Nonetheless, a few stunning solar eruptions have taken place that are worthwhile mentioning here. A remarkable event took place on the farside of the Sun on 21 June. The source was still a full day behind the Sun's northeast limb, when around 09:00UTC a large and dense filament could be seen flinging into space. About 2 hours later, post-eruption coronal loops could be seen rising above the solar limb. Still visible a day later, they towered about 125.000 km above the limb, that's about a third of the Earth-Moon distance. When the presumed source region turned over the solar limb, it consisted -in white light- of a bright faculae field with only a few small sunspots. Interestingly, vigourous sunspot development has been observed starting on 26 June, and this new region (NOAA 13354) is now being watched as a potential source of strong flares. The extreme ultraviolet (EUV) imagery underneath are from the SUVI instrument onboard GOES-18 (https://www.swpc.noaa.gov/products/goes-solar-ultraviolet-imager-suvi ), showing the ejected filament and the rising coronal loops at a temperature of about 700.000 degrees (SUVI 171). Clips of the eruptions are available in the online version of this STCE newsitem at https://www.stce.be/news/652/welcome.html
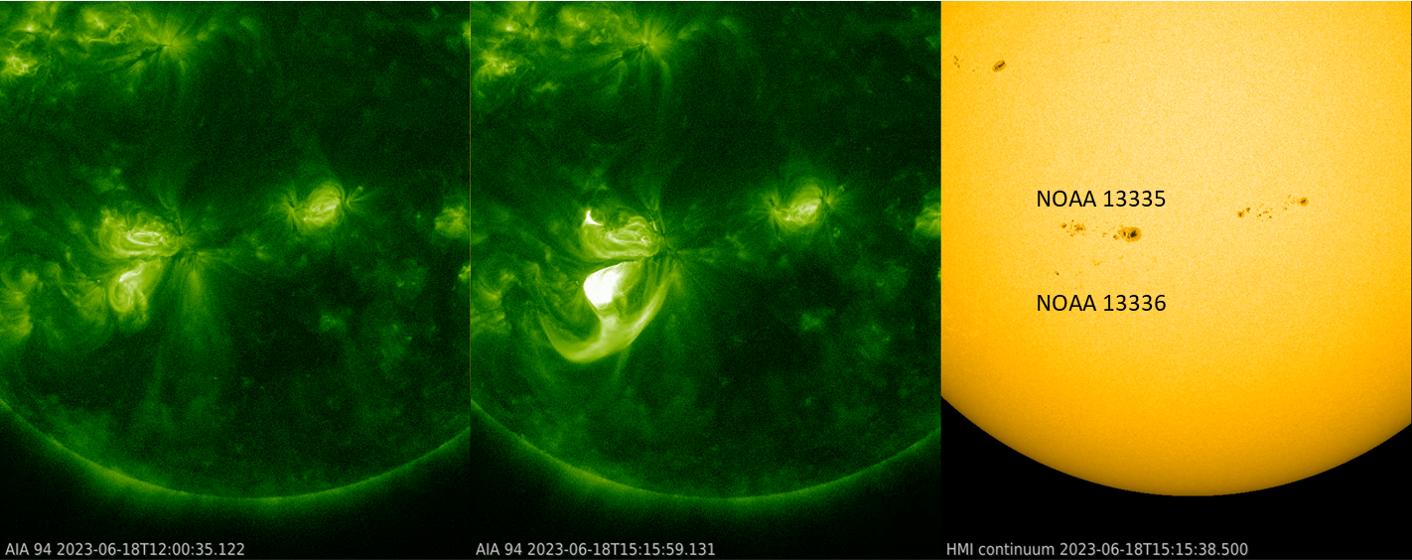
Just a few days earlier, on 18 June, an M2.5 flare took place in the southern solar hemisphere. Assigned to active region NOAA 13336, it resulted most likely from the magnetic interaction between two sunspot regions quite close to each other: the more southern and sunspot-poor group NOAA 13336, and the larger, more complex active region NOAA 13335 just 5 degrees towards the solar equator. Also a small filament to the southeast ("lower left") of NOAA 13336 was involved. The complex interactions resulted in a spectacular outlook of the flare in EUV as shown in the SDO/AIA 094 (https://sdo.gsfc.nasa.gov/data/aiahmi/ ) at very high temperatures of several million degrees. The annotated SDO/HMI white light image to the right shows the location and NOAA number of the relevant sunspot groups. The associated coronal mass ejection (CME) was narrow and not directed to Earth.
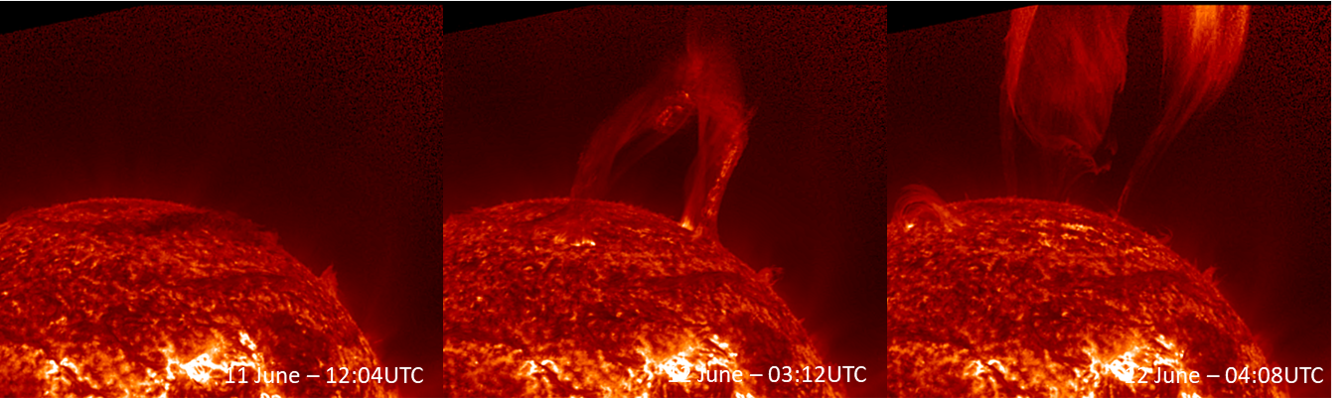
Solar filaments are clouds of charged particles ("plasma") above the solar surface squeezed between magnetic regions of opposite polarity. Being cooler and denser than the plasma underneath and their surroundings, they appear as dark lines when seen on the solar disk. Polar crown filaments (PCF) are located at the highest latitudes, separating the predominant polar field of the previous cycle and the dispersed field of the current cycle, which is drifting poleward from the trailing polarities of sunspot groups at lower latitudes. The "old" polar magnetic field is currently still strong enough to keep the newly arriving opposite polarity field at bay, and where the two encounter each other, a solid filament can form. This also means that small changes in these magnetic fields may result in instabilities in and the subsequent eruption of (a portion of) the filament. Just such an event was recently described in this STCE newsitem (https://www.stce.be/news/636/welcome.html ) reporting on eruptive activity in the northern PCF early February this year.
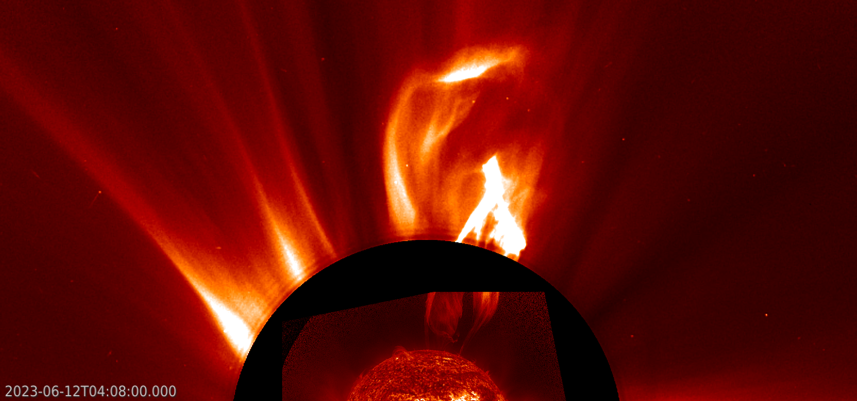
The PCF eruption early on 12 June was much more spectacular. The contrast-enhanced SUVI 304 images underneath first show a gradual rising of the filament late on 11 June followed by a sudden and impressive eruption a few hours later. Because of SUVI's wide field of view, the gap between its images (in EUV) and SOHO's coronagraphic images (white light!) is relatively small. The combination of the two allows a fine tracking from the filament eruption to the core of the associated CME, courtesy also of the huge size of the eruption. According to CACTus (https://www.sidc.be/cactus/ ), the CME had a speed near 500 km/s and was obviously not directed to Earth.
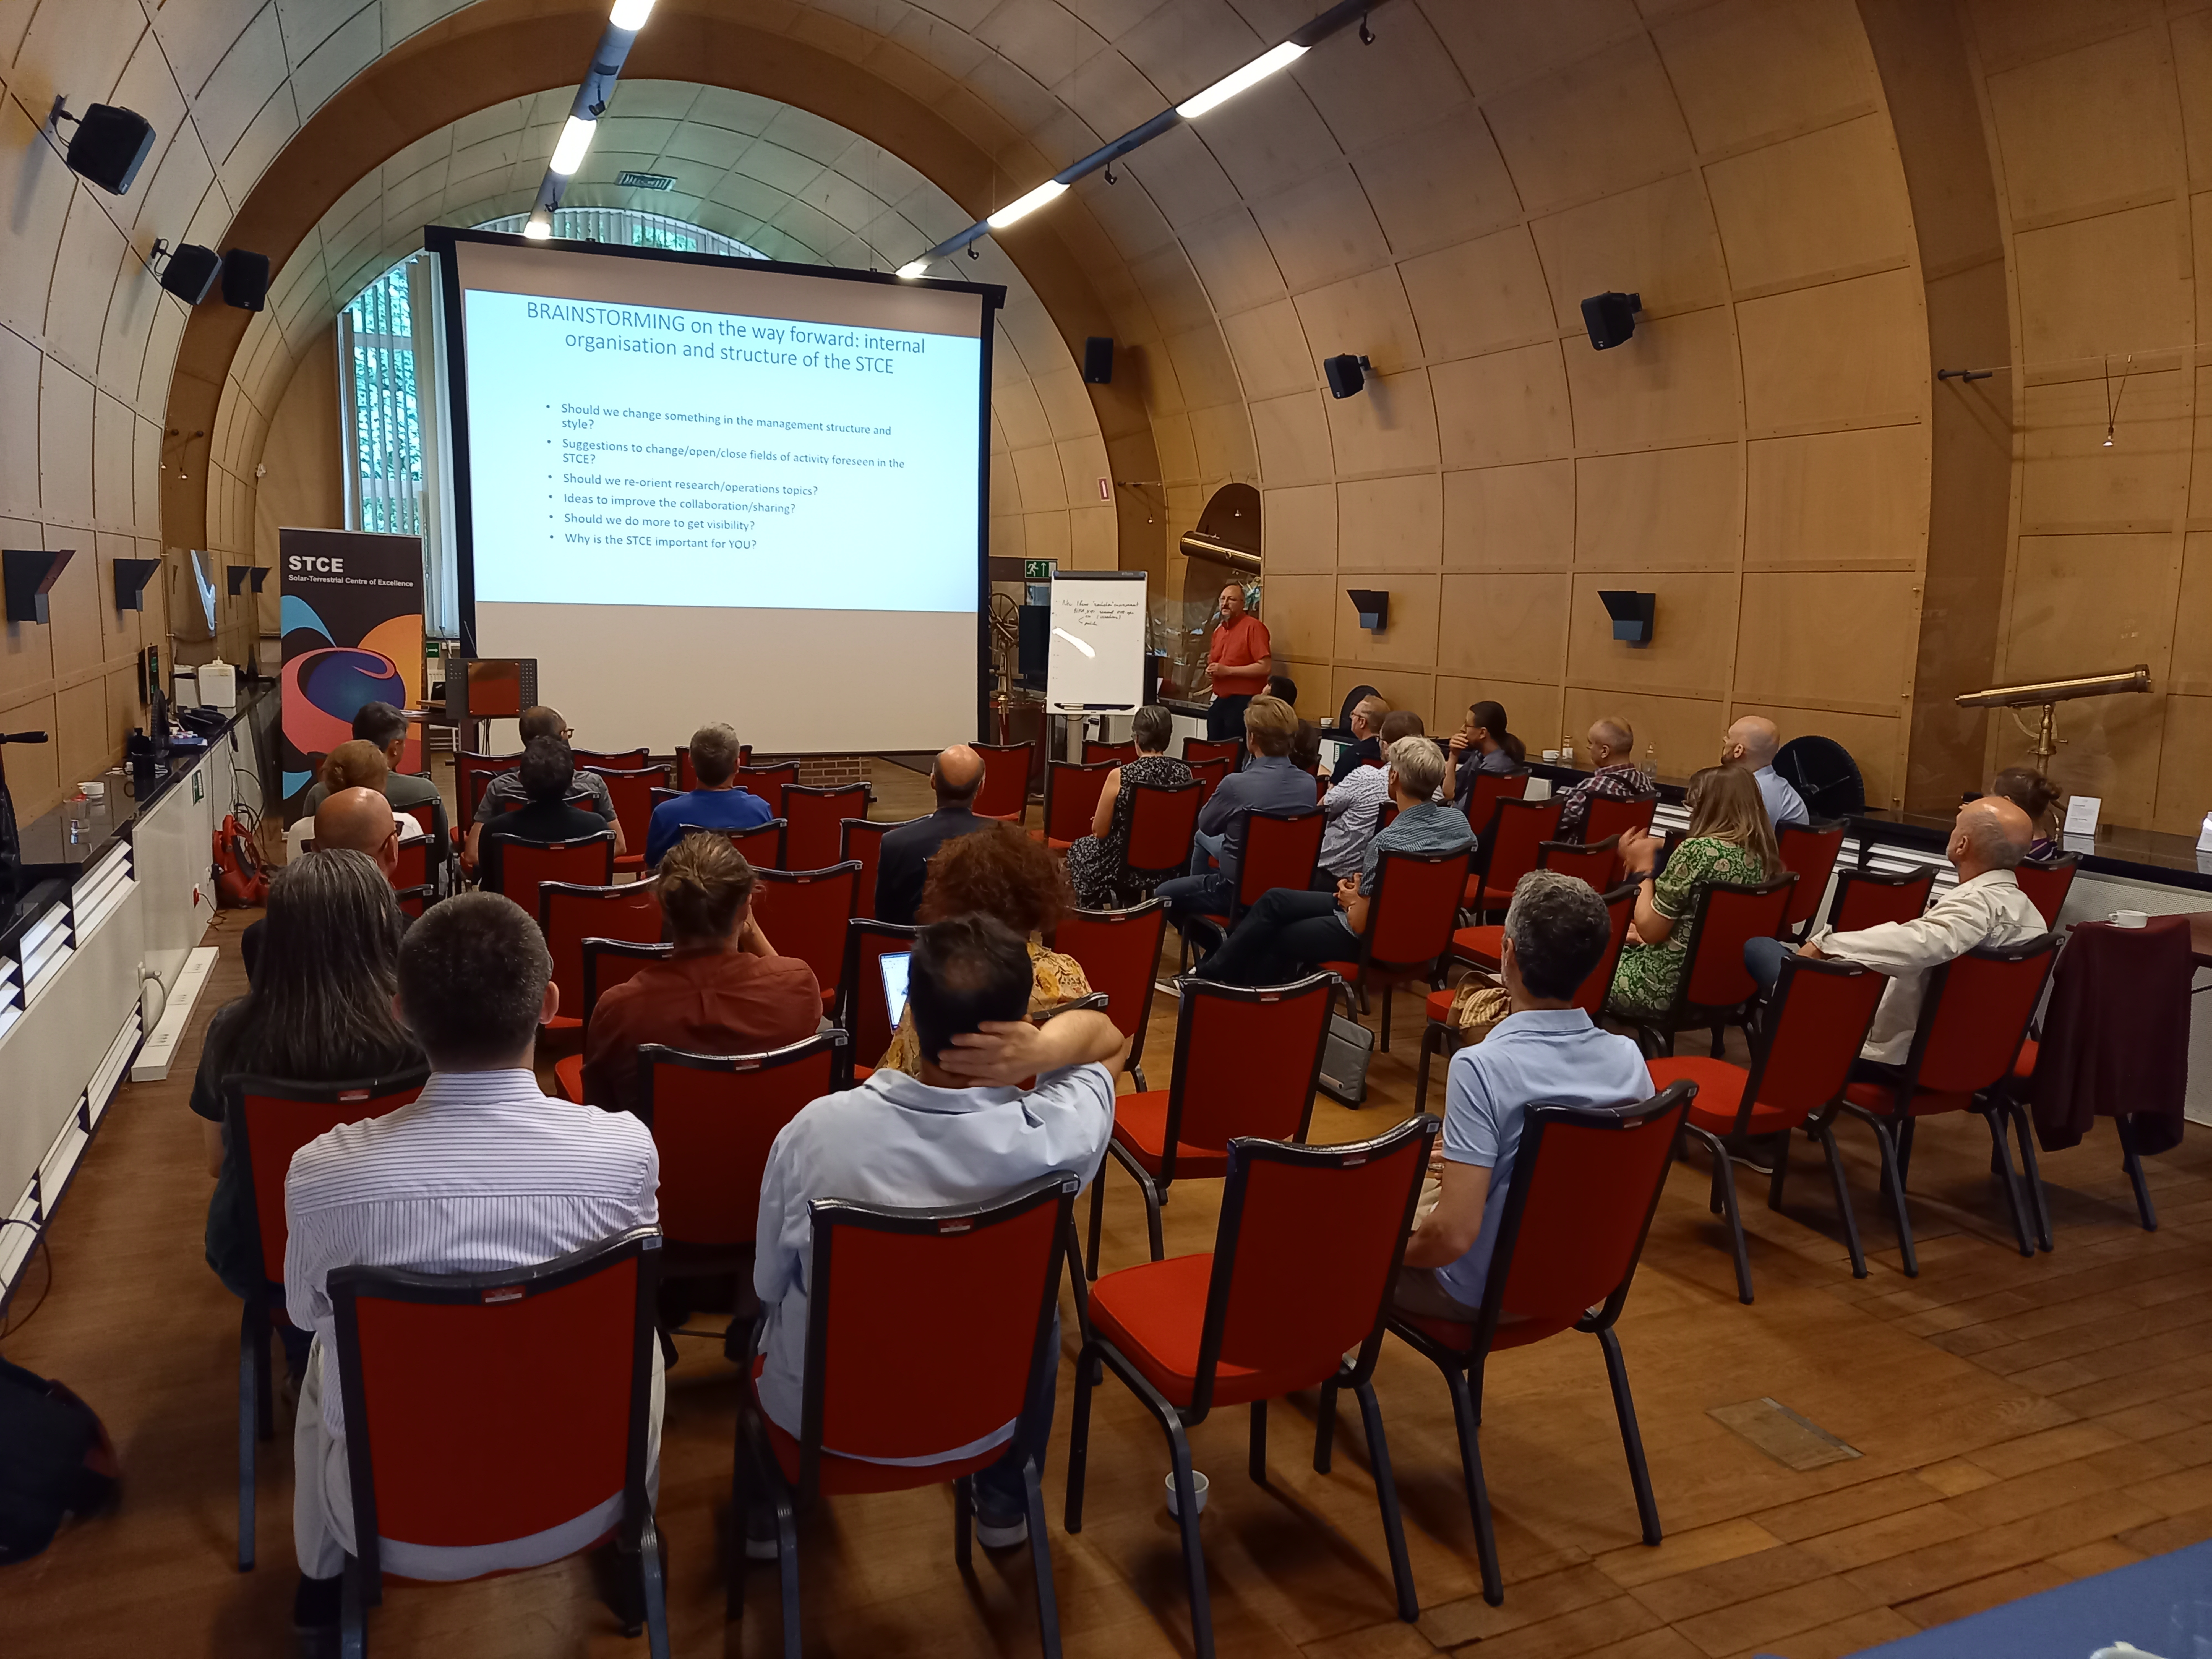
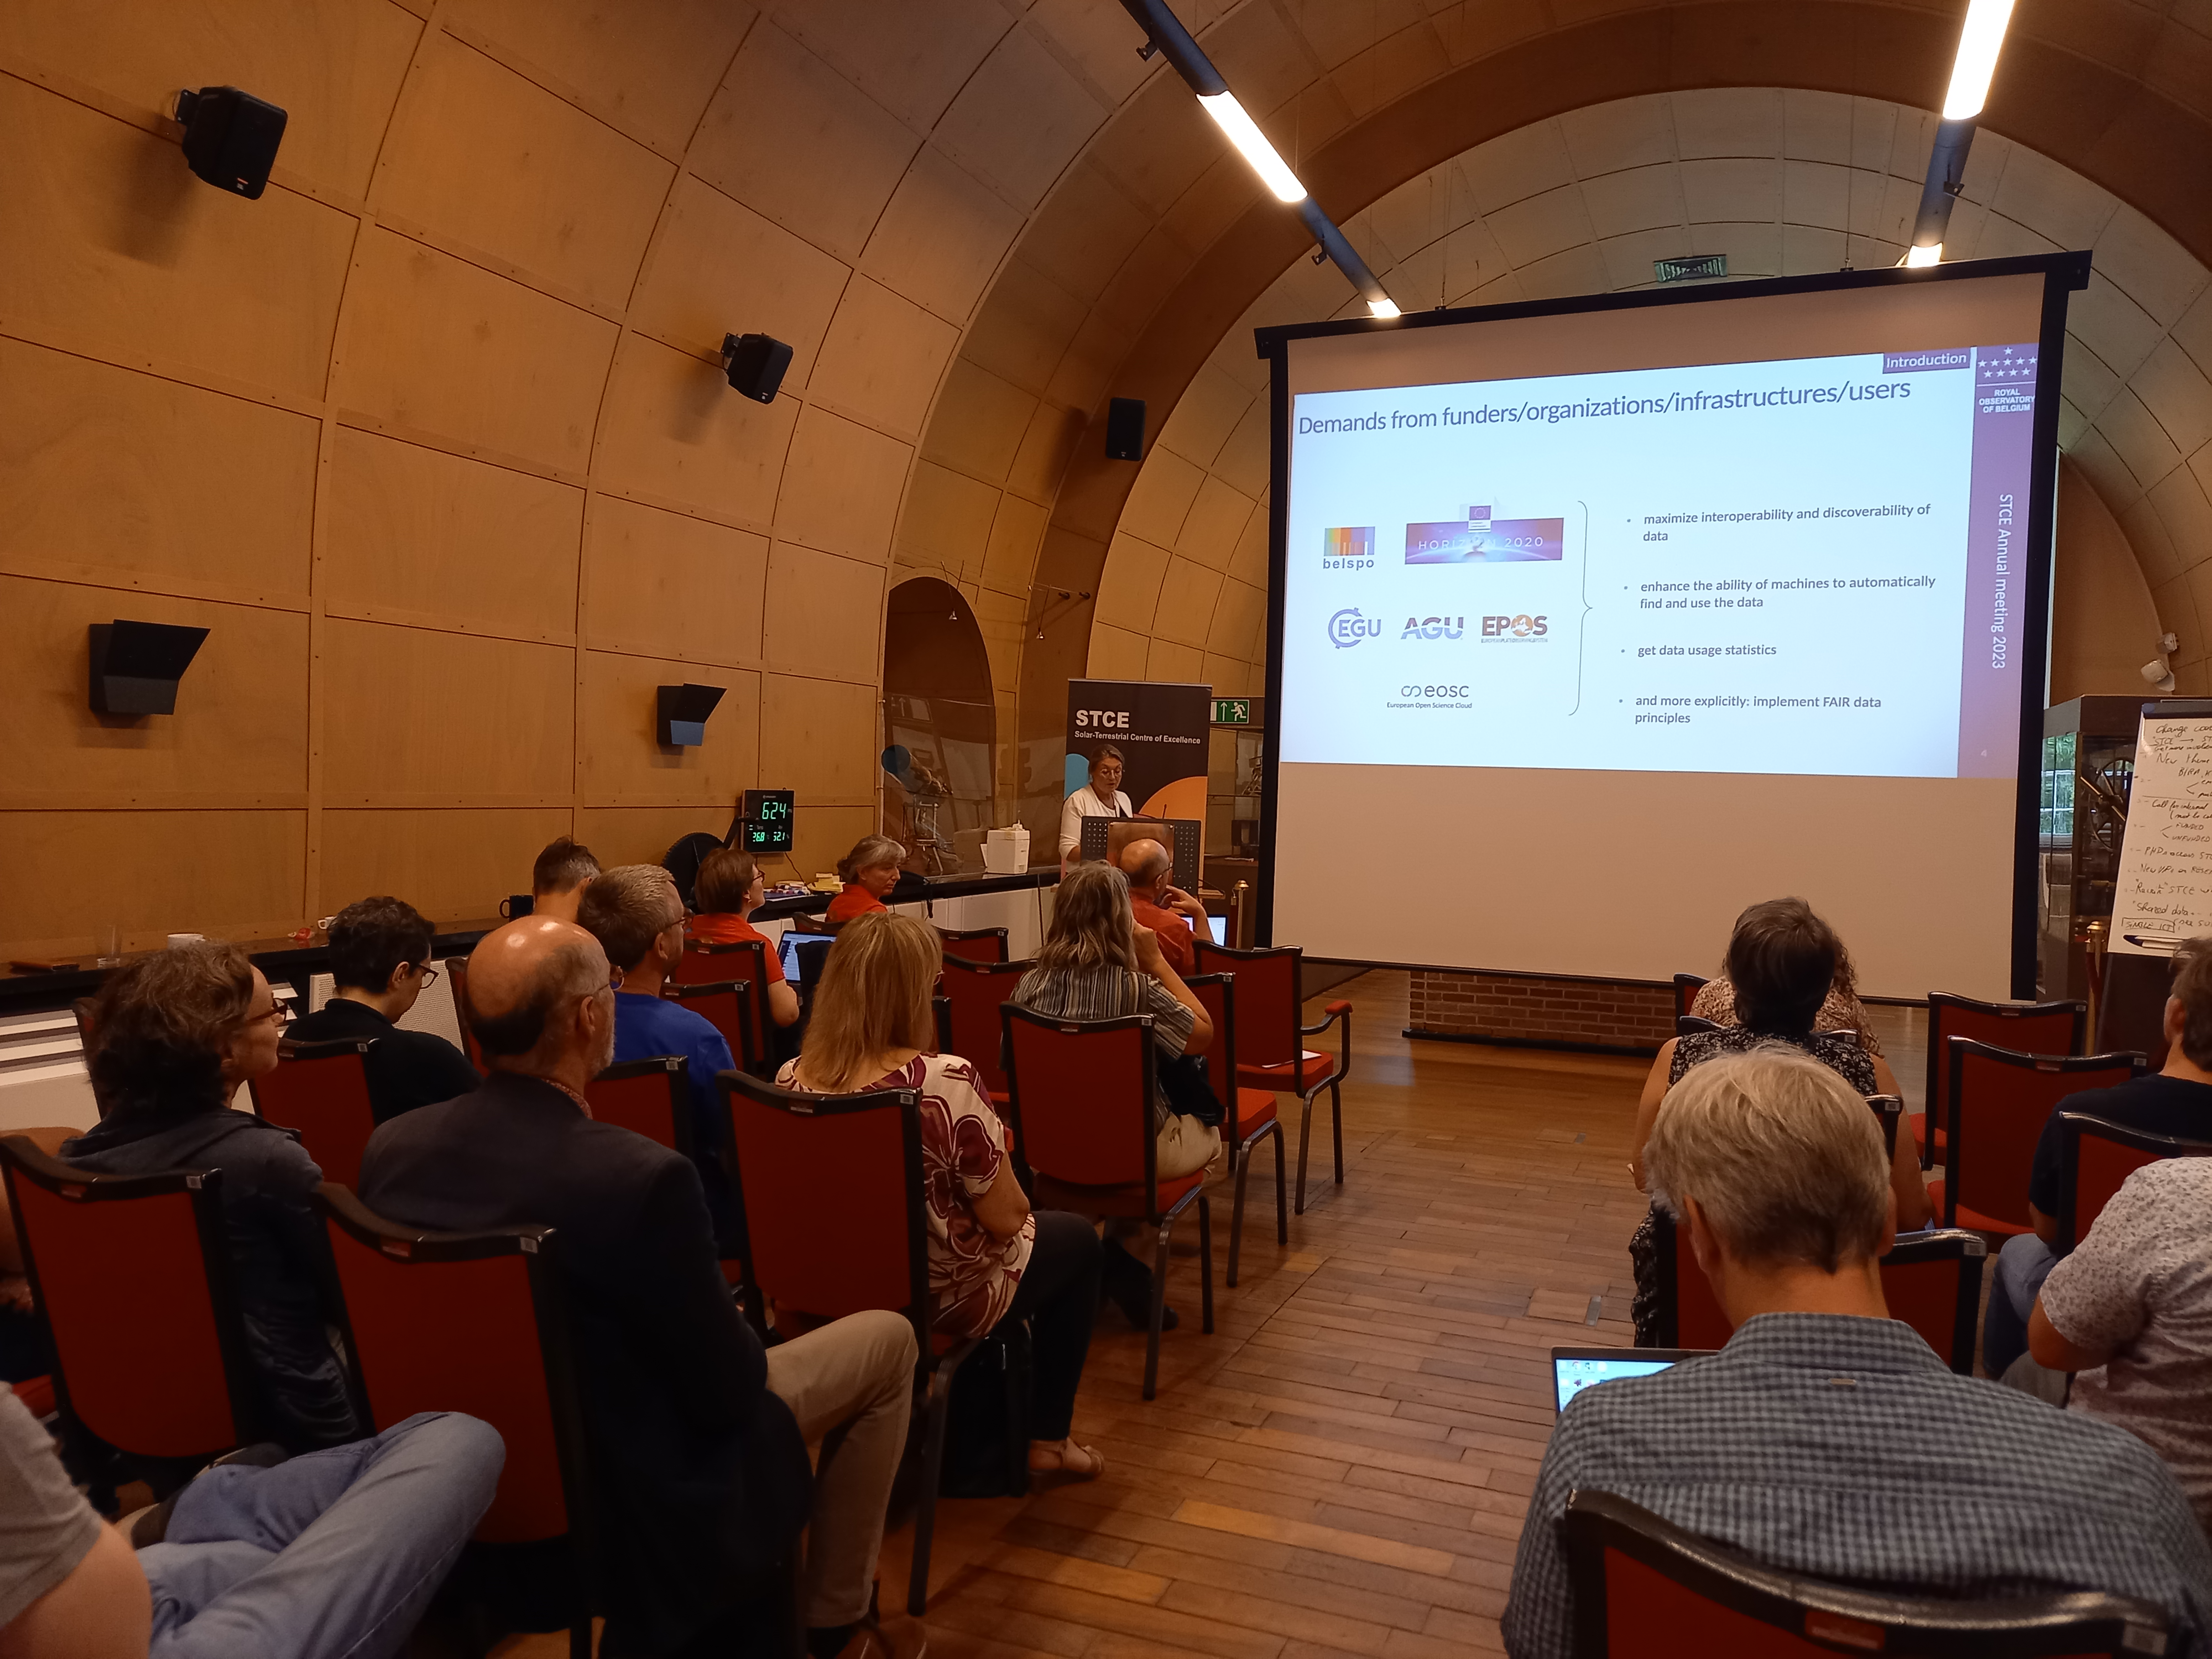
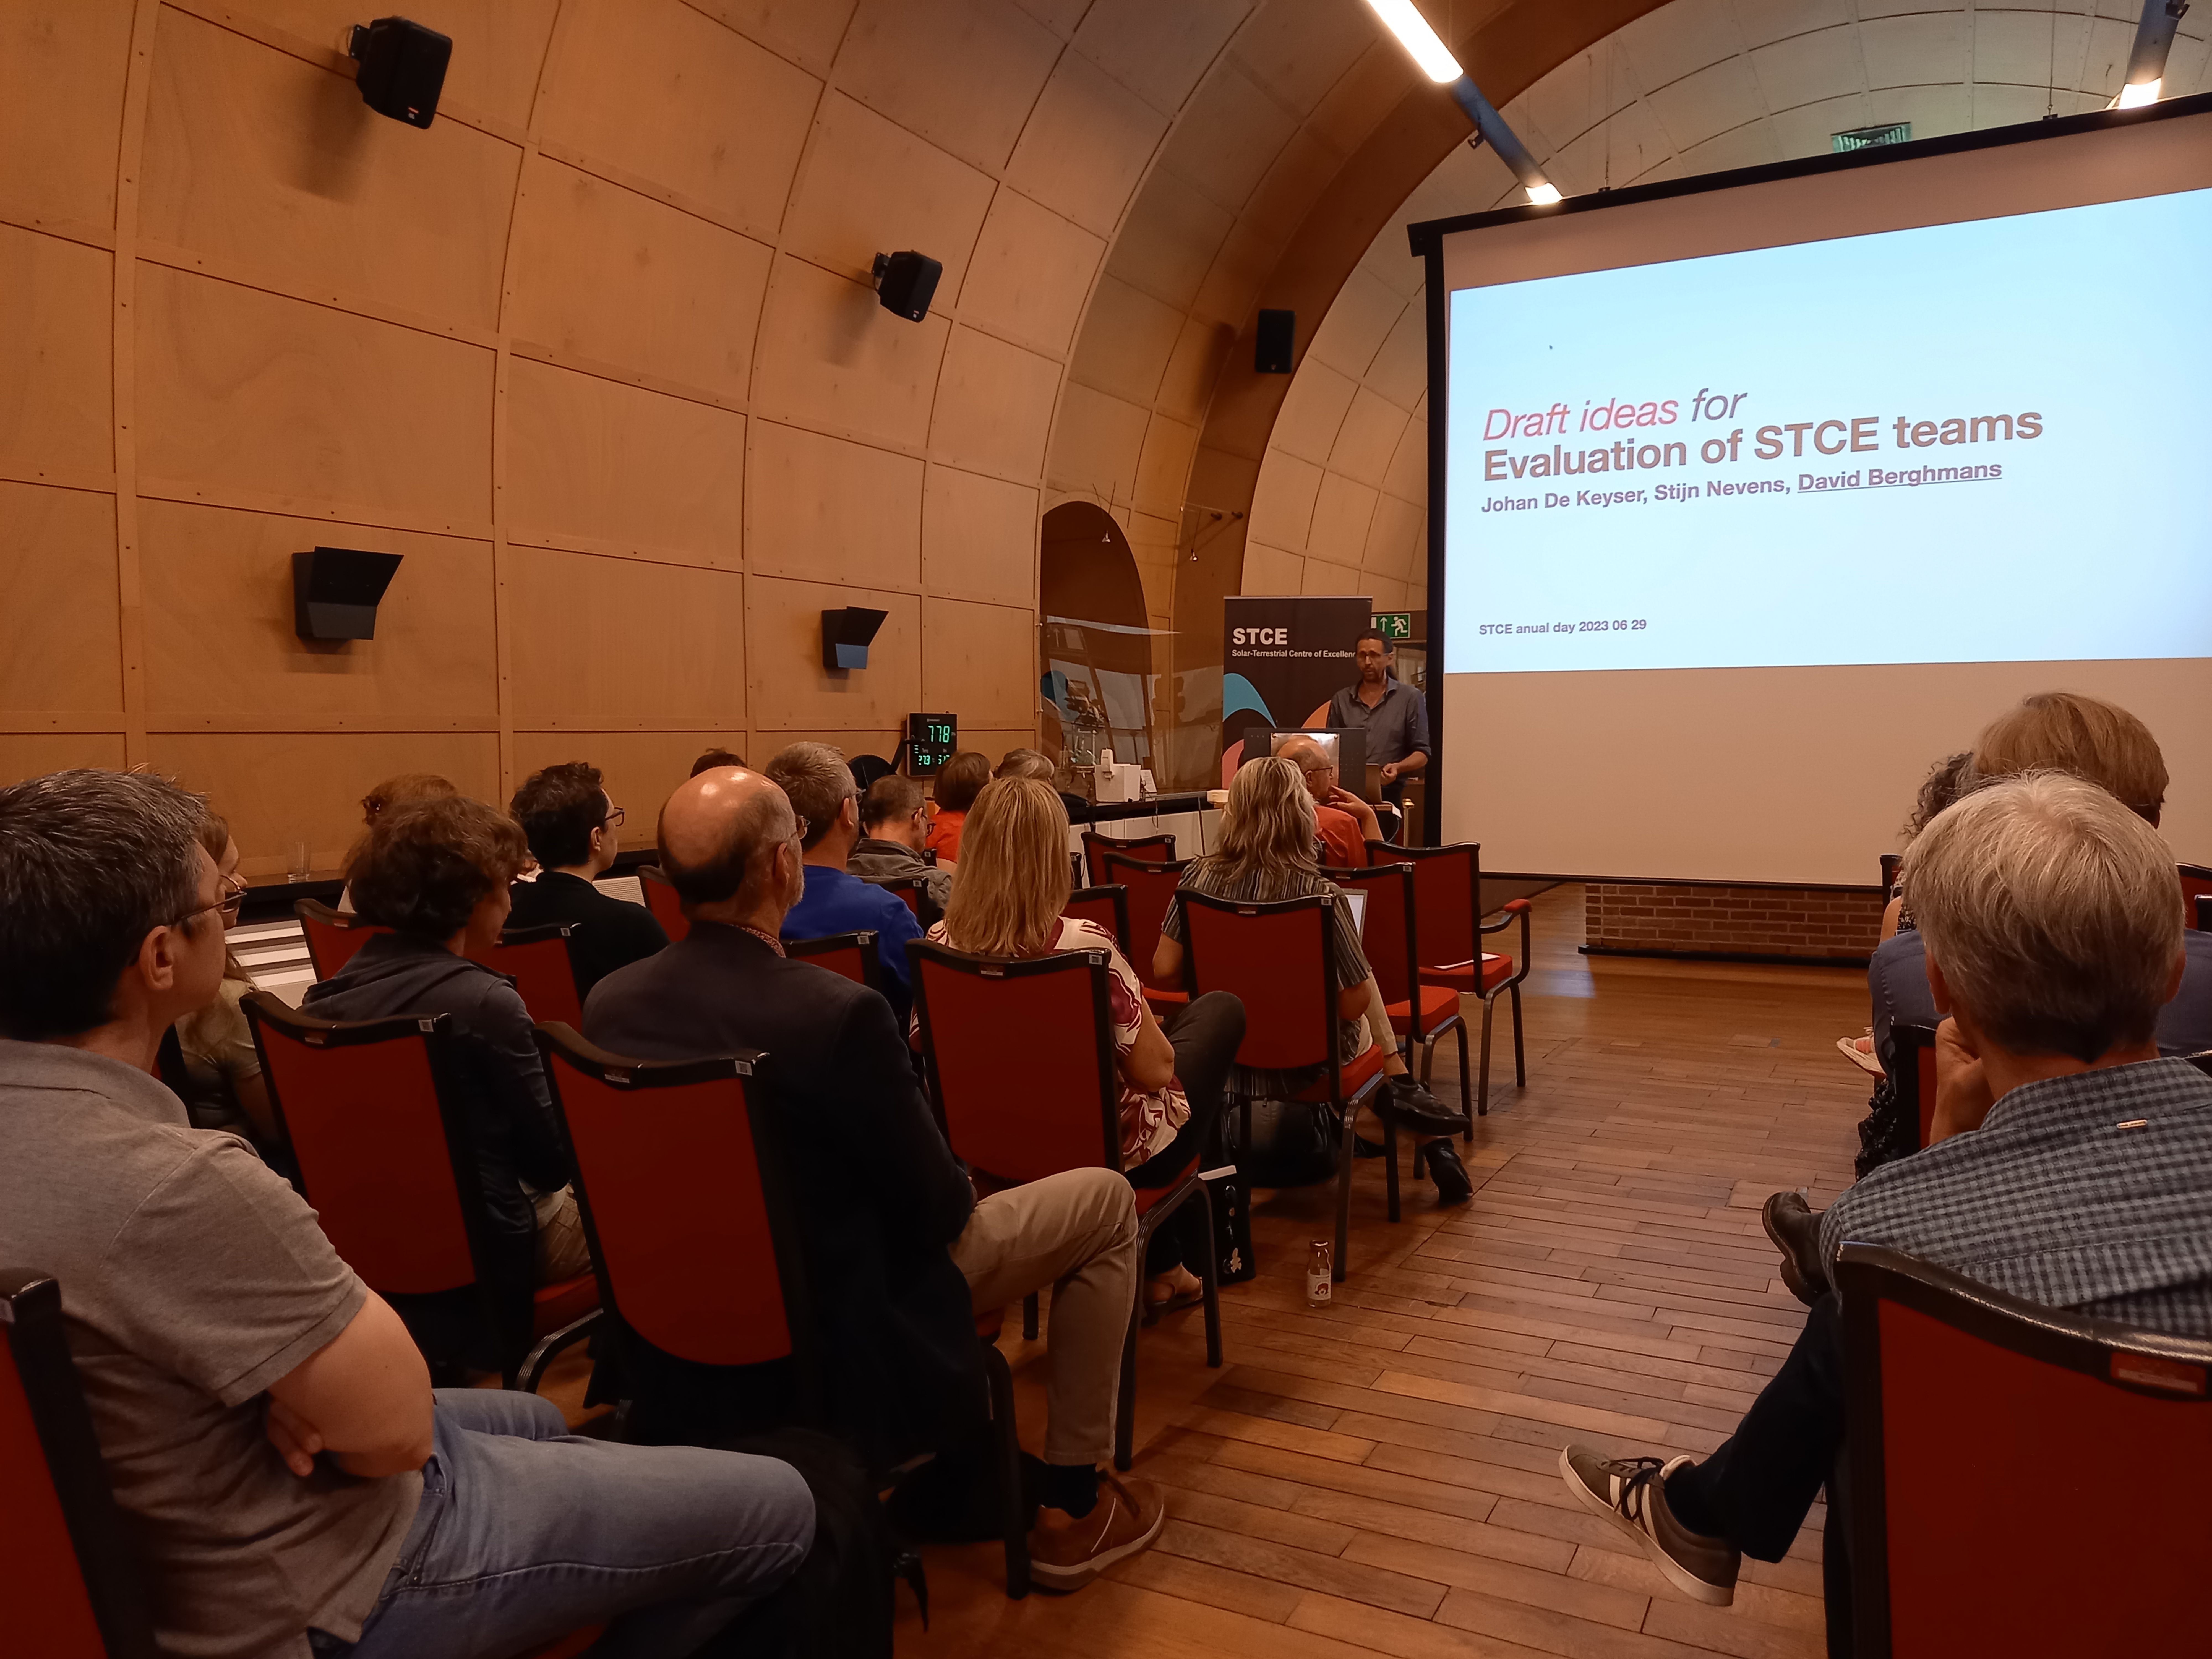
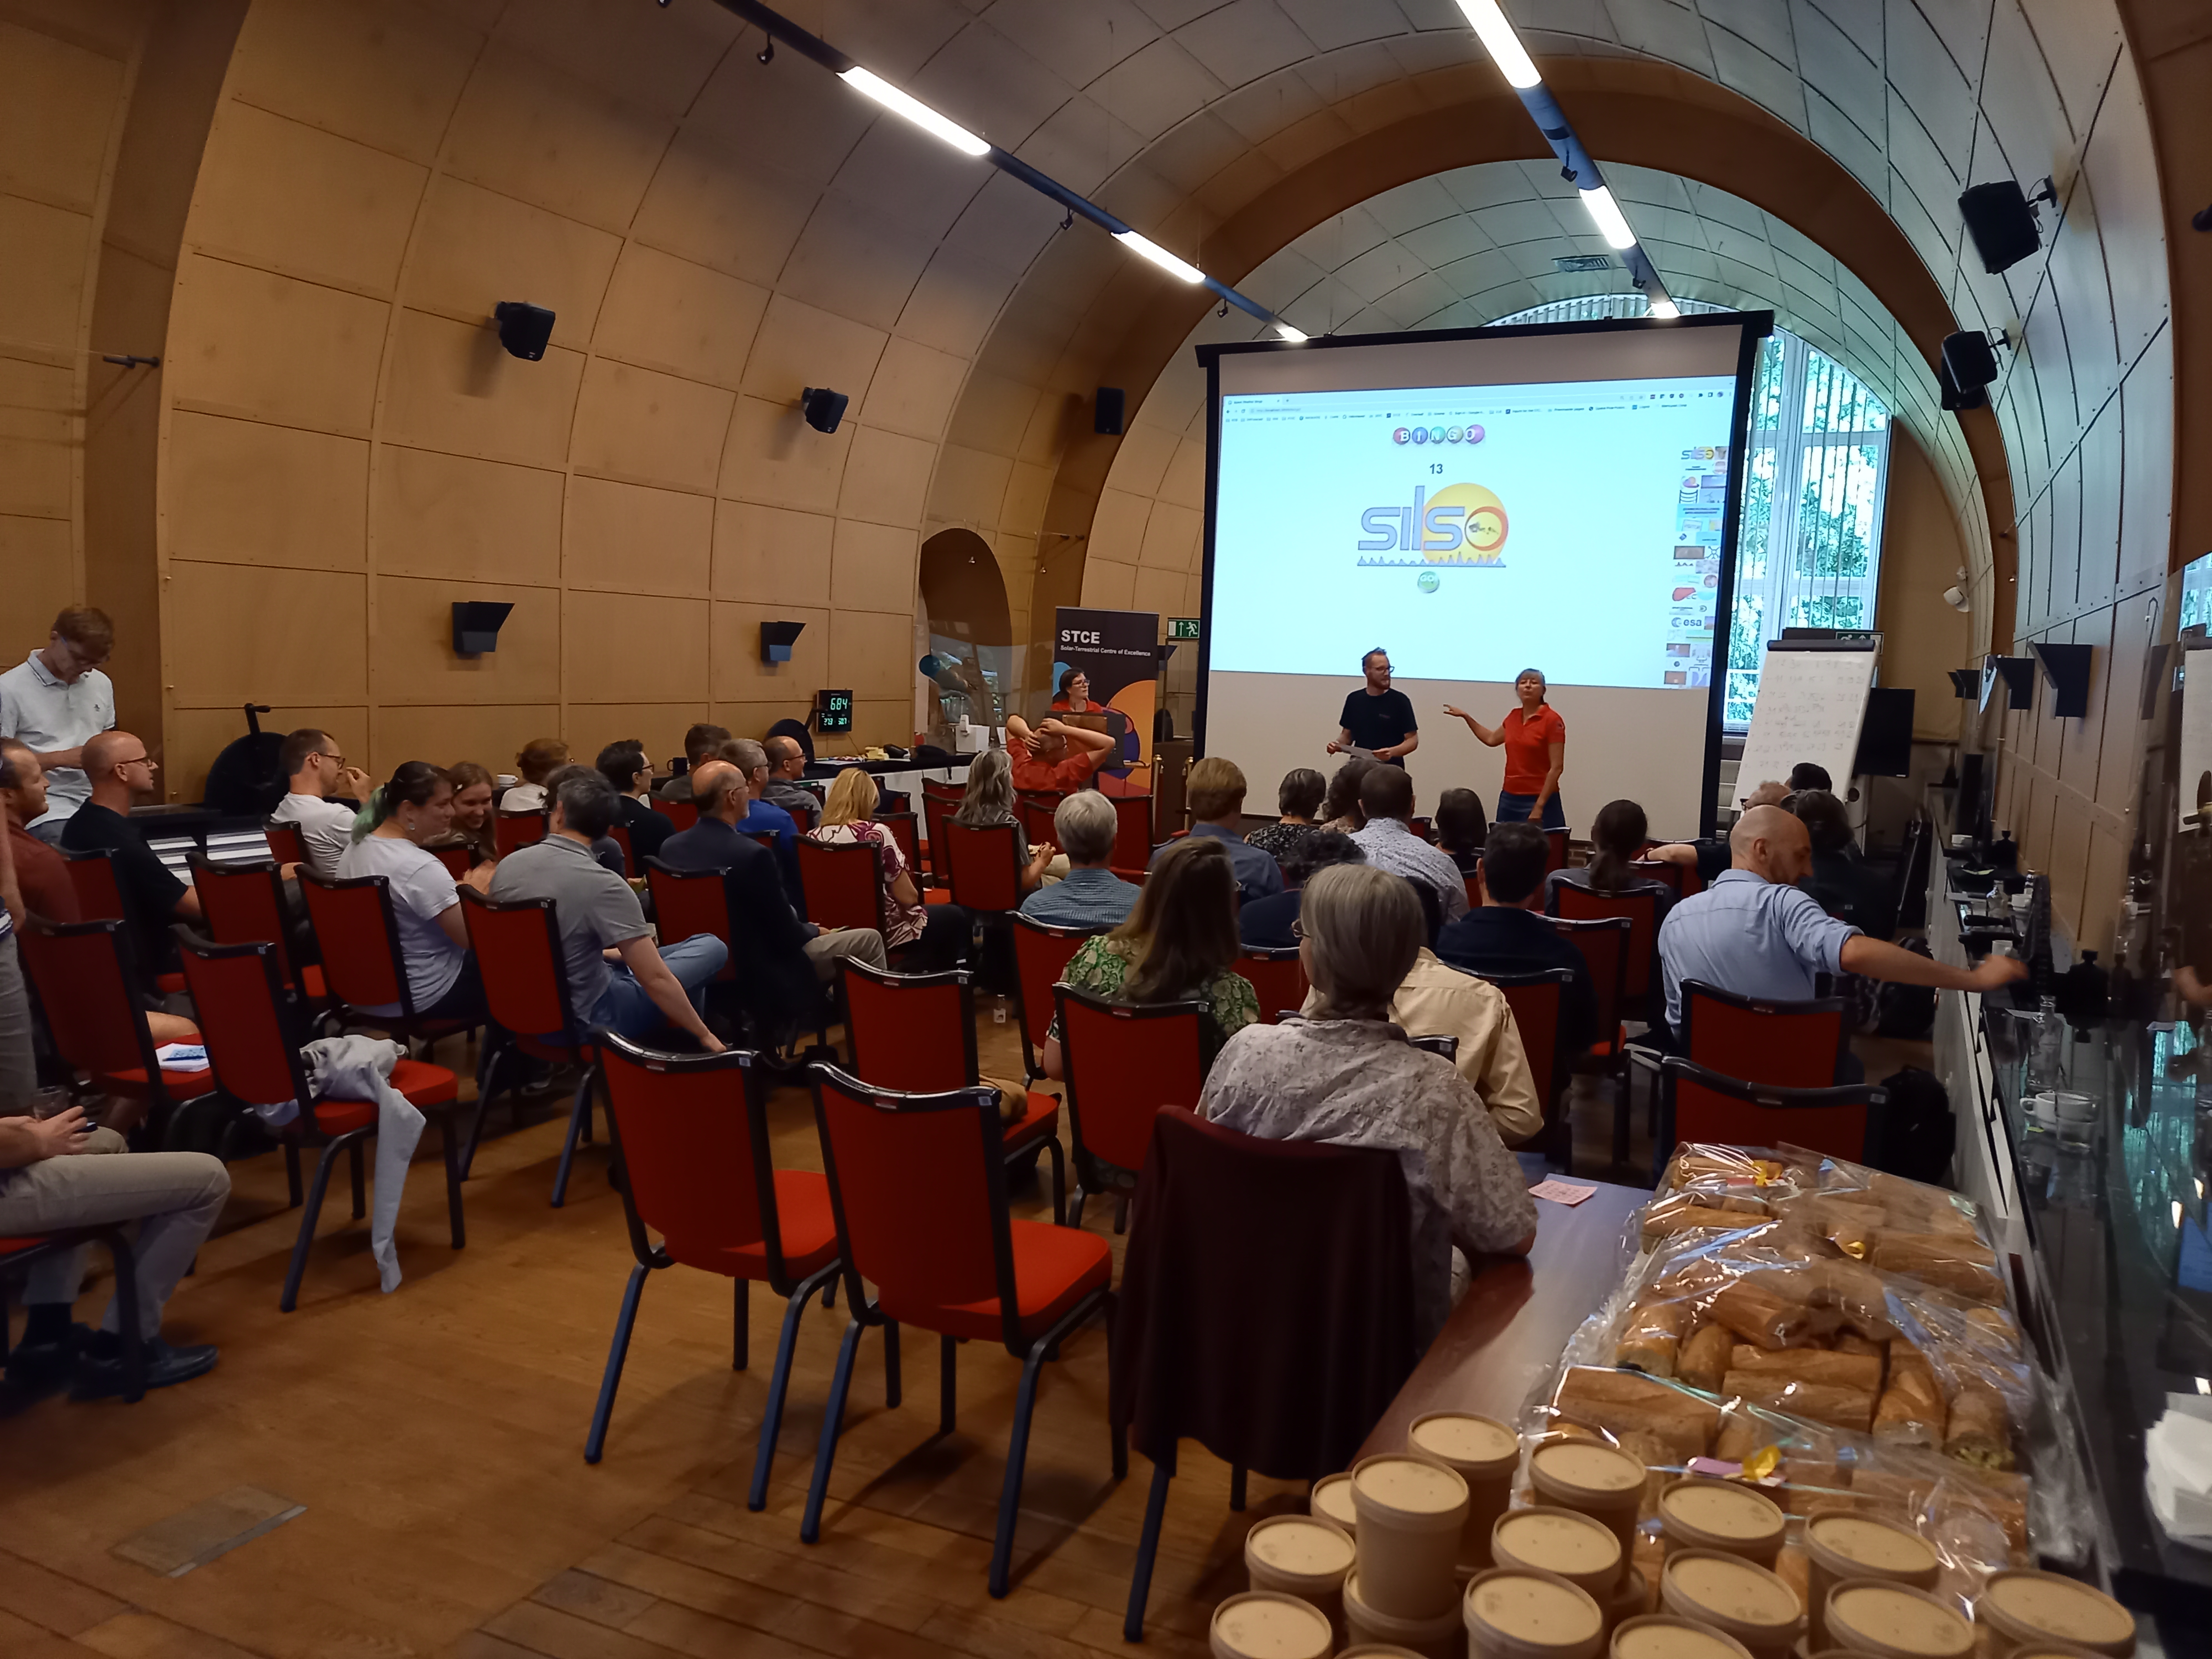
The STCE Annual Meeting is back!
Towards the end of 2022 and early 2023, the STCE executive committee put all its effort in a revitalisation of our centre. Working groups were tasked to rethink several aspects of the project. The goal of this exercise was to regain a coordinated STCE structure that fits most needs, now and in the future.
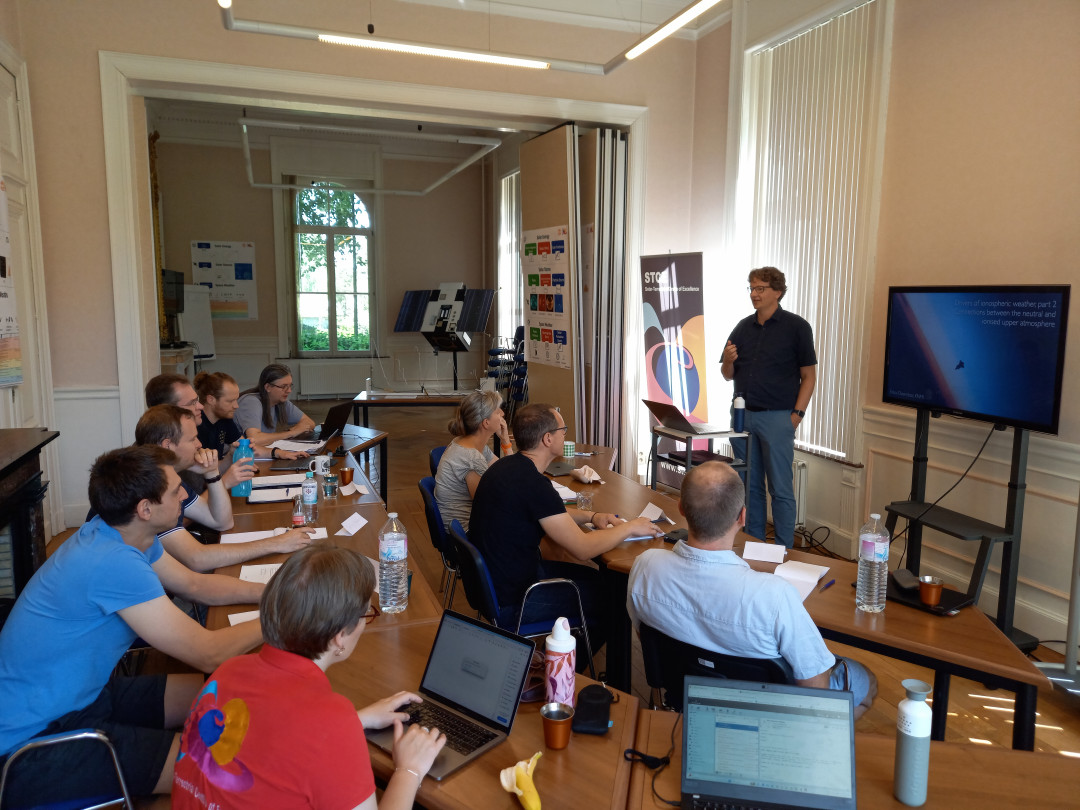
The progress of this re-invention exercise was presented at this year's annual meeting on June 29. All members of the STCE were invited to comment on the preliminary plans and to provide even more input and ideas during splinter brainstorm sessions. This was followed by progress talks on specific science topics, that illustrated good practices which can be integrated in many other STCE projects. Finally, a bingo game decided on the winner of an exclusive price: a private tour of the lesser-know highlights to discover in the three institutes of the STCE .
New SWIC courses (Corrected dates)
On popular demand, we have planned a new round of our Space Weather Introductory Courses..
Currently 3 more courses are planned with 8 seats available in each: two regular SWICs and a brand new one focussing on GNSS and HF communication.
Please register as soon as you can to secure your spot!
We invite you to a
- regular on-site SWIC from September 18 to 20: https://events.spacepole.be/event/170/
- bran new course: Space Weather impacts on ionospheric wave propagation - focus on GNSS and HF from December 4 to 6: https://events.spacepole.be/event/173/
- regular on-site SWIC from January 22 to 24 (2024!): https://events.spacepole.be/event/171/
Don't hesitate to ask us for more information on these courses or the options for a tailored one.
A new series of courses will be announced before the end of the year.
Review of solar and geomagnetic activity
Solar Active Regions (ARs) and flares
Solar flaring activity reached high levels in the past week when an X1 flare erupted from NOAA Active Region (AR) 3341 (Catania group 40) on 20 Jun at 17:09 UTC. The second brightest flare was an M4 event originating from the same AR detected on 22 June at 23:44 UTC. Nine M1 flares took place over the course of the week, three of which originated from NOAA AR 3341.
Coronal mass ejections
A partial halo Coronal Mass Ejection (CME) associated with an X1 flare that took place on 20 Jun at 17:09 UT produced a glancing blow to the Earth's environment on 24 June. A handful of other partial/full halo CMEs were also detected, however they were back-sided events that did not cause any effects.
Coronal Holes
A small northern coronal hole with negative polarity crossed the solar meridian on 24 June.
Proton flux levels
The greater than 10 MeV proton flux was at nominal levels throughout the week.
Electron fluxes at GEO
The greater than 2 MeV electron flux marginally exceeded the 1000 pfu threshold for intervals of a few hours on 19, 20, 22, and 23 June. The 24-hour electron fluence was at moderate levels until 23 June and at nominal levels for the rest of the week.
Solar wind
The Solar Wind (SW) conditions reflected a typical slow wind regime during the week with the exception of a glancing blow from a CME that arrived between 22 and 23 June. During this event, the SW speed increased to 500 km/s, while the total interplanetary magnetic field (Bt) was up to 8 nT and its North-South component (Bz) ranged between -7 and 7 nT.
Apart from this period, the SW speed remained below 400 km/s and the magnetic field strength at the levels mentioned above. The interplanetary magnetic field phi angle was predominately directed towards the Sun during the week.
Geomagnetism
Geomagnetic conditions were quiet to unsettled both globally and locally during most of the past week (NOAA Kp 1-3+, K BEL 1-3). The only exception was on 25 June when globally minor storm levels (NOAA Kp 5) were reached for a 3-hour interval (00:00-03:00 UT) followed by a gradual decline from unsettled to quiet levels (NOAA Kp 4+- 2). During the same period the local geomagnetic conditions remained unsettled (K BEL 3).
International Sunspot Number by SILSO
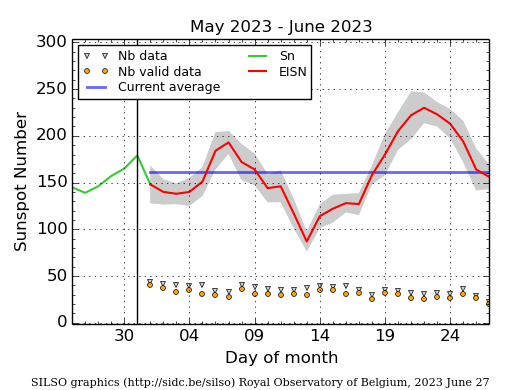
The daily Estimated International Sunspot Number (EISN, red curve with shaded error) derived by a simplified method from real-time data from the worldwide SILSO network. It extends the official Sunspot Number from the full processing of the preceding month (green line), a few days more than one solar rotation. The horizontal blue line shows the current monthly average. The yellow dots give the number of stations that provided valid data. Valid data are used to calculate the EISN. The triangle gives the number of stations providing data. When a triangle and a yellow dot coincide, it means that all the data is used to calculate the EISN of that day.
Noticeable Solar Events
| DAY | BEGIN | MAX | END | LOC | XRAY | OP | 10CM | TYPE | Cat | NOAA |
| 19 | 0337 | 0350 | 0358 | M1.4 | II/2III/1 | 3341 | ||||
| 19 | 1206 | 1214 | 1218 | S13E79 | M1.1 | SF | III/2II/2 | 3341 | ||
| 20 | 1109 | 1113 | 1117 | S21W64 | M1.0 | 1N | CTM/1 | 35 | 3342 | |
| 20 | 1117 | 1125 | 1135 | S21W64 | M1.8 | 1N | CTM/1 | 35 | 3342 | |
| 20 | 1544 | 1548 | 1555 | S12E68 | M1.0 | SF | 3341 | |||
| 20 | 1544 | 1548 | 1555 | S12E68 | M1.0 | SF | 3341 | |||
| 20 | 1627 | 1633 | 1642 | S22W69 | M1.1 | 1N | 35 | 3342 | ||
| 20 | 1627 | 1633 | 1637 | M1.0 | ||||||
| 20 | 1642 | 1709 | 1726 | X1.1 | 480 | II/2IV/1III/2 | 3341 | |||
| 20 | 1642 | 1709 | 1726 | X1.0 | 480 | II/2 | ||||
| 21 | 1231 | 1244 | 1254 | S14E59 | M1.1 | 1N | VI/1 | 40 | 3341 | |
| 21 | 1231 | 1244 | 1254 | S14E59 | M1.1 | 1N | VI/1 | 40 | 3341 | |
| 21 | 1531 | 1538 | 1543 | N19W6 | M1.0 | SF | III/3 | 3337 | ||
| 22 | 1057 | 1121 | 1136 | S12E44 | M1.1 | 1N | VI/1III/1 | 40 | 3341 | |
| 22 | 2329 | 2344 | 2357 | M4.8 | 140 | III/1II/2IV/1 | 38 | 3340 | ||
| 24 | 1211 | 1217 | 1224 | N21W42 | M1.1 | SN | III/2V/2 | 43 | 3337 |
| LOC: approximate heliographic location | TYPE: radio burst type |
| XRAY: X-ray flare class | Cat: Catania sunspot group number |
| OP: optical flare class | NOAA: NOAA active region number |
| 10CM: peak 10 cm radio flux |
PROBA2 Observations
Solar Activity
Solar flare activity fluctuated from low to high during the week.
In order to view the activity of this week in more detail, we suggest to go to the following website from which all the daily (normal and difference) movies can be accessed: https://proba2.oma.be/ssa
This page also lists the recorded flaring events.
A weekly overview movie can be found here (SWAP week 691). https://proba2.oma.be/swap/data/mpg/movies/weekly_movies/weekly_movie_2023_06_19.mp4
Details about some of this week's events can be found further below.
If any of the linked movies are unavailable they can be found in the P2SC movie repository here https://proba2.oma.be/swap/data/mpg/movies/
Tuesday Jun 20
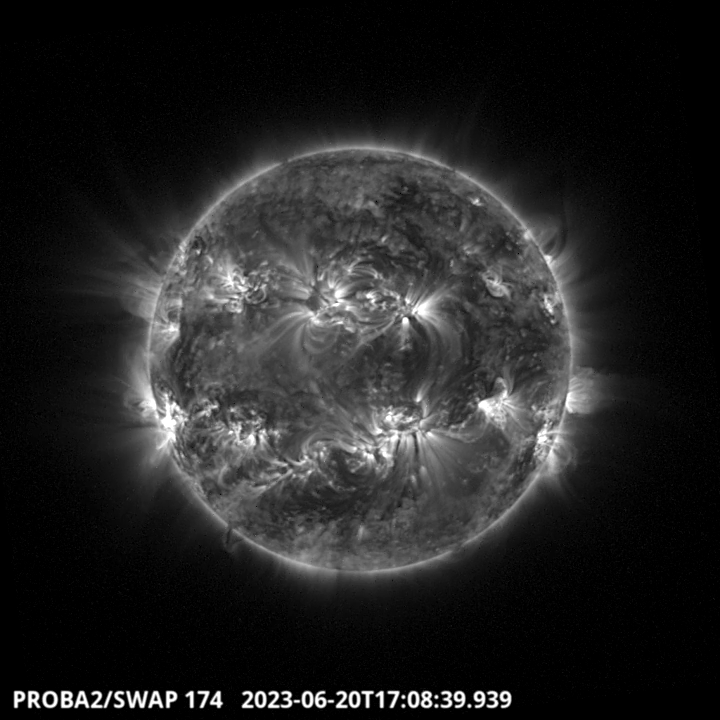
Around 17:00 UT, the active region NOAA 3341 at the South Eastern limb produced a strong
X1.1 flare associated with a CME, both clearly visible in SWAP observations. Find a SWAP movie of the event here: https://proba2.sidc.be/swap/movies/20230620_swap_movie.mp4
Thursday Jun 22
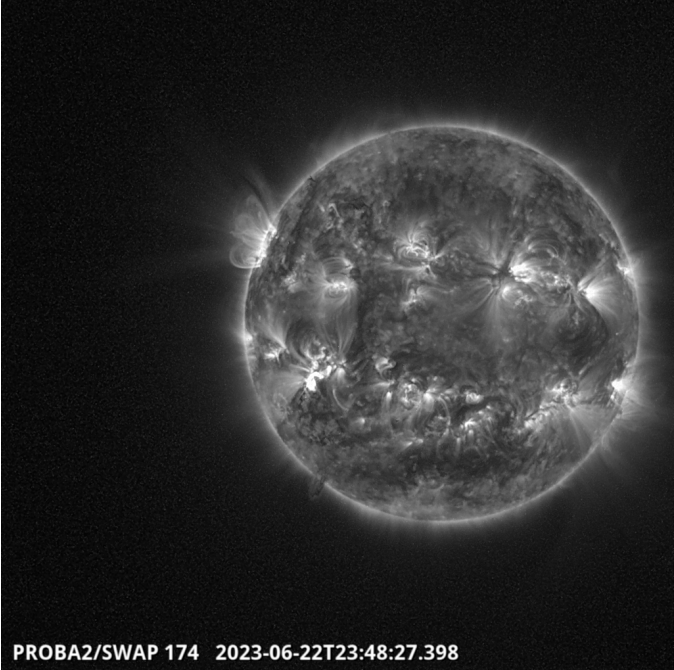
A M4.8 flare happened around 23:45 UT in active region NOAA 3341 on the South-Eastern part of the solar disk. Find a SWAP movie of the event here: https://proba2.sidc.be/swap/movies/20230622_swap_movie.mp4
Geomagnetic Observations in Belgium
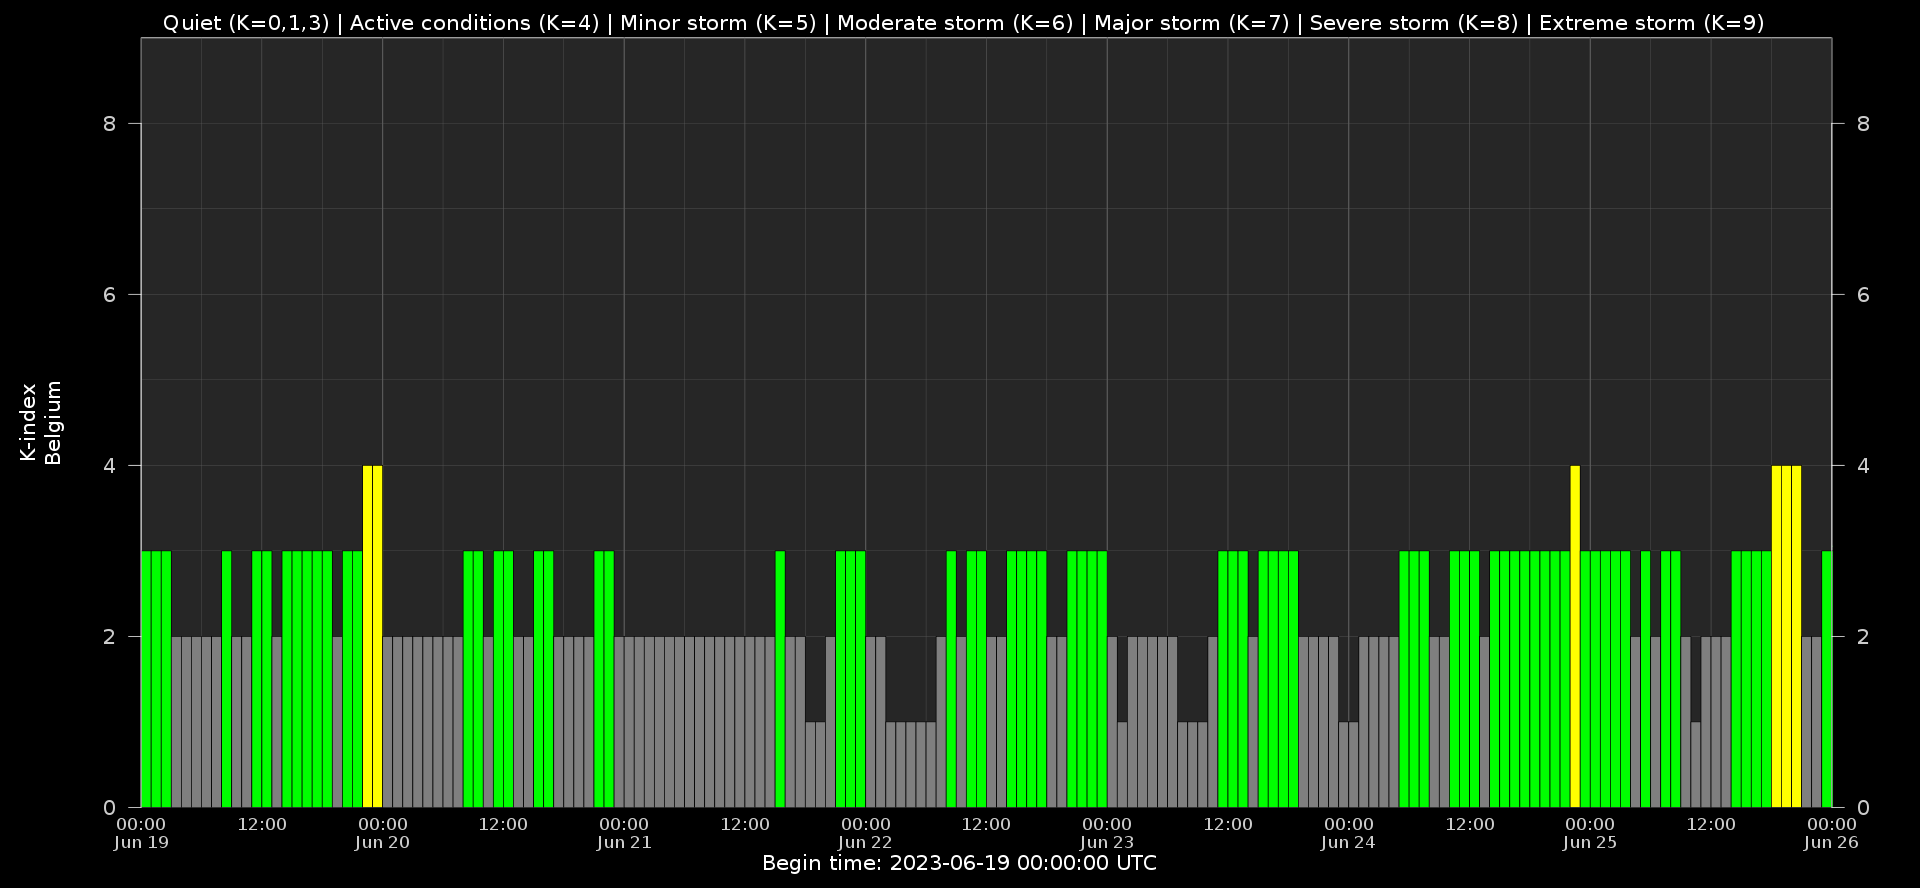
Local K-type magnetic activity index for Belgium based on data from Dourbes (DOU) and Manhay (MAB). Comparing the data from both measurement stations allows to reliably remove outliers from the magnetic data. At the same time the operational service availability is improved: whenever data from one observatory is not available, the single-station index obtained from the other can be used as a fallback system.
Both the two-station index and the single station indices are available here: http://ionosphere.meteo.be/geomagnetism/K_BEL/
Review of Ionospheric Activity
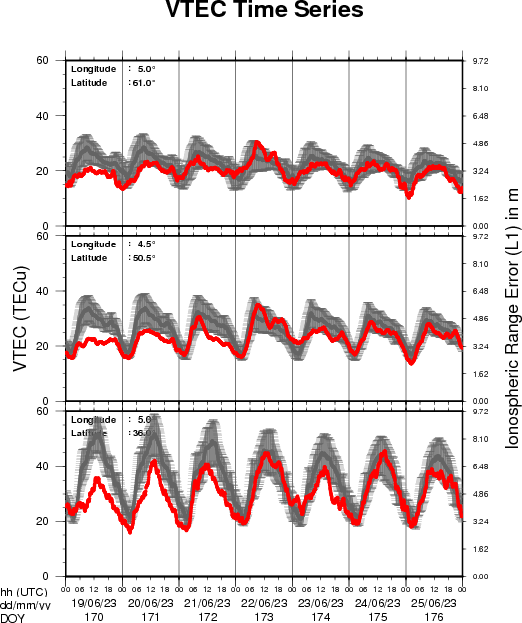
The figure shows the time evolution of the Vertical Total Electron Content (VTEC) (in red) during the last week at three locations:
a) in the northern part of Europe(N 61deg E 5deg)
b) above Brussels(N 50.5deg, E 4.5 deg)
c) in the southern part of Europe(N 36 deg, E 5deg)
This figure also shows (in grey) the normal ionospheric behaviour expected based on the median VTEC from the 15 previous days.
The VTEC is expressed in TECu (with TECu=10^16 electrons per square meter) and is directly related to the signal propagation delay due to the ionosphere (in figure: delay on GPS L1 frequency).
The Sun's radiation ionizes the Earth's upper atmosphere, the ionosphere, located from about 60km to 1000km above the Earth's surface.The ionization process in the ionosphere produces ions and free electrons. These electrons perturb the propagation of the GNSS (Global Navigation Satellite System) signals by inducing a so-called ionospheric delay.
See http://stce.be/newsletter/GNSS_final.pdf for some more explanations ; for detailed information, see http://gnss.be/ionosphere_tutorial.php
The SIDC Space Weather Briefing
The Space Weather Briefing presented by the forecaster on duty from June 19 to 25. It reflects in images and graphs what is written in the Solar and Geomagnetic Activity report: https://www.stce.be/briefings/20230626_SWbriefing.pdf
If you need to access the movies, contact us: stce_coordination at stce.be
Activities at the STCE
Check out our activity calendar: activities and encounters with the Sun-Space-Earth system and Space Weather as the main theme. We provide occasions to get submerged in our world through educational, informative and instructive activities.
If you want your event in our calendar, contact us: stce_coordination at stce.be
* Aug 21, Lecture: The Sun, VVS Summerschool, Leuven, Belgium
* Sept 9-10, Open Doors at the Humain Radioastronomy Station, Humain, Belgium
* Sep 18-20, STCE Space Weather Introductory Course, Brussels, Belgium - Registrations are open
* Sep 26, post-Space Weather Introductory Course, by JMG, date and place TBD - registration is included in the Sep SWIC
* Nov 18-19, e-SWAN Space Weather School: data, models and services, by the STCE, Toulouse, France
* Dec 4-6, STCE course: Space Weather impacts on ionospheric wave propagation - focus on GNSS and HF, Brussels, Belgium - Registrations are open
* Jan 22-24, 2024, STCE Space Weather Introductory Course, Brussels, Belgium - Registrations are open
* Jan 25, 2024, post-Space Weather Introductory Course, by JMG and MeteoWing, place TBD - registration is included in the Jan SWIC
Check: https://www.stce.be/calendar