- Table of Content
- 1.The best of......
- 2.JSWSC Topical ...
- 3.Review of Spac...
- 4.International ...
- 5.Noticeable Sol...
- 6.PROBA2 Observa...
- 7.Review of Iono...
- 8.Geomagnetic Ob...
- 9.The SIDC Space...
- 10.Activities at ...
2. JSWSC Topical Issue on CMEs, ICMEs and SEPs
3. Review of Space Weather
4. International Sunspot Number by SILSO
5. Noticeable Solar Events
6. PROBA2 Observations
7. Review of Ionospheric Activity
8. Geomagnetic Observations in Belgium
9. The SIDC Space Weather Briefing
10. Activities at the STCE
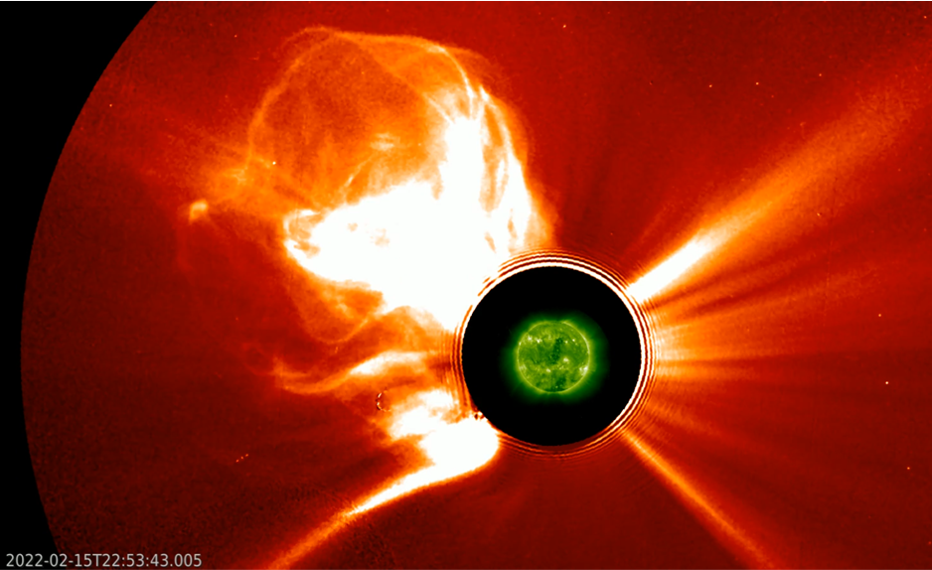
The best of... 2022!
A compilation of the most memorable space weather moments of 2022 can be found at the STCE's dedicated solar cycle highlights webpage: http://www.stce.be/highlights Using the versatile Space Weather JHelioviewer (SWHV : http://swhv.oma.be/user_manual/ ) software, a ***MOVIE*** was created containing one or more clips of each event. Usually, images from SDO, STEREO, and SOHO have been used, occasionally supplemented with imagery from Solar Orbiter, ROB/USET and the GONG/H-alpha network. The movie can be found on YouTube https://www.youtube.com/watch?v=M3XSGGpqr1Y, whereas the page with the accompanying information is at https://www.stce.be/news/654/welcome.html
We wish you a happy viewing!
JSWSC Topical Issue on CMEs, ICMEs and SEPs
The deadline for submissions to the JSWSC Topical Issue "CMEs, ICMEs, SEPs: Observational, Modelling, and Forecasting Advances" has been extended to ***31 August 2023***.
This TI aims at highlighting recent advances in the study of (Interplanetary) Coronal mass Ejections ((I)CMEs) and Solar Energetic Particle events (SEPs), and in the forecasting of their space weather impact at Earth and other locations in the heliosphere. Contributed papers may present recent developments in the observational, theoretical, and modelling investigation of CMEs/ICMEs and SEPs.
The Topical Editor-in-Chief (T-EiC) is Camilla Scolini (camilla.scolini(at)unh.edu) from the University of New Hampshire, USA.
Further information on this Topical Issue can be found on the dedicated webpage of the Journal for Space Weather and Space Climate at https://www.swsc-journal.org/topical-issues-open-for-submission
Review of Space Weather
Solar Active Regions (ARs) and flares
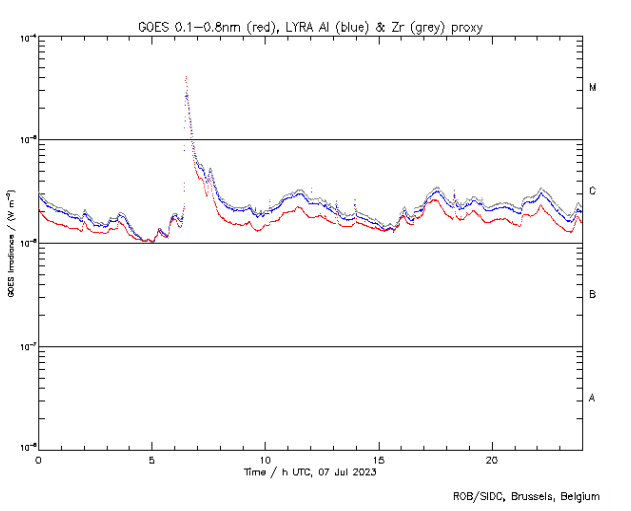
The solar flaring activity was at moderate levels for most of the week and decreased to low levels towards the end of the week, with several C-class flares and five M-class flares recorded. The largest flare detected was an M4.0 flare, peaking at 06:29 UTC on July 07, associated with NOAA AR 3359. Another notable flare was an M1.4 flare, peaking at 06:53 UTC on July 03, produced by NOAA AR 3358. Additionally, an M1.5 flare, peaking at 12:35 UTC on July 04, an M1.0 flare, peaking at 18:58 UTC on July 05, and an M1.1 flare, peaking at 10:49 UTC on July 06, were associated with NOAA AR 3354.
Coronal mass ejections
A solar coronal dimming was observed on July 04, starting at around 02:12 UTC and ending around 04:09 UTC. The coronal dimming was located close to sunspot region NOAA AR 3359. A partial halo coronal mass ejection (CME), associated to the dimming, was first observed in SOHO/LASCO-C2 at around 04:12 UTC on July 04. The CME was directed to the south-east and estimated to give a glancing blow to the Earth's environment either late on July 06 or early on July 07, but no ICME arrival was confirmed by the solar wind data later. No other Earth-directed CMEs were observed in the available coronagraph imagery.
Coronal Holes
Two positive polarity coronal holes, one in the northern hemisphere and one the southern hemisphere were visible in the week. The first one began to transit the central meridian on July 04 and the second one on July 05.
Proton flux levels
The greater than 10 MeV proton flux was at nominal levels throughout the past week.
Electron fluxes at GEO
The greater than 2 MeV electron flux was above the 1000 pfu threshold at the start of the week and frequently exceeded the thresholds for prolonged periods of time until July 06, when it returned back to background values.
The 24-hour electron fluence was at normal to moderate levels during the past week.
Solar wind
The solar wind parameters have been indicative of slow solar wind conditions at the start of the week. The solar wind speed showed a gradually decreasing trend, decreasing from 430 km/s to values around 340 km/s. The orientation of the magnetic field was predominantly in the positive sector (field directed away from the Sun) with a variable north-south component Bz ranging between -2 to 6 nT. A high-speed stream from a positive polarity coronal hole began to influence the Earth from July 05. The solar wind conditions became slightly disturbed with the total interplanetary magnetic field rose to 11 nT at around 20:40 UTC on July 05. The north-south component of the magnetic field was variable, ranging between -9 to 8 nT. The solar wind velocity followed an increasing trend, rising from 340 km/s to 540 km/s. By the end of the week, the solar wind speed was slowly decreasing and levelled out around 380 km/s.
Geomagnetism
The geomagnetic conditions were at quiet to unsettled levels (NOAA KP 1-3 and K-Bel 1-3) over the week, with an isolated active period globally from 06:00 UTC to 12:00 UTC on July 07 and from 00:00 UTC to 03:00 UTC on July 08 due to high speed stream influence. Locally over Belgium a short isolated active period was observed between 12:00 and 18:00 UTC on July 06.
International Sunspot Number by SILSO

The daily Estimated International Sunspot Number (EISN, red curve with shaded error) derived by a simplified method from real-time data from the worldwide SILSO network. It extends the official Sunspot Number from the full processing of the preceding month (green line), a few days more than one solar rotation. The horizontal blue line shows the current monthly average. The yellow dots give the number of stations that provided valid data. Valid data are used to calculate the EISN. The triangle gives the number of stations providing data. When a triangle and a yellow dot coincide, it means that all the data is used to calculate the EISN of that day.
Noticeable Solar Events
| DAY | BEGIN | MAX | END | LOC | XRAY | OP | 10CM | TYPE | Cat | NOAA |
| 03 | 0643 | 0653 | 0659 | M1.3 | 60 | 3358 | ||||
| 04 | 1220 | 1235 | 1255 | N16W82 | M1.4 | SF | CTM/1 | 53 | 3354 | |
| 05 | 1836 | 1858 | 1921 | N24E35 | M1.0 | SF | 63 | 3361 | ||
| 06 | 1032 | 1049 | 1107 | S14E0 | M1.0 | SF | 3354 | |||
| 07 | 0617 | 0629 | 0638 | S22W15 | M4.0 | 2B | 190 | III/1 | 59 | 3359 |
| LOC: approximate heliographic location | TYPE: radio burst type |
| XRAY: X-ray flare class | Cat: Catania sunspot group number |
| OP: optical flare class | NOAA: NOAA active region number |
| 10CM: peak 10 cm radio flux |
PROBA2 Observations
Solar Activity
Solar flare activity fluctuated from low to moderate during the week.
In order to view the activity of this week in more detail, we suggest to go to the following website from which all the daily (normal and difference) movies can be accessed: https://proba2.oma.be/ssa
This page also lists the recorded flaring events.
A weekly overview movie can be found here (SWAP week 693). https://proba2.oma.be/swap/data/mpg/movies/weekly_movies/weekly_movie_2023_07_03.mp4
Details about some of this week's events can be found further below.
If any of the linked movies are unavailable they can be found in the P2SC movie repository here: https://proba2.oma.be/swap/data/mpg/movies/
Tuesday Jul 04
A solar coronal dimming was observed on July 04, starting at around 02:12 UT and
ending around 04:09 UTC on the South East part of the solar disk. The coronal dimming was located close to the active region NOAA AR 3359.
Find a SWAP movie of the event here: https://proba2.oma.be/swap/data/mpg/movies/20230704_swap_movie.mp4
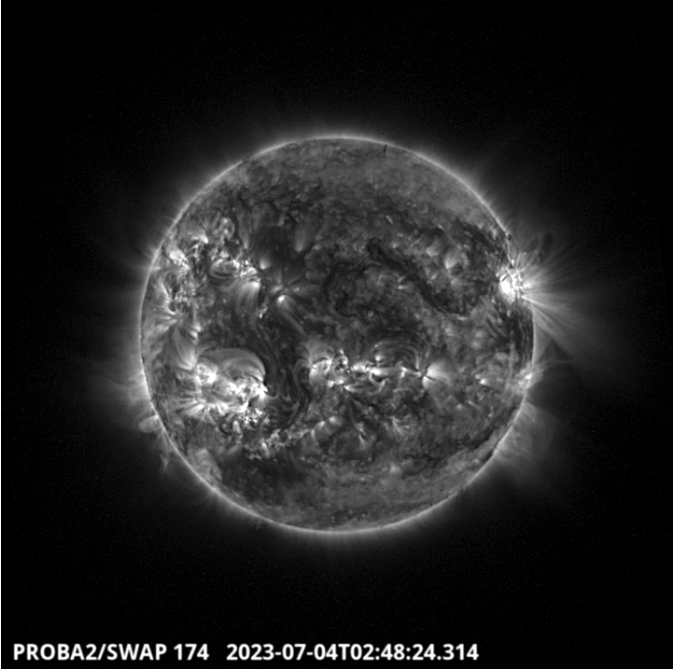
Friday Jul 07
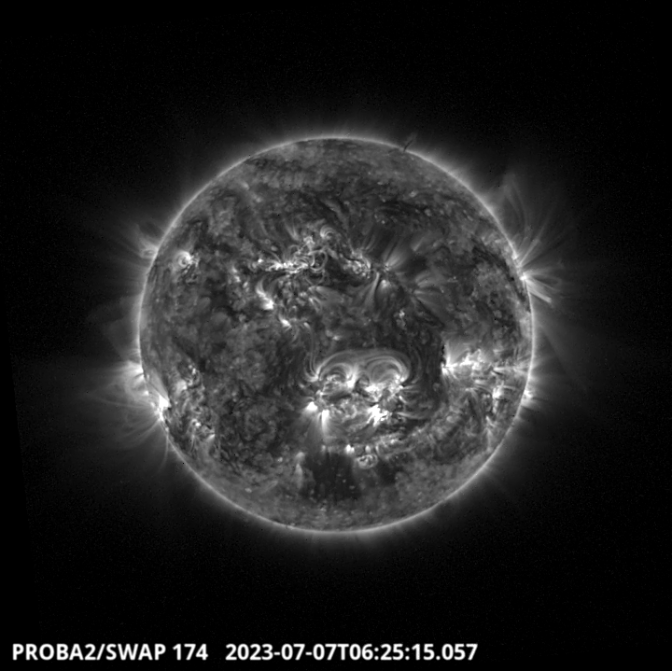
The largest flare of the week was produced by the active region NOAA 3359 at the South Western of the disk around 6:25 UT. It is visible in SWAP observations. Find a SWAP movie of the event here: https://proba2.oma.be/swap/data/mpg/movies/20230707_swap_movie.mp4
Review of Ionospheric Activity
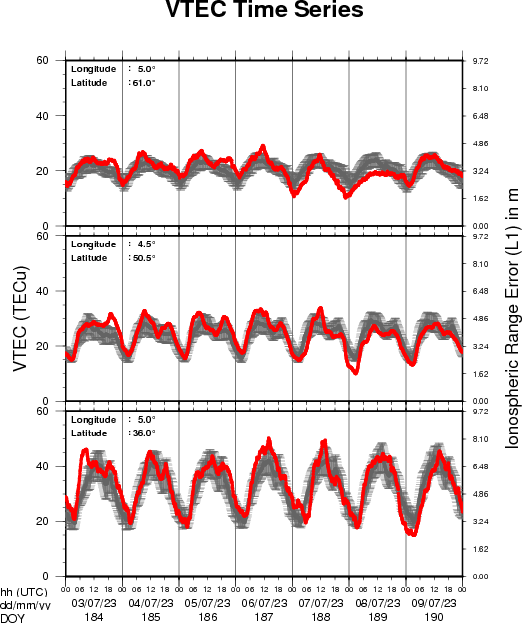
The figure shows the time evolution of the Vertical Total Electron Content (VTEC) (in red) during the last week at three locations:
a) in the northern part of Europe(N 61deg E 5deg)
b) above Brussels(N 50.5deg, E 4.5 deg)
c) in the southern part of Europe(N 36 deg, E 5deg)
This figure also shows (in grey) the normal ionospheric behaviour expected based on the median VTEC from the 15 previous days.
The VTEC is expressed in TECu (with TECu=10^16 electrons per square meter) and is directly related to the signal propagation delay due to the ionosphere (in figure: delay on GPS L1 frequency).
The Sun's radiation ionizes the Earth's upper atmosphere, the ionosphere, located from about 60km to 1000km above the Earth's surface.The ionization process in the ionosphere produces ions and free electrons. These electrons perturb the propagation of the GNSS (Global Navigation Satellite System) signals by inducing a so-called ionospheric delay.
See http://stce.be/newsletter/GNSS_final.pdf for some more explanations ; for detailed information, see http://gnss.be/ionosphere_tutorial.php
Geomagnetic Observations in Belgium
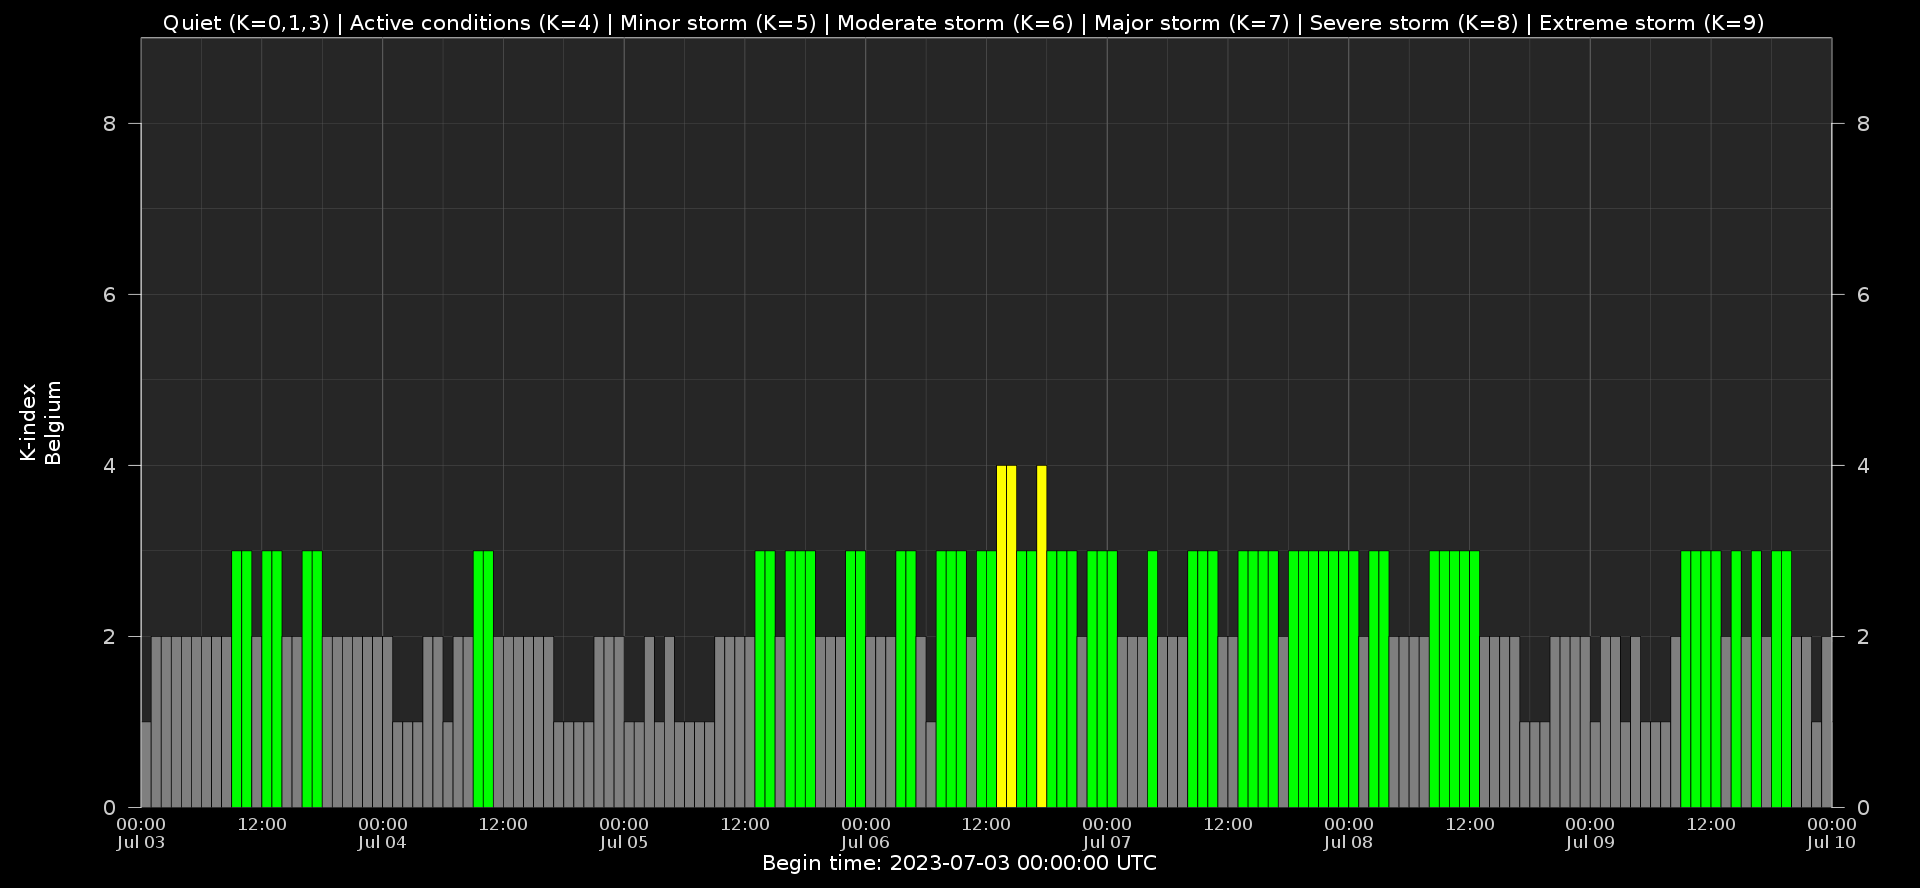
Local K-type magnetic activity index for Belgium based on data from Dourbes (DOU) and Manhay (MAB). Comparing the data from both measurement stations allows to reliably remove outliers from the magnetic data. At the same time the operational service availability is improved: whenever data from one observatory is not available, the single-station index obtained from the other can be used as a fallback system.
Both the two-station index and the single station indices are available here: http://ionosphere.meteo.be/geomagnetism/K_BEL/
The SIDC Space Weather Briefing
The Space Weather Briefing presented by the forecaster on duty from to . It reflects in images and graphs what is written in the Solar and Geomagnetic Activity report: https://www.stce.be/briefings/20230710_SWbriefing.pdf

If you need to access the movies, contact us: stce_coordination at stce.be
Activities at the STCE
Check out our activity calendar: activities and encounters with the Sun-Space-Earth system and Space Weather as the main theme. We provide occasions to get submerged in our world through educational, informative and instructive activities.
If you want your event in our calendar, contact us: stce_coordination at stce.be
* Aug 21, Lecture: The Sun, VVS Summerschool, Leuven, Belgium
* Sept 9-10, Open Doors at the Humain Radioastronomy Station, Humain, Belgium
* Sep 18-20, STCE Space Weather Introductory Course, Brussels, Belgium - Registrations are open
* Sep 26, post-Space Weather Introductory Course, by JMG, date and place TBD - registration is included in the Sep SWIC
* Nov 18-19, e-SWAN Space Weather School: data, models and services, by the STCE, Toulouse, France
* Dec 4-6, STCE course: Space Weather impacts on ionospheric wave propagation - focus on GNSS and HF, Brussels, Belgium - Registrations are open
* Jan 22-24, 2024, STCE Space Weather Introductory Course, Brussels, Belgium - Registrations are open
* Jan 25, 2024, post-Space Weather Introductory Course, by JMG and MeteoWing, place TBD - registration is included in the Jan SWIC
Check: https://www.stce.be/calendar
