- Table of Content
- 1.The towering i...
- 2.Heat waves on ...
- 3.Review of Spac...
- 4.International ...
- 5.Noticeable Sol...
- 6.PROBA2 Observa...
- 7.Review of Iono...
- 8.Geomagnetic Ob...
- 9.The SIDC Space...
- 10.Upcoming Activ...
2. Heat waves on the Sun
3. Review of Space Weather
4. International Sunspot Number by SILSO
5. Noticeable Solar Events
6. PROBA2 Observations
7. Review of Ionospheric Activity
8. Geomagnetic Observations in Belgium
9. The SIDC Space Weather Briefing
10. Upcoming Activities
The towering inferno
Late on 18 July, big sunspot group NOAA 3363 had finished its transit of the solar disk and rotated over the Sun's southwest limb. This big sunspot had been dominating our view of the Sun during the previous 2 weeks, gradually increasing its flaring activity. On 18 July it was the source of the first moderate solar radiation storm of the ongoing solar cycle (see the STCE newsflash at https://www.stce.be/news/655/welcome.html ). Though this active region was now on the farside of the Sun, it still produced some M-class flares on 19 July. Solar activity continued to be enhanced, also due to some filament eruptions.
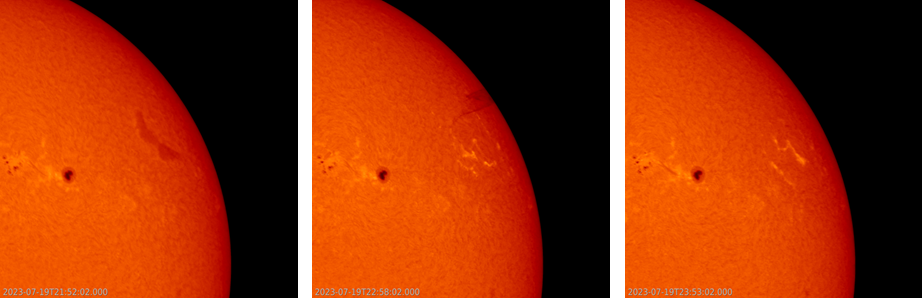
One of the more impressive filament eruptions took place late on 19 July, when a rather short fragment erupted near the northwest solar limb. Solar filaments are clouds of charged particles ("plasma") above the solar surface squeezed between magnetic regions of opposite polarity. Being cooler and denser than the plasma underneath and their surroundings, they appear as dark lines when seen on the solar disk and as bright blobs when seen near the solar limb (then they are called "prominences"). Special filters are required to observe these features, and one such a filter is the Hydrogen-alpha (H-alpha) line in the red part of the solar spectrum at 656.28 nm. H-alpha images above are from the GONG H-alpha Network (https://gong.nso.edu/ ) and show the filament about an hour before the eruption, during the eruption, and an hour afterwards when it was all gone.
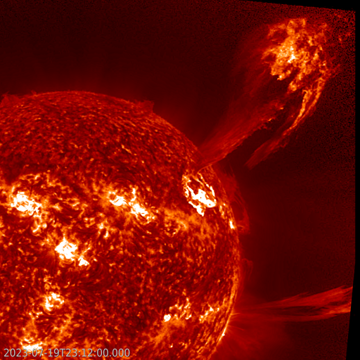
Despite being a small filament, the eruption was truly spectacular in extreme ultraviolet (EUV) imagery such as in GOES/SUVI 304 (https://www.swpc.noaa.gov/products/goes-solar-ultraviolet-imager-suvi ) showing the Sun at temperatures near 80.000 degrees (image above). Similar to the 1974 movie "The Towering Inferno" (https://www.imdb.com/title/tt0072308/ ), it looked like a skyscraper engulfed in flames, only -around 23:12UTC- to tower at least twice the Earth-Moon distance over the solar surface - that's a whopping 750.000 km! This pillar of fire was still growing and could be tracked throughout SUVI's field of view. The jet-like structure to the lower-right is unrelated, and due to activity from spotless active region NOAA 3370 near the Sun's southwest limb. Clips are in the online versio of this STCE newsitem at https://www.stce.be/news/657/welcome.html
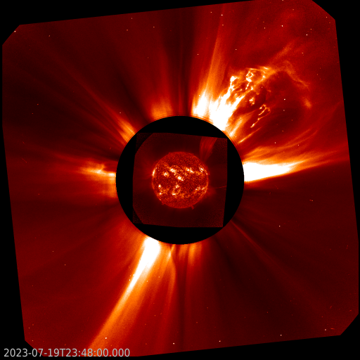
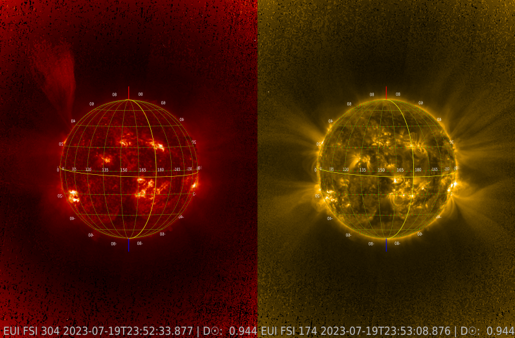
In coronagraphic images, the associated coronal mass ejecyion (CME) became first visible in SOHO/LASCO C2 images (https://soho.nascom.nasa.gov/ ) around 23:12UTC. CACTus (https://www.sidc.be/cactus/ ) gave a plane-of-the-sky speed for this CME around 975 km/s. Note that in the imagery above, the coronagraphic images are in white light, whereas SUVI 304's overlaid imagery shows the ejected material in EUV. Also Solar Orbiter (https://www.sidc.be/EUI/data-analysis ), currently residing on the Sun's farside as seen from Earth, was able to catch a glimpse of the expanding plume with its Full Sun Imager (30.4 nm; FSI 304) - as shown below. The other image is in 17.4 nm (FSI 174) near temperatures of about 1 million degrees, but shows no trace of the eruption. This most likely indicates the ejected material consisted mainly of "cold" material not showing up in the "hotter" 17.1 nm passband. Note that the thick yellow line in the grid marks the meridian which is oriented 180 degrees away from Earth.
Heat waves on the Sun
A joint scientific team led by the Royal Observatory of Belgium (ROB) and the KU Leuven has found that high-frequency magnetic waves could play an essential role in keeping the Sun's atmosphere at millions of degrees. This finding sheds a new light on the most intriguing solar mystery: what makes the Sun's atmosphere hotter than its surface?
One of the long-standing astrophysical puzzles is exactly this coronal heating problem. From a young age, we are taught that temperature decreases as you move away from a heat source, but this is not true for the Sun. The Sun's only heat source resides in its core. Yet the corona, the outermost layer of the solar atmosphere, is about 200 times hotter than the photosphere, the Sun's surface.
Prof. Tom Van Doorsselaere at KU Leuven says, "Over the past 80 years, astrophysicists have tried to solve this problem and now more and more evidence is emerging that the corona can be heated by magnetic waves." This new insight developed from observations by the Extreme Ultraviolet Imager (EUI) telescope onboard Solar Orbiter, a spacecraft of the European Space Agency ESA, that is currently observing the sun from behind. The EUI telescope, operated by ROB, produces images of the solar corona with unprecedented resolution. Its movies reveal fast oscillations in the smallest magnetic structures of the solar corona, and the energy of these high-frequency waves contributes to the heating of the solar atmosphere.
The main question the scientists were asking was whether the energy originating from these new, fast oscillations outweighed the energy coming from similar, but slower oscillations that were already known. The scientific team performed a meta-analysis, which is a statistical method of using multiple scientific studies to derive common unknown truths. Dr. Daye Lim, lead author, concluded that high-frequency waves give a more significant contribution to the total heating generated by waves than low-frequency waves.
Dr. David Berghmans, the principal investigator of EUI, says, "Since her results indicated a key role for fast oscillations in coronal heating, we will devote much of our attention to the challenge of discovering higher-frequency magnetic waves with EUI."
The Astrophysical Journal Letters just published a scientific paper in which researchers from the ROB and KU Leuven describe this new conclusion. See https://iopscience.iop.org/article/10.3847/2041-8213/ace423
This research is supported by Fonds Wetenschappelijk Onderzoek - Vlaanderen (FWO), the Federal Science Policy Office (BELSPO), and the Solar-Terrestrial Centre of Excellence (STCE) in Uccle.

Full Sun observation taken on October 12, 2022 by EUI's Full Sun Imager (FSI) and a zoom on the center of the Sun taken by its High-Resolution Imager (HRI). The white arrow corresponds to a distance of about 10 000 km. Three smaller structures highlighted with red, blue, and green boxes, show magnetic waves that appear as a transverse motion. Find a movie of the observations here: https://stce.be/movies/HeatWavesOnTheSun.mp4
EUI website: http://sidc.be/EUI
Follow the EUI Twitter account: https://twitter.com/EuiTelescope
Review of Space Weather
Solar Active Regions (ARs) and flares
The solar flaring activity over the past week was mostly at moderate levels with almost daily isolated M-class flaring. There were 9 numbered active regions on the visible solar disc and 7 M-class flares were recorded.
The most active region throughout the week was NOAA AR 3363, which produced the largest flare which was a M 5.7-flare, with peak time 00:06 UTC on July 18. This event was also associated with a partial halo CME and large proton event.
Other notable active regions were NOAA AR 3372, NOAA AR 3373 and NOAA AR 3376 which all produced M-class flares but were all decaying by the end of the week.
Coronal mass ejections
Multiple Corona Mass Ejections (CMEs) were observed throughout the week. The most notable was a halo CME observed in LASCO/C2 coronagraph data from 23:50 UTC on July 17 associated with M5.7 flare. The CME’s speed was estimated to be over 1000 km/s and was expected to impact the Earth with a glancing blow on July 19 but probably impacted the Earth on the UTC afternoon on July 20th.
A partial halo CME was observed in LASCO/C2 coronagraph data from 20:12 UTC on July 18 to the north east simultaneously with a back sided CME. This CME was associated with an M2.1-flare produced by NOAA AR 3376 and probably impacted the Earth on in the UTC afternoon on July 21.
Coronal Holes
Two negative polarity coronal holes crossed the central meridian during the week: one high latitude coronal hole and a small, weak, mid latitude coronal hole.
By the end of the week, two small positive polarity mid latitude coronal holes, one in the north and one in the south, were approaching the central meridian.
Proton flux levels
The week started with elevated proton levels following a proton event on July 16, which gradually decreased to background levels by July 22.
The greater than 10 MeV proton flux rose again and reached moderate solar radiation storm levels on July 18 with values around 600 pfu, which was the strongest proton event of the solar cycle so far.
The proton flux then gradually decreased back to background levels on July 22.
Electron fluxes at GEO
The greater then 2 MeV electron flux became enhanced between July 18 and July 20 occasionally crossing 1000 pfu threshold.
The corresponding electron fluence rose to nominal to moderate levels during this period.
Solar wind
The solar wind conditions throughout the week exhibited signatures of three ICME arrivals.
A fast forward shock was observed in the solar wind parameters at 18:35 UTC on July 16. The solar wind jumped from 376 km/s to 434 km/s, increasing up to 500 km/s; and the interplanetary magnetic field jumped from 7 nT to 13 nT, increasing up to 15 nT with a minimum negative Bz of -12 nT. The event was possibly associated with the CME observed on July 15.
Another fast forward shock was observed in the solar wind parameters at 16:05 UTC on July 20. The solar wind jumped from 366 km/s to 450 km/s and the interplanetary magnetic field jumped from 5 nT to 12 nT with a minimum negative Bz of -10 nT. The event was possibly associated with the CME observed on July 17.
A jump was observed in the solar wind parameters at 19:20 UTC on July 21. The solar wind jumped from 378 km/s to 405 km/s increasing up to 440 km/s and the interplanetary magnetic field jumped from 6 nT to 9 nT, increasing up to 15 nT with a minimum negative Bz of -15 nT. The event was possibly associated with the CME observed on July 18 and a possible high speed stream influence.
Outside of the periods of ICME arrivals, the solar wind velocity remained mostly in the slow solar wind regime with values between 400 km/s and 500 km/s. The orientation of the magnetic field stayed predominantly in the negative sector.
Geomagnetism
The geomagnetic conditions throughout the week were predominantly quiet to unsettled. Minor storm levels were measured globally following two ICME arrivals on July 17 and July 18 and active periods were globally measured on July 19, July 21 and July 22 following ICME arrivals.
International Sunspot Number by SILSO
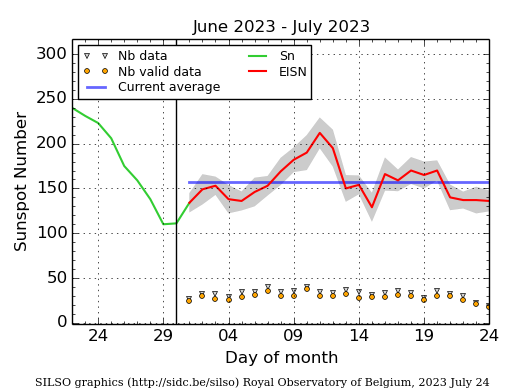
The daily Estimated International Sunspot Number (EISN, red curve with shaded error) derived by a simplified method from real-time data from the worldwide SILSO network. It extends the official Sunspot Number from the full processing of the preceding month (green line), a few days more than one solar rotation. The horizontal blue line shows the current monthly average. The yellow dots give the number of stations that provided valid data. Valid data are used to calculate the EISN. The triangle gives the number of stations providing data. When a triangle and a yellow dot coincide, it means that all the data is used to calculate the EISN of that day.
Noticeable Solar Events
| DAY | BEGIN | MAX | END | LOC | XRAY | OP | 10CM | TYPE | Cat | NOAA |
| 17 | 2241 | 2254 | 2306 | M2.7 | 69 | 3363 | ||||
| 17 | 2317 | 2334 | 2337 | M5.0 | 1500 | VI/2 | ||||
| 17 | 2337 | 0006 | 0023 | M5.7 | VI/2 | 69 | 3363 | |||
| 18 | 0645 | 0656 | 0702 | N24E42 | M1.5 | SF | ||||
| 18 | 1932 | 1948 | 2000 | M1.3 | ||||||
| 18 | 2000 | 2005 | 2011 | M1.4 | ||||||
| 18 | 2016 | 2027 | 2035 | N20W12 | M2.1 | SF | ||||
| 19 | 1049 | 1057 | 1102 | S20W88 | M1.4 | SF | 3363 | |||
| 19 | 1049 | 1057 | 1102 | S20W88 | M1.3 | SF | 3363 | |||
| 19 | 1704 | 1725 | 1743 | M3.8 | II/1 | 3363 | ||||
| 19 | 1704 | 1725 | 1743 | M3.7 | ||||||
| 22 | 0312 | 0337 | 0355 | N21W55 | M3.1 | 2N | 78 | 3372 | ||
| 22 | 0412 | 0416 | 0424 | N8W25 | M1.0 | 1F | 81 | 3373 |
| LOC: approximate heliographic location | TYPE: radio burst type |
| XRAY: X-ray flare class | Cat: Catania sunspot group number |
| OP: optical flare class | NOAA: NOAA active region number |
| 10CM: peak 10 cm radio flux |
PROBA2 Observations
Solar activity
Solar flare activity fluctuated from low to moderate during the week.
In order to view the activity of this week in more detail, we suggest to go to the following website from which all the daily (normal and difference) movies can be accessed here: https://proba2.oma.be/ssa
This page also lists the recorded flaring events.
A weekly overview movie can be found here (SWAP week 695): https://proba2.sidc.be/swap/data/mpg/movies/weekly_movies/weekly_movie_2023_07_17.mp4
Details about some of this week's events can be found further below.
If any of the linked movies are unavailable they can be found in the P2SC movie repository here: https://proba2.sidc.be/swap/data/mpg/movies/
Tuesday Jul 18
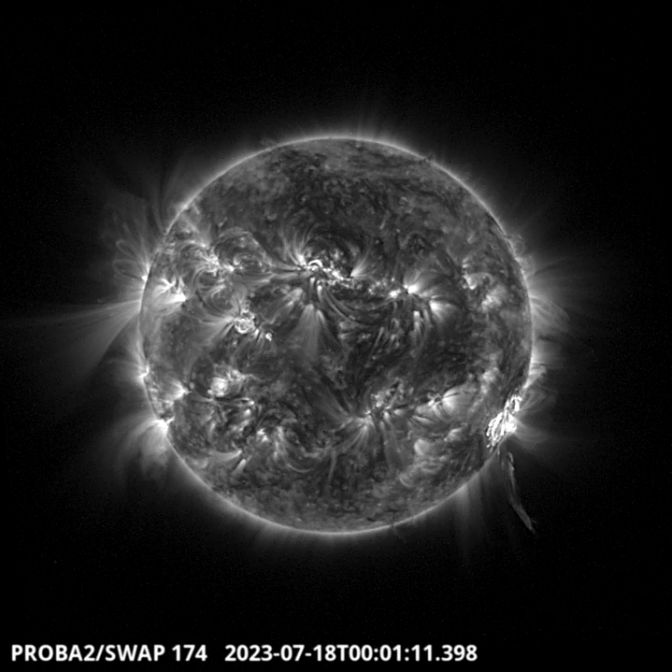
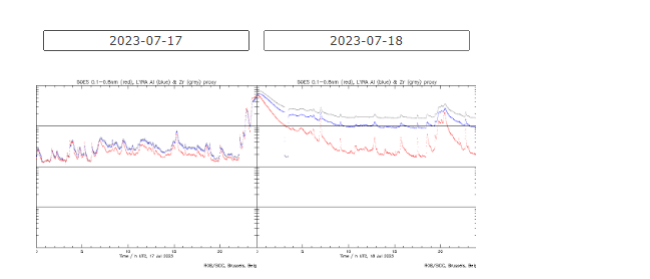
The largest flare of the week, a M5.7 flare, was produced by the active region NOAA 3363, which
has been very eruptive for several days. It is visible on the LYRA timeseries and on the SWAP
image around 00:01 UT on the South West part of the solar disk. The flare was followed by a
CME. Find a SWAP movie of the event here: https://proba2.sidc.be/swap/data/mpg/movies/20230718_swap_movie.mp4
Review of Ionospheric Activity
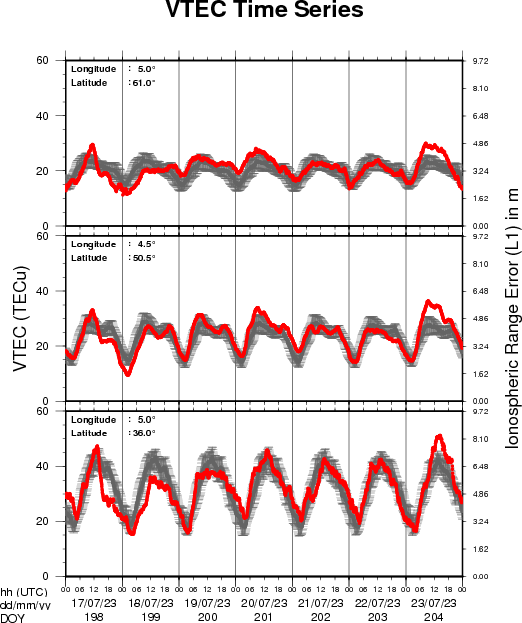
The figure shows the time evolution of the Vertical Total Electron Content (VTEC) (in red) during the last week at three locations:
a) in the northern part of Europe(N 61deg E 5deg)
b) above Brussels(N 50.5deg, E 4.5 deg)
c) in the southern part of Europe(N 36 deg, E 5deg)
This figure also shows (in grey) the normal ionospheric behaviour expected based on the median VTEC from the 15 previous days.
The VTEC is expressed in TECu (with TECu=10^16 electrons per square meter) and is directly related to the signal propagation delay due to the ionosphere (in figure: delay on GPS L1 frequency).
The Sun's radiation ionizes the Earth's upper atmosphere, the ionosphere, located from about 60km to 1000km above the Earth's surface.The ionization process in the ionosphere produces ions and free electrons. These electrons perturb the propagation of the GNSS (Global Navigation Satellite System) signals by inducing a so-called ionospheric delay.
See http://stce.be/newsletter/GNSS_final.pdf for some more explanations ; for detailed information, see http://gnss.be/ionosphere_tutorial.php
Geomagnetic Observations in Belgium
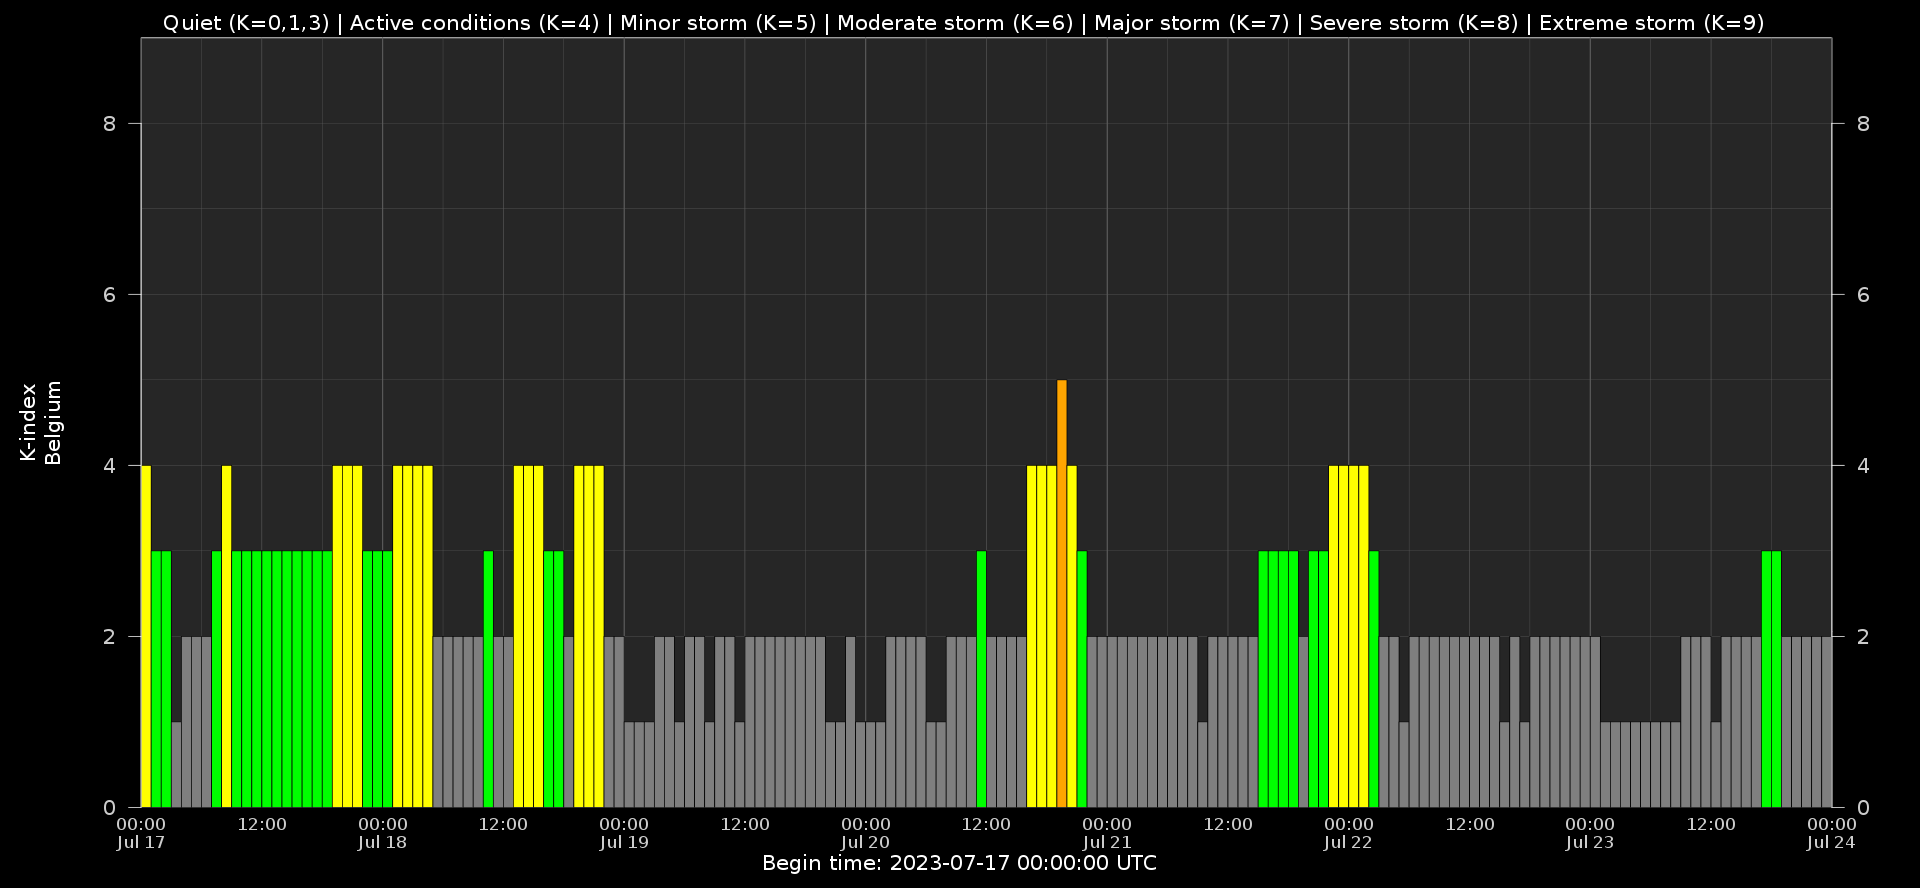
Local K-type magnetic activity index for Belgium based on data from Dourbes (DOU) and Manhay (MAB). Comparing the data from both measurement stations allows to reliably remove outliers from the magnetic data. At the same time the operational service availability is improved: whenever data from one observatory is not available, the single-station index obtained from the other can be used as a fallback system.
Both the two-station index and the single station indices are available here: http://ionosphere.meteo.be/geomagnetism/K_BEL/
The SIDC Space Weather Briefing
The Space Weather Briefing presented by the forecaster on duty from 16 to 24 July. It reflects in images and graphs what is written in the Solar and Geomagnetic Activity report: https://www.stce.be/briefings/20230724_SWbriefing.pdf

If you need to access the movies, contact us: stce_coordination at stce.be
Upcoming Activities
Check out our activity calendar: activities and encounters with the Sun-Space-Earth system and Space Weather as the main theme. We provide occasions to get submerged in our world through educational, informative and instructive activities.
If you want your event in our calendar, contact us: stce_coordination at stce.be
* Aug 21, Lecture: The Sun, VVS Summerschool, Leuven, Belgium
* Sept 9-10, Open Doors at the Humain Radioastronomy Station, Humain, Belgium
* Sep 18-20, STCE Space Weather Introductory Course, Brussels, Belgium - Registrations are open
* Sep 26, post-Space Weather Introductory Course, by JMG, date and place TBD - registration is included in the Sep SWIC
* Nov 18-19, e-SWAN Space Weather School: data, models and services, by the STCE, Toulouse, France
* Dec 4-6, STCE course: Space Weather impacts on ionospheric wave propagation - focus on GNSS and HF, Brussels, Belgium - Registrations are open
* Jan 22-24, 2024, STCE Space Weather Introductory Course, Brussels, Belgium - Registrations are open
* Jan 25, 2024, post-Space Weather Introductory Course, by JMG and MeteoWing, place TBD - registration is included in the Jan SWIC
Check: https://www.stce.be/calendar