- Table of Content
- 1.The great NOAA...
- 2.The Fifth PITH...
- 3.Topical Issue ...
- 4.The new SOLARN...
- 5.Review of Spac...
- 6.International ...
- 7.PROBA2 Observa...
- 8.Noticeable Sol...
- 9.Review of Iono...
- 10.Geomagnetic Ob...
- 11.The SIDC Space...
- 12.Review of Spac...
- 13.International ...
- 14.Noticeable Sol...
- 15.Review of Iono...
- 16.Geomagnetic Ob...
- 17.The SIDC Space...
- 18.STCE Activitie...
2. The Fifth PITHIA-NRF TNA Call is open!
3. Topical Issue on Travelling Ionospheric Disturbances (TIDs)
4. The new SOLARNET Virtual Observatory
5. Review of Space Weather
6. International Sunspot Number by SILSO
7. PROBA2 Observations
8. Noticeable Solar Events
9. Review of Ionospheric Activity
10. Geomagnetic Observations in Belgium
11. The SIDC Space Weather Briefing
12. Review of Space Weather
13. International Sunspot Number by SILSO
14. Noticeable Solar Events
15. Review of Ionospheric Activity
16. Geomagnetic Observations in Belgium
17. The SIDC Space Weather Briefing
18. STCE Activities
The great NOAA 3413 show
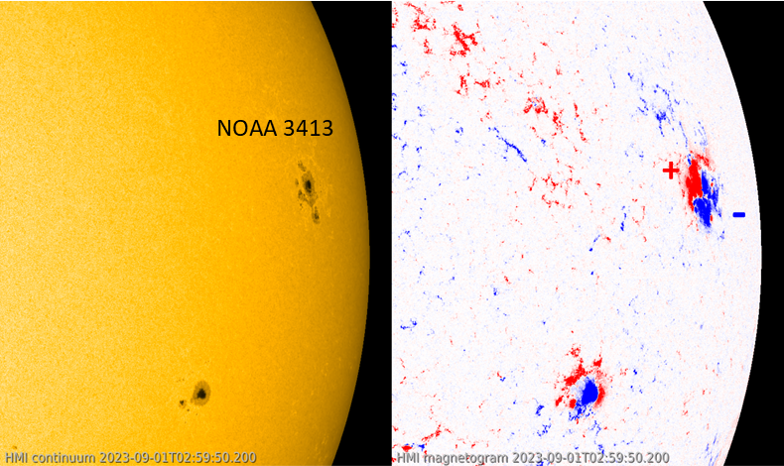
NOAA 3413 was a unipolar sunspot group, i.e. consisting of mainly positive magnetic polarity, for most of its transit over the solar disk. However, late on 28 August, the situation became more interesting with the gradual emergence of opposite magnetic polarity flux south and southwest of the main sunspot. This can be seen in the SDO-imagery (http://sdo.gsfc.nasa.gov/data/aiahmi/) with on the left a white light image showing NOAA 3413 and on the right red and blue patches indicating areas of resp. positive and negative magnetic polarity, i.e. areas where the magnetic fields are leaving resp. returning to the solar surface. A clip showing the evolution of this sunspot group on 31 August and 1 September is available in the online version of this article at https://www.stce.be/news/663/welcome.html
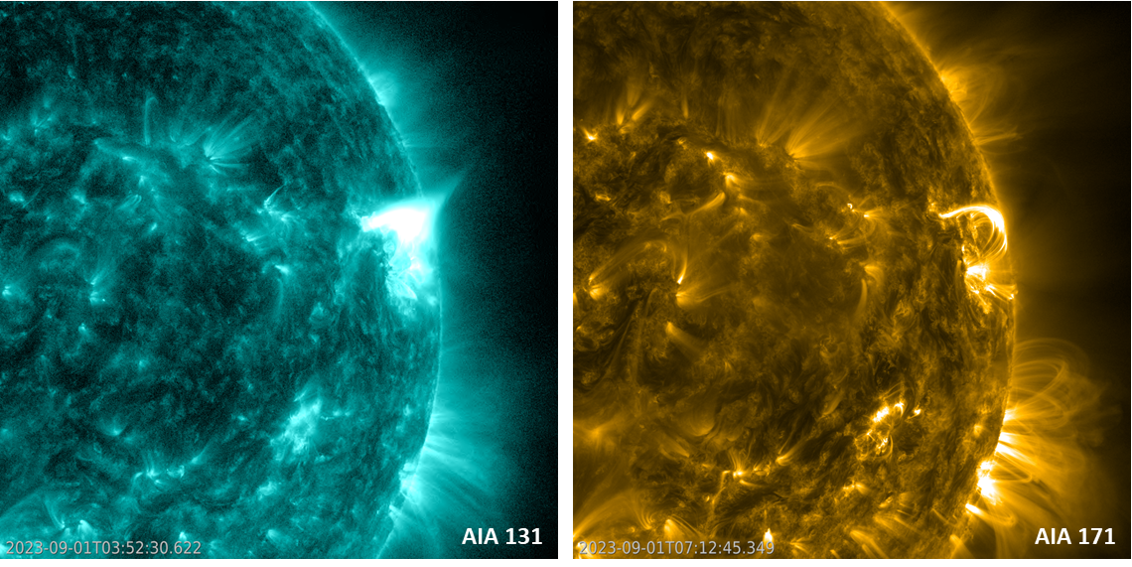
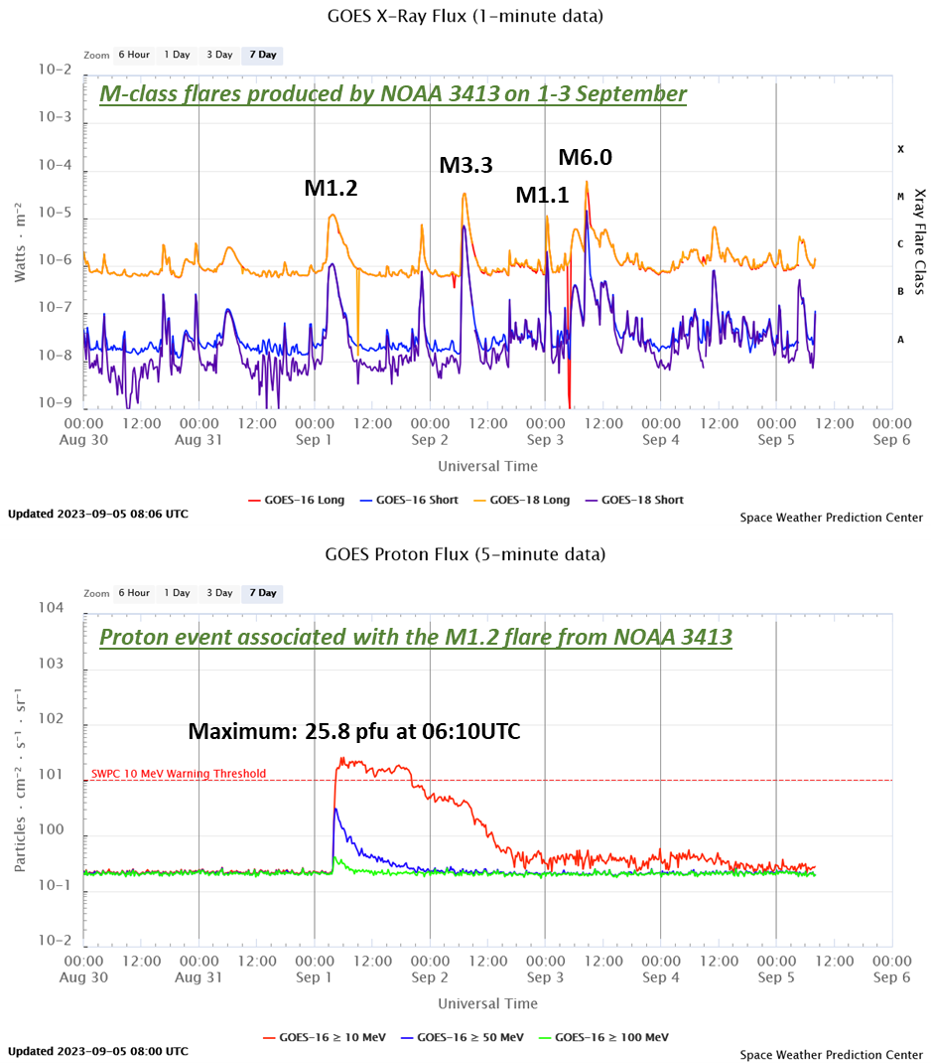
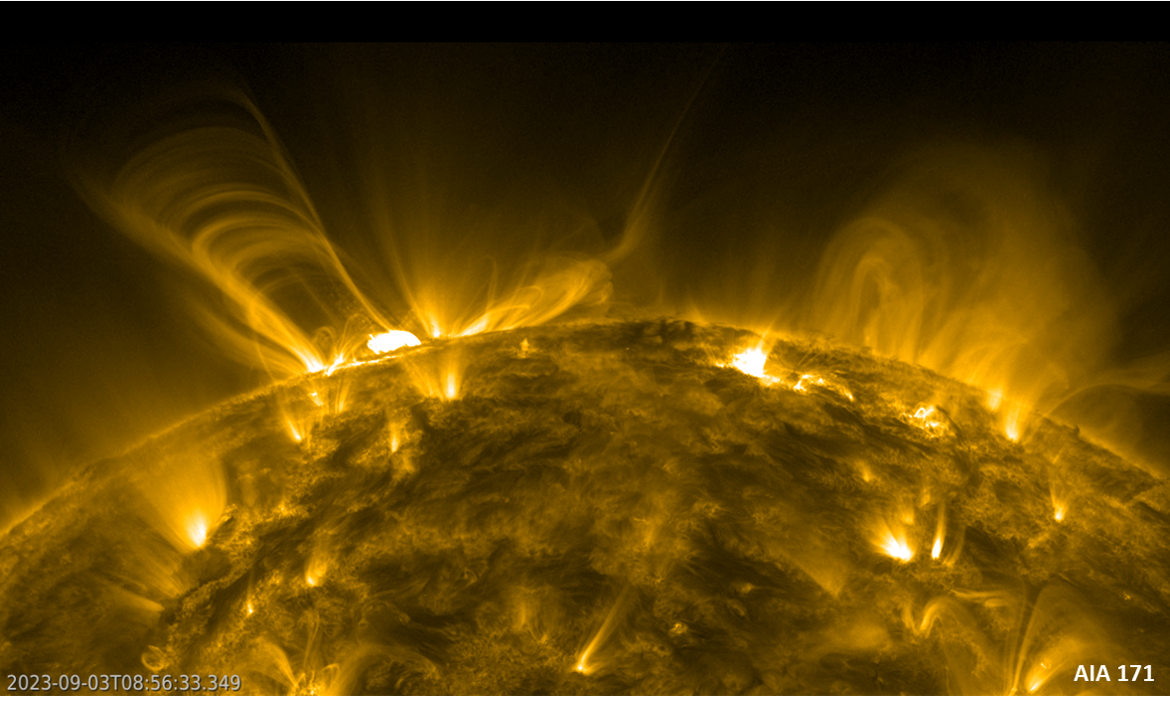
The close proximity of these opposite polarity fluxes kicked off a series of M-class flares, starting with a long-duration M1 flare peaking early on 1 September at 03:51UTC (GOES - https://www.swpc.noaa.gov/products/goes-x-ray-flux ). Extreme ultraviolet (EUV) imagery such as AIA 094 and 131, i.e. at high temperatures of several million degrees, showed an impressive candle-flame-like structure over the source region. This is called a "cusp", and is indicative of the magnetic reconnection that has taken place and also implies that material has been ejected into space. The images underneath show the cusp (AIA 131) around the time of maximum x-ray flux (left), and the post-flare coronal loops a few hours later (AIA 171, temperature around 700.000 degrees ; right). A coronal mass ejection (CME) was indeed observed but thought to have only a small chance to deliver a glancing blow to the earth environment. Nonetheless, solar wind data (DSCOVR - https://www.swpc.noaa.gov/products/real-time-solar-wind - annotated graph online) reflect a weak shock around 14:40UTC on 5 September, suggesting the late arrival of the 1 September CME.
The M1 flare was also associated with a small proton event (annotated graph underneath, combined with the soft x-ray curve) that reached a maximum flux of 25 pfu at 06:10 UTC, and ended the same day. Any space weather effects from this minor solar radiation storm (S1 - see the NOAA scales at https://www.swpc.noaa.gov/noaa-scales-explanation ) were limited to minor degradation of High Frequency communications in the polar regions. The more energetic proton fluxes (green curve) got barely enhanced and remained mostly at background levels. There have been already over 10 minor and 2 moderate proton events this year.
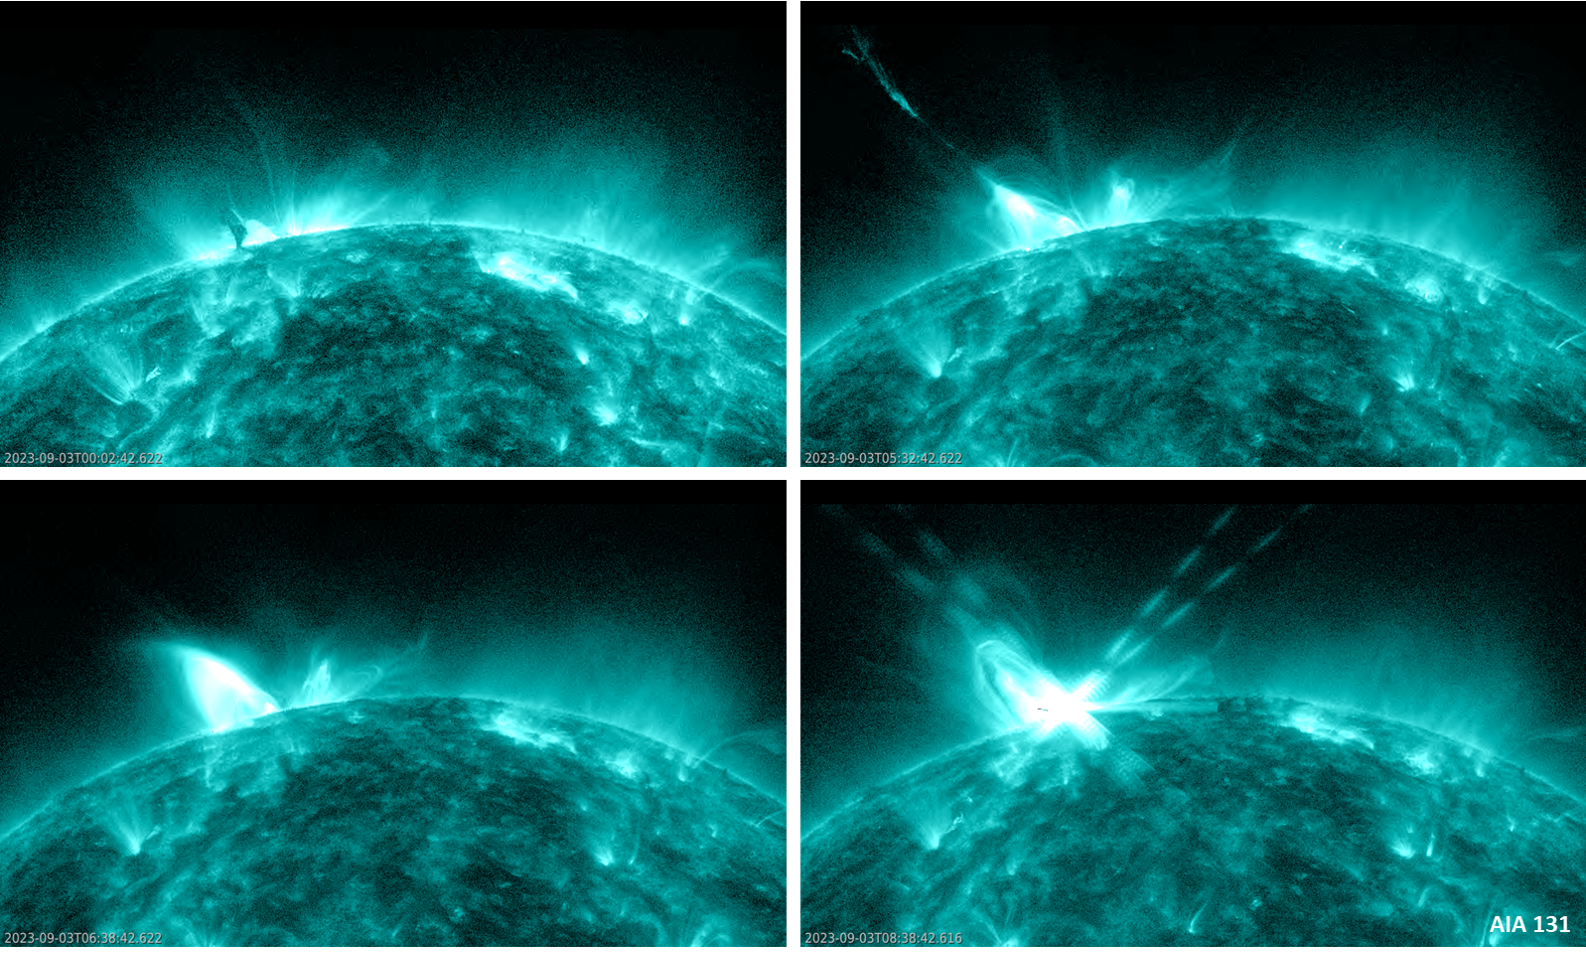
The imagery underneath shows the eruptive activity from NOAA 3413 on 3 September, including the M6 flare that peaked at 08:36UTC. Note the solar image is rotated over 90 degrees, with west now on top and north to the left. The clip in the online version covers 16 hours, at a cadence of 1 image every 3 minutes and played at 20 images per second (so 320 images in 16 seconds). The compilation underneath shows AIA 131 imagery of the eruptive activity that is going on during that period. Note that the AIA 131 filter has two components showing the Sun at temperatures near 10 million degrees and - at the same time - around 400.000 degrees. This allows to see simultaneously very hot features such as flares and cusps, but also much "colder" features such as well-sized filaments and coronal loops. The compilation underneath shows the activity near NOAA 3413 when this active region was already at the west limb, with a nearby filament ("prominence") in front (upper left), the eruption of this filament (upper right), the associated cusp (lower left), and finally the M6 flare itself (lower right). The online clip shows the true dynamics of all these features. There's also a clip showing AIA 171 images providing a much better view on the coronal loops and the magnetic restructuring. There are some astonishing features and reconnection processes going on there!
The Fifth PITHIA-NRF TNA Call is open!
PITHIA-NRF (Plasmasphere Ionosphere Thermosphere Integrated Research Environment and Access services: a Network of Research Facilities) launches its fifth call to provide effective and convenient access to the best European research facilities for observations of the upper atmosphere, including the plasmasphere, ionosphere and thermosphere. The access is organised through the Trans-National Access (TNA) programme, and provides an opportunity for researcher and other users to execute and carry out their own projects at one of the twelve PITHIA-NRF research facilities.
It is an Open Call and applications are handled as they arrive with evaluation times of 2 to 3 weeks. If accepted the projects can commence for organisation and realisation from October 2023. The call closes on 30 November 2023.
More details here: https://pithia-nrf.eu/pithia-nrf-users/tna/tna-calls/fifth-tna-call
You can get information on the PITHIA-NRF Nodes here: https://pithia-nrf.eu/pithia-nrf-users/tna/nodes
View details on PITHIA-NRF assets by accessing the PITHIA-NRF Knowledge Book here: http://194.177.195.242/pithia_entities/ui/

Topical Issue on Travelling Ionospheric Disturbances (TIDs)
The Journal of Space Weather and Space Climate (JSWSC - https://www.swsc-journal.org/) opens a Topical Issue "Observing, modelling and forecasting TIDs and mitigating their impact on technology" (https://www.swsc-journal.org/topical-issues-open-for-submission ), deadline June 1st, 2024.
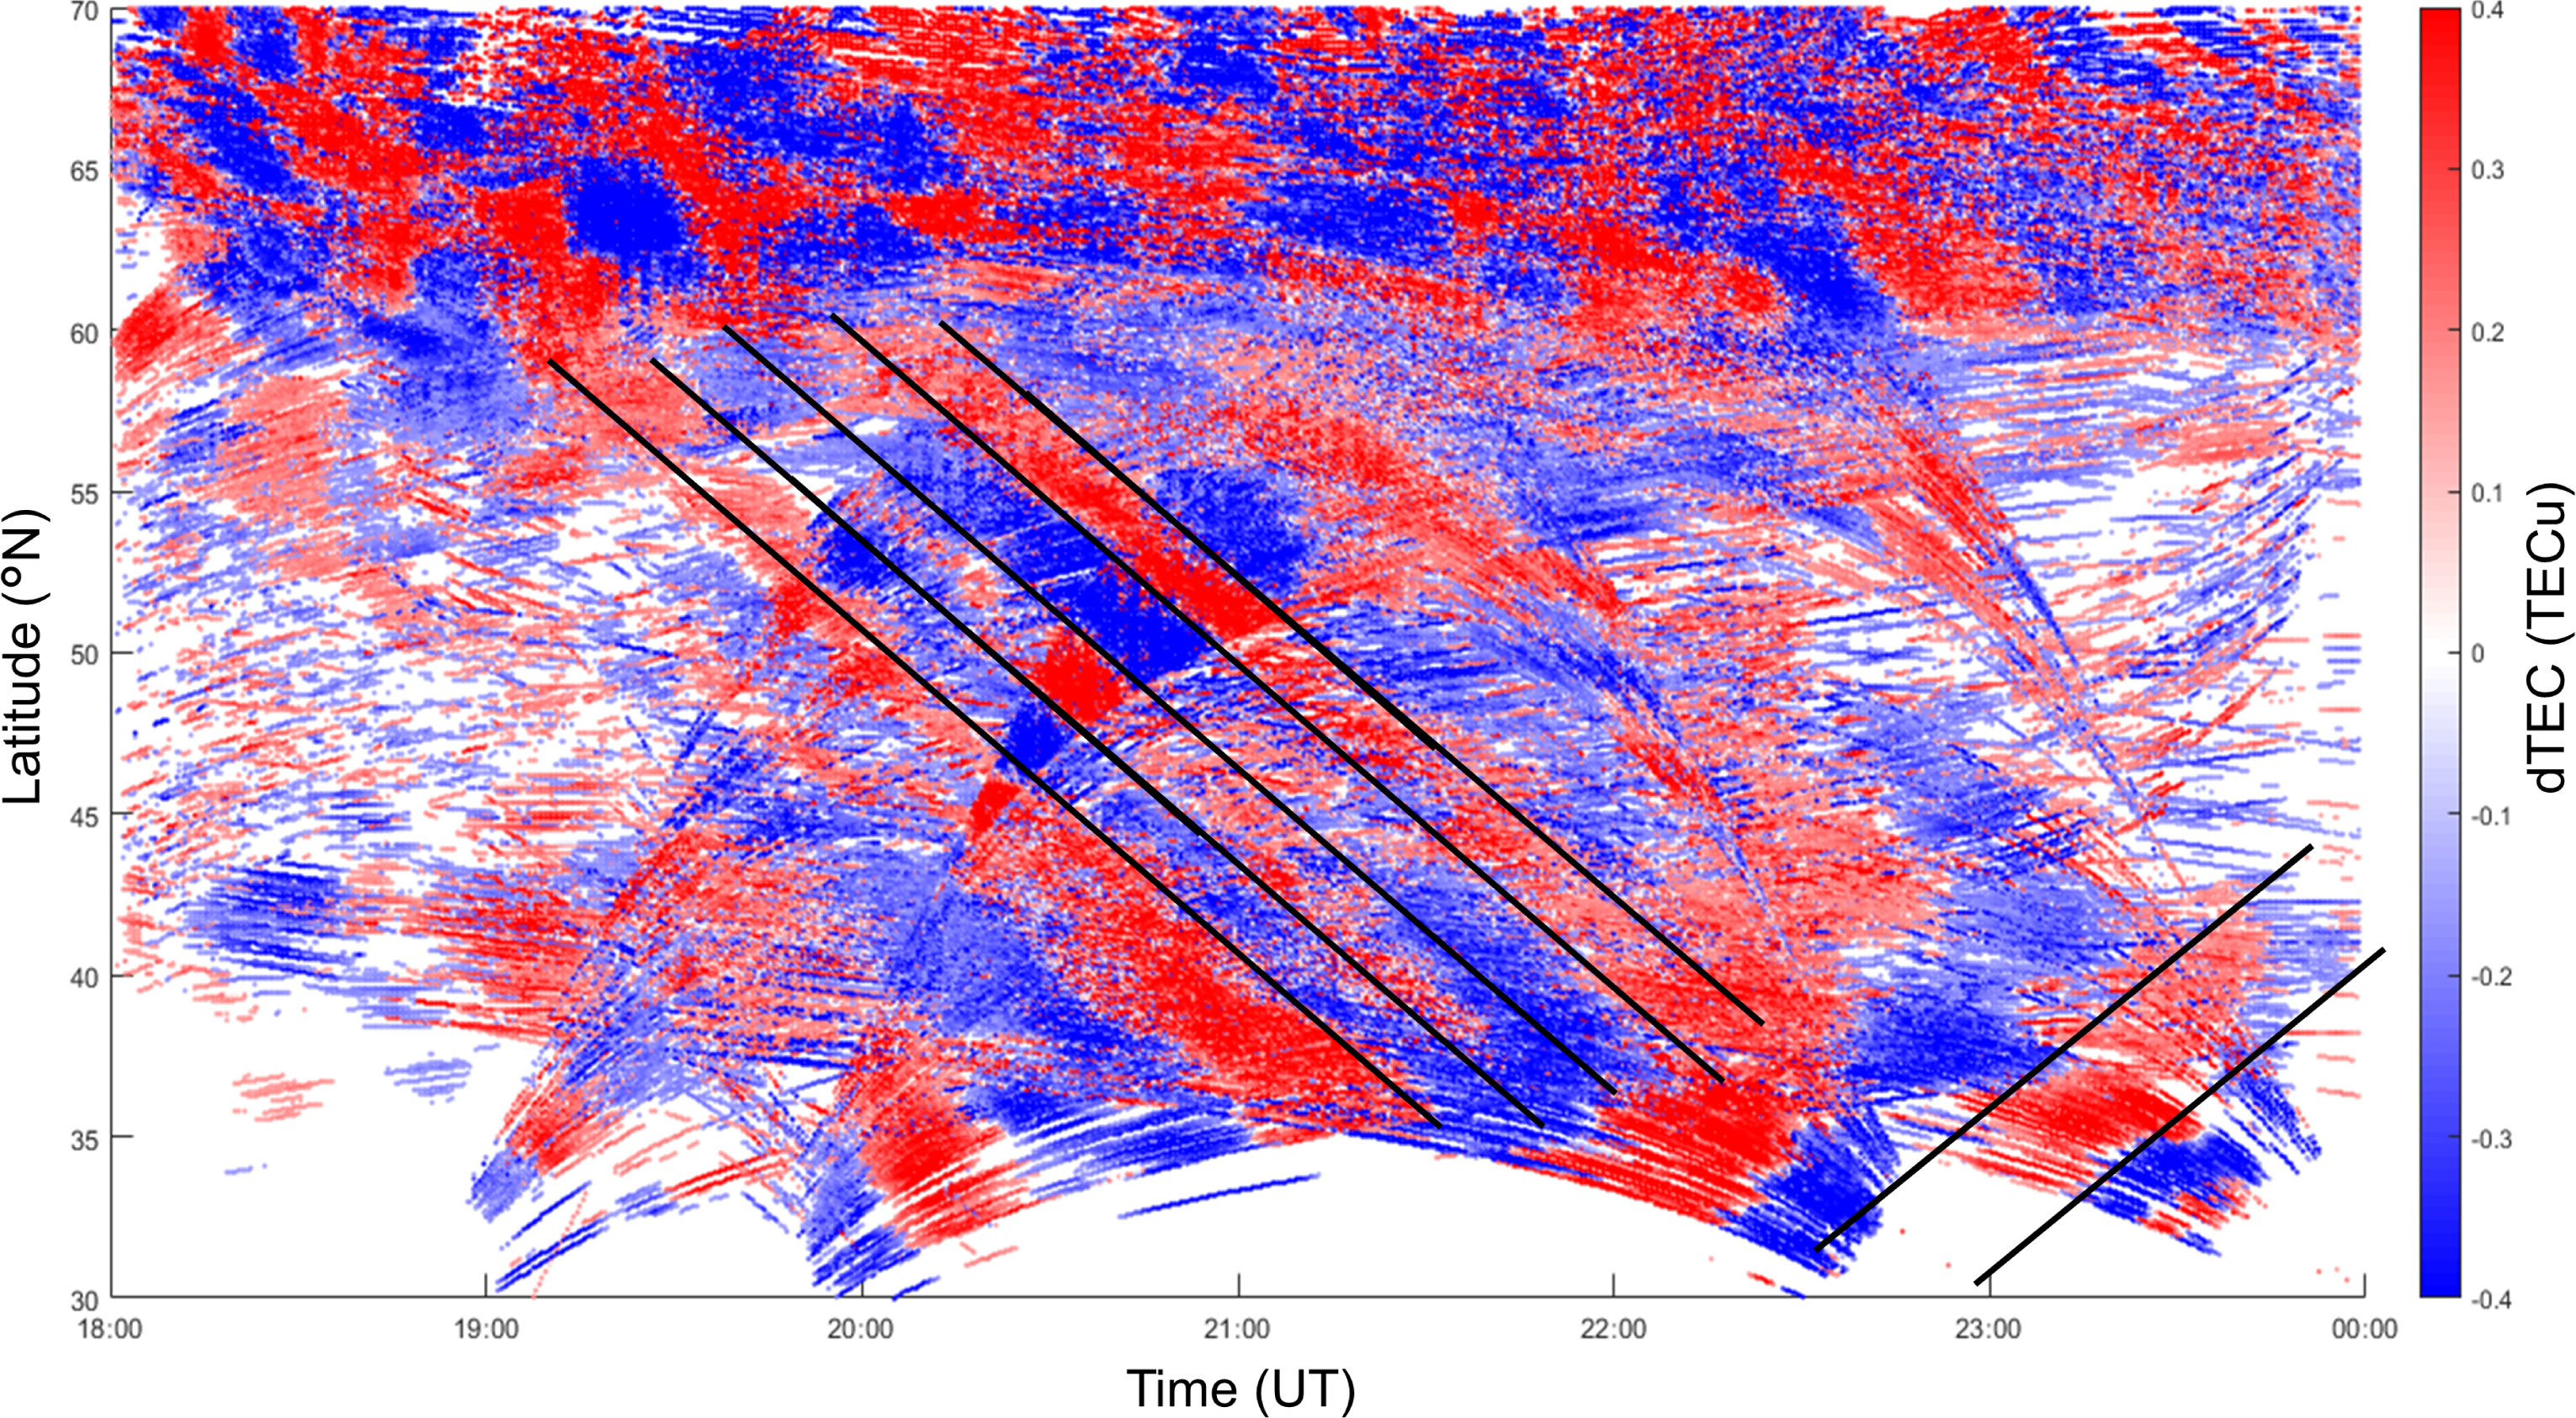
Travelling Ionospheric Disturbances (TIDs) are plasma density fluctuations that propagate as waves through the ionosphere at a wide range of velocities and frequencies. They are the ionospheric manifestation of internal atmospheric gravity waves (AGW) in the neutral atmosphere which play an important role in the exchange of momentum and energy between various regions of the upper atmosphere. TIDs are associated with auroral and geomagnetic activity and with lower-atmosphere phenomena of non-space origin (e.g., severe tropospheric convection or passages of cold fronts, seismicity, volcanic activity, and artificially triggered events such as explosions). The exact physical mechanisms of TID formation, the trigger mechanisms, the basic properties and parameters of TIDs and their propagation direction, the dissipation of their energy over travel distance and the influence of background ionospheric conditions on their propagation are not fully understood. Also, the characterisation, modelling and prediction of TIDs still need substantial improvement.
We invite submissions of manuscripts which address TID identification and tracking, TID nowcasting and forecasting, as well as feeding the obtained results into ionospheric weather services. Manuscripts on methods and technologies capable of mitigating adverse effects of TIDs on the performance of critical space and ground-based infrastructure are also welcome.
Manuscripts must be submitted via the JSWSC online submission tool. Guidelines for submission of papers are found on the JSWSC website under the tab "Instructions for Authors" (https://www.swsc-journal.org/author-information/instructions-for-authors ).
*** Deadline: June 1st, 2024 ***
All manuscripts will be peer-reviewed according to the quality standards of international scientific journals. The type of contributions must fit the style of JSWSC. All manuscripts should contain enough new insight, present the results against a properly referenced background of existing work, and present adequate evidence that supports the conclusions. Accepted papers are published in electronic format only, and are freely available to everyone via the JSWSC website. JSWSC offers the possibility to include electronic material, such as animations, movies, codes and data.
Topical Editor-in-Chief (T-EiC):
- Anna Belehaki (belehaki@noa.gr), National Observatory of Athens, Greece
- Iurii Cherniak (iurii@ucar.edu), University Corporation for Atmospheric Research, USA
Topical Editors (TE):
- Claudia Borries, Deutsche Zentrum für Luft- und Raumfahrt, Germany
- Dalia Buresova, Institute of Atmospheric Physics CAS, Czech Republic
- Claudio Cesaroni, Istituto Nazionale di Geofisica e Vulcanologia, Italy
- John Bosco Habarulema, South African National Space Agency, South Africa
For questions regarding this Topical Issue, please, contact the T-EiC. For questions concerning the submission process, please contact the Editorial Office (jswsc@edpsciences.org).
Verhulst et al., 2022 - https://doi.org/10.1051/swsc/2022032
The new SOLARNET Virtual Observatory
We’re pleased to announce that the SOLARNET Virtual Observatory (SVO), developed as part of the H2020 SOLARNET project, is now operational with a varied selection of solar physics datasets partially or completely available. The aim of the SVO is to make solar data more findable and accessible to the solar physics community.
At the heart of the SVO lies a database populated with meta-data from datasets taken by space- and ground-based instruments. It is designed to be easily interoperable with external tools and is accessible through a web interface as well as python and IDL clients.
The SVO lets you:
* Search across datasets by date of observation, wavelength, tags and telescope, letting you discover and access solar datasets from synoptic observations as well as solar data taken during short observation campaigns;
* Search a single dataset using criteria characteristic for that specific dataset;
* Searching for data by solar events date from the Heliophysics Event Database (HEK)
* See quick-look images with thumbnail and FITS header
* And download your data selection by FTP and ZIP
Please have a look at our website and share and bookmark it if you like what you see: https://www.sidc.be/SVO
.png)
Review of Space Weather
WEEK 1182 from 2023 Aug 21
Solar Active Regions (ARs) and flares
There were 14 active regions visible throughout the week (NOAA ARs 3403 to 3416). They all had relatively simple alpha or beta magnetic field configuration, except for NOAA AR 3415 which evolved into a beta delta magnetic field configuration. These regions produced numerous C-class flares and 3 M-class flares: on 22 August originating from NOAA AR 3405, on 25 August from NOAA AR 3415 and on 26 August from a region behind the east limb.
Coronal mass ejections
Many narrow CMEs were observed, and one westward partial halo CME (backsided) on 26 August. There were two CMEs with possible Earth directed components at 20:00 UTC on 22 August (low chances of a possible arrival at Earth on 26 August) mostly directed to the south, and a second one at 13:25 UTC on 26 August (low chances of a possible arrival at Earth on 30 August), also directed to the south.
Coronal Holes
No significant coronal holes were visible during the week.
Proton flux levels
The greater than 10 MeV GOES proton flux remained below threshold levels throughout the week.
Electron fluxes at GEO
The greater than 2 MeV electron flux remained below the 1000 pfu threshold throughout the week.
Solar wind
The solar wind arriving to the Earth was slow, with the exception of the beginning of the week where we were still under the influence of a high speed stream from the previous week, and during a sector boundary crossing on 24 August where the solar wind speed briefly climed above 500 km/s. The interplanetary magnetic field was always below 10 nT.
Geomagnetism
Geomagnetic conditions were mostly quiet to unsettled throughout the week, except for short periods of active geomagnetic conditions on 25 and 27 August (probably related to the 22 August CME).
International Sunspot Number by SILSO

The daily Estimated International Sunspot Number (EISN, red curve with shaded error) derived by a simplified method from real-time data from the worldwide SILSO network. It extends the official Sunspot Number from the full processing of the preceding month (green line), a few days more than one solar rotation. The horizontal blue line shows the current monthly average. The yellow dots give the number of stations that provided valid data. Valid data are used to calculate the EISN. The triangle gives the number of stations providing data. When a triangle and a yellow dot coincide, it means that all the data is used to calculate the EISN of that day.
PROBA2 Observations
Solar Activity
Solar flaring activity fluctuated from very low to moderate during the week.
In order to view the activity of this week in more detail, we suggest to go to the following website from which all the daily (normal and difference) movies can be accessed: https://proba2.oma.be/ssa
This page also lists the recorded flaring events.
A weekly overview movie (SWAP week 700) can be found here: https://proba2.sidc.be/swap/data/mpg/movies/weekly_movies/weekly_movie_2023_08_21.mp4.
Details about some of this week's events can be found further below.
If any of the linked movies are unavailable they can be found in the P2SC movie repository here: https://proba2.oma.be/swap/data/mpg/movies/.
Friday August 25
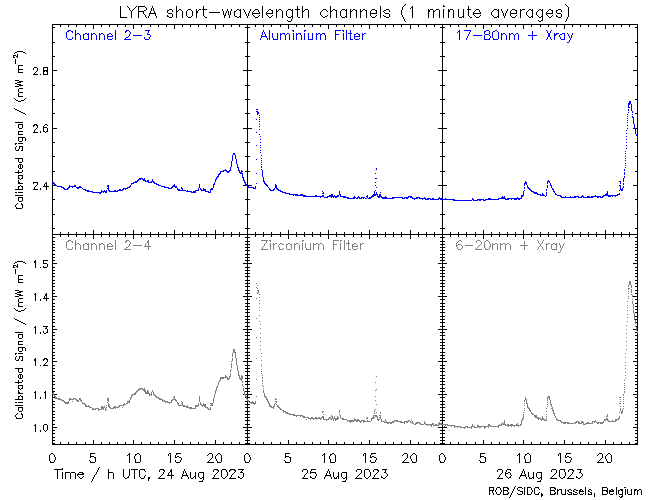
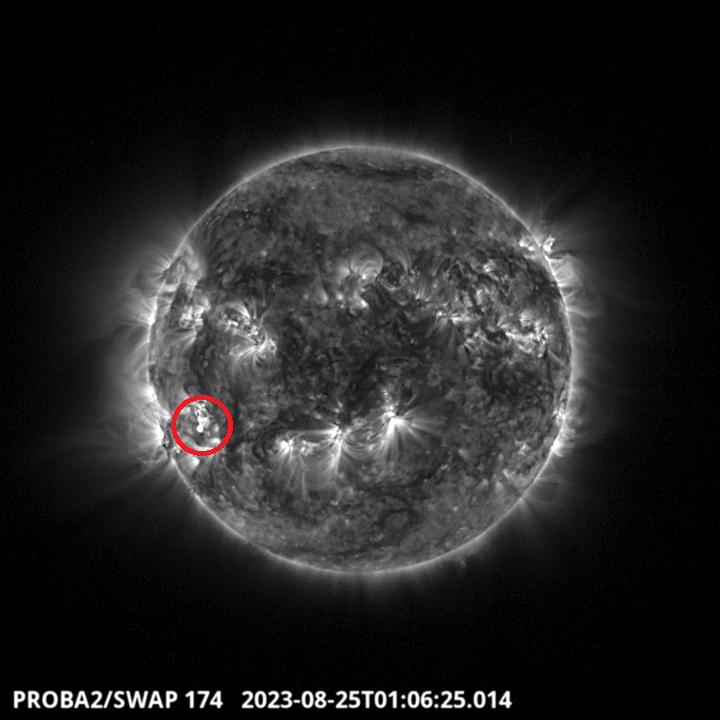
The largest flare of this week, an M1.4 flare, was observed by LYRA (top panel) and SWAP (bottom panel). The flare peaked on 2023-Aug-25 at 01:09 UT. It occurred in the south-eastern hemisphere (encircled in red), and it originated from NOAA AR3415.
Find a SWAP movie of the event here: https://proba2.sidc.be/swap/movies/20230825_swap_movie.mp4.
Noticeable Solar Events
| DAY | BEGIN | MAX | END | LOC | XRAY | OP | 10CM | TYPE | Cat | NOAA |
| 22 | 2235 | 2304 | 2338 | N11W29 | M1.1 | SF | CTM/2VI/2 | 27 | 3405 | |
| 25 | 0056 | 0109 | 0126 | S12E50 | M1.4 | 1N | VI/1III/1 | 32 | 3415 | |
| 26 | 2205 | 2250 | 2342 | M1.1 |
| LOC: approximate heliographic location | TYPE: radio burst type |
| XRAY: X-ray flare class | Cat: Catania sunspot group number |
| OP: optical flare class | NOAA: NOAA active region number |
| 10CM: peak 10 cm radio flux |
Review of Ionospheric Activity
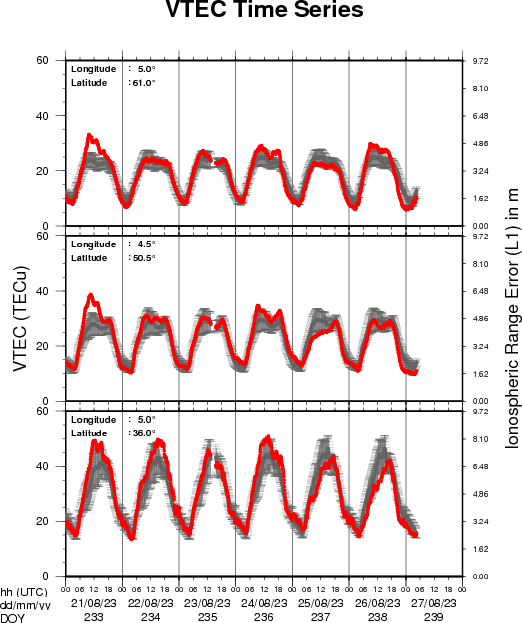
The figure shows the time evolution of the Vertical Total Electron Content (VTEC) (in red) during the last week at three locations:
a) in the northern part of Europe(N 61deg E 5deg)
b) above Brussels(N 50.5deg, E 4.5 deg)
c) in the southern part of Europe(N 36 deg, E 5deg)
This figure also shows (in grey) the normal ionospheric behaviour expected based on the median VTEC from the 15 previous days.
The VTEC is expressed in TECu (with TECu=10^16 electrons per square meter) and is directly related to the signal propagation delay due to the ionosphere (in figure: delay on GPS L1 frequency).
The Sun's radiation ionizes the Earth's upper atmosphere, the ionosphere, located from about 60km to 1000km above the Earth's surface.The ionization process in the ionosphere produces ions and free electrons. These electrons perturb the propagation of the GNSS (Global Navigation Satellite System) signals by inducing a so-called ionospheric delay.
See http://stce.be/newsletter/GNSS_final.pdf for some more explanations ; for detailed information, see http://gnss.be/ionosphere_tutorial.php
Geomagnetic Observations in Belgium
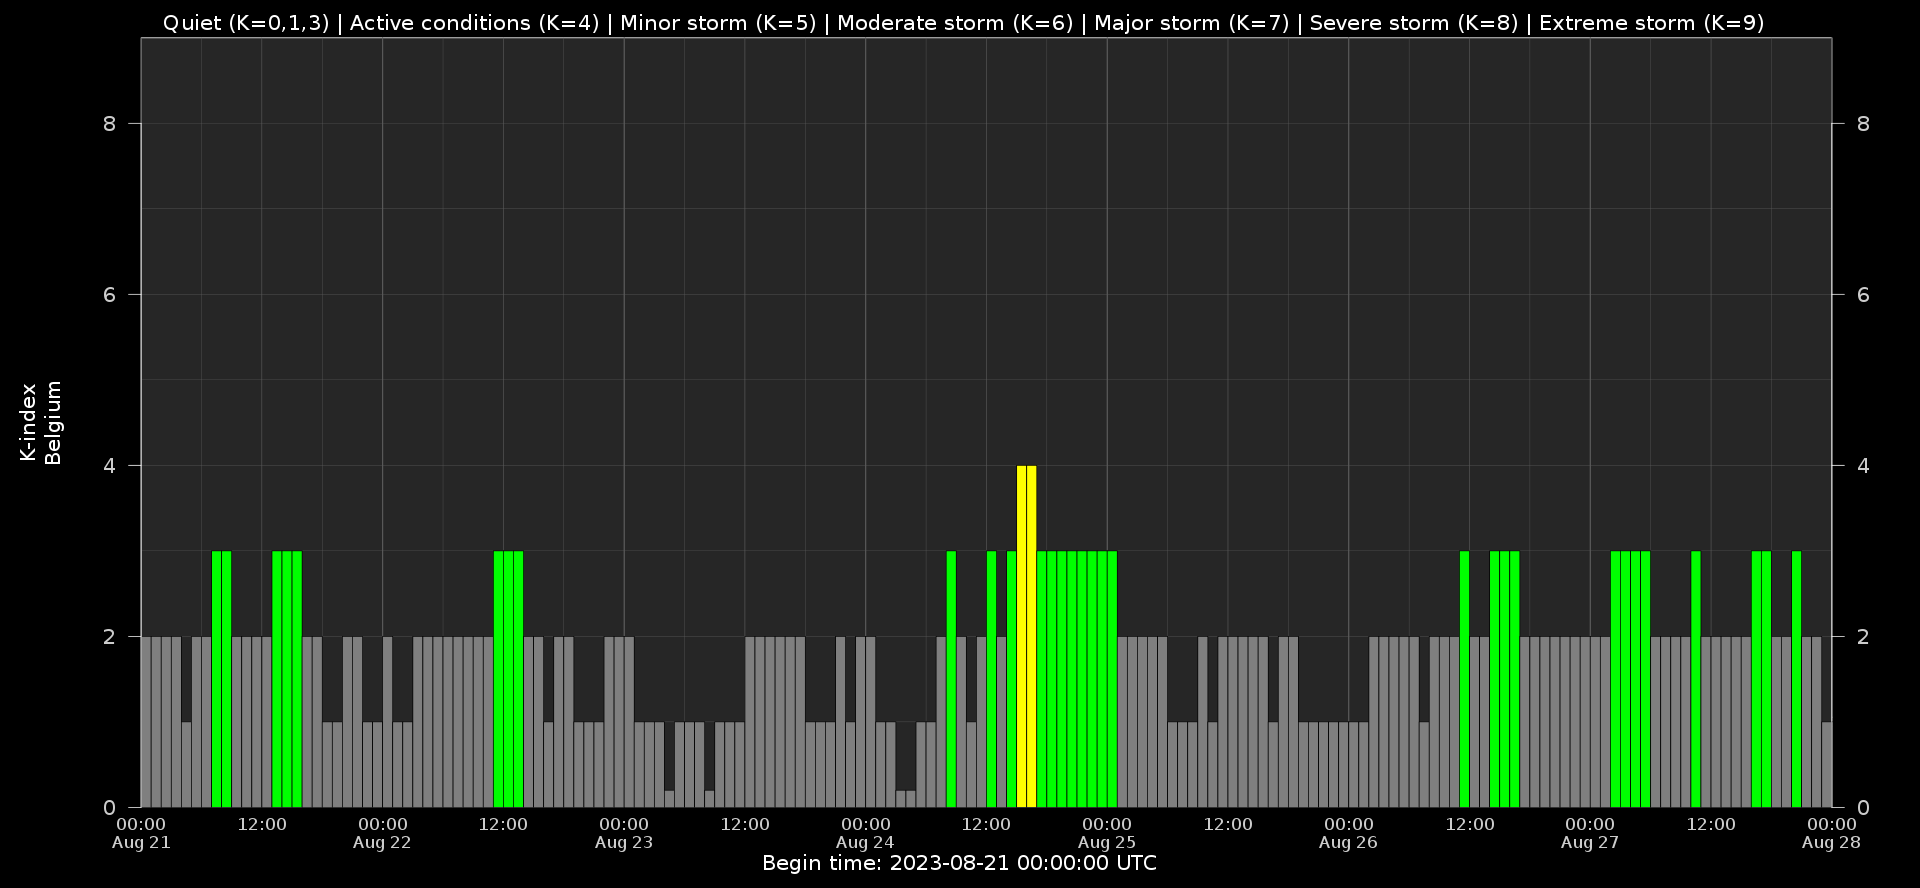
Local K-type magnetic activity index for Belgium based on data from Dourbes (DOU) and Manhay (MAB). Comparing the data from both measurement stations allows to reliably remove outliers from the magnetic data. At the same time the operational service availability is improved: whenever data from one observatory is not available, the single-station index obtained from the other can be used as a fallback system.
Both the two-station index and the single station indices are available here: http://ionosphere.meteo.be/geomagnetism/K_BEL/
The SIDC Space Weather Briefing
The Space Weather Briefing presented by the forecaster on duty from 20 to 27 August. It reflects in images and graphs what is written in the Solar and Geomagnetic Activity report: https://www.stce.be/briefings/20230828_SWbriefing

If you need to access the movies, contact us: stce_coordination at stce.be
Review of Space Weather
WEEK 1183 from 2023 Aug 28
Solar Active Regions (ARs) and flares
Solar flaring activity was at a low level at the start of the week and increased to moderate level activity towards middle of the week, with several C-class flares and 4 M-class flares recorded. There were 8 numbered active regions on the visible solar disk.
The M-class flares were produced by NOAA AR 3413, that was the main driver of the flaring activity observed over the past week. The largest flare detected was an M6.0 flare, peaking at 08:36 UTC on Sept 03. Another notable flare was a long duration M1.2 flare, peaking at 03:51 on Sept 01, that was associated with a Type II and Type IV radio burst, a proton event, and a partial halo CME. Furthermore, an M3.4 flare, peaking at 07:12 on Sept 02, and a long duration M1.1 flare, peaking at 00:23 on Sept 03, were associated with NOAA AR 3413.
Coronal mass ejections
A Coronal Mass Ejection (CME) was observed in SOHO/LASCO-C2 at around 17:48 UTC on Aug 29, directed towards the northwest. The CME is believed to have originated from a region of coronal dimming located near N05W35.
A partial halo CME was first observed in the LASCO/C2 coronagraph imagery at 22:12 UTC on Aug 30, directed towards the southeast. The CME was associated to a filament eruption near the disk centre and a GOES C1.4 flare, peaking at 21:26 UTC on Aug 30. The CME showed an Earth directed component and was predicted to arrive late on Sept 02 or early on Sept 03, possibly merged with the earlier CME mentioned above.
A fast partial halo CME was observed in LASCO/C2 coronagraph data from 04:17 UTC on Sept 01. The CME was associated with an M1.2 flare originating from NOAA AR 3413, which also caused a proton event. The CME was directed to the north-west and was estimated to give a glancing blow to Earth's environment on September 03.
A partial halo CME with angular width of 170 degrees first appeared in the SOHO/LASCO-C2 field of view at 05:24 UTC on September 03. The CME was associated with the C5.9 flare which peaked at 06:15 UTC on September 03, from NOAA AR 3413. Another partial halo CME, with angular width around 198 degrees erupted towards the north-west at 09:12 UTC on September 03 (as seen by LASCO-C2). It was related to an M6.0 flare, peaking at 08:36 UTC on September 03, from NOAA AR 3413. The source region of these two CMEs was slightly behind the west limb, and the CMEs are therefore not expected to affect the Earth.
Coronal Holes
A positive polarity coronal hole in the northern hemisphere began to transit the central meridian on August 28. Later in the week, on September 02, a small positive polarity coronal hole in the northern hemisphere also crossed the central meridian .
Proton flux levels
The greater than 10 MeV proton flux was at nominal levels until 03:50 UTC on Sept 01. It then increased rapidly and exceed the 10 pfu threshold by 04:30 UTC on Sept 01. This proton event was associated with the M1.2 flare and the halo CME. The proton flux dropped below the 10 pfu threshold the same day at 20:15 UTC, and remained below the threshold for the rest of the week.
Electron fluxes at GEO
The greater than 2 MeV electron flux remained below the 1000 pfu threshold throughout the week.
Solar wind
The solar wind parameters were indicative of slow solar wind conditions at the start of the week. The solar wind speed showed a gradually decreasing trend, decreasing from 460 km/s to values around 320 km/s. The interplanetary magnetic field magnitude was below 8 nT. The southward component of the interplanetary magnetic field fluctuated between -6 nT and 5 nT.
A high-speed stream from a positive polarity coronal hole began to influence the Earth on August 31. The solar wind conditions became slightly disturbed with the total interplanetary magnetic field rose to 12 nT at around 17:00 UTC on August 30. The north-south component of the magnetic field was variable, ranging between -8 to 10 nT. The solar wind velocity followed an increasing trend, rising from 320 km/s to 570 km/s. By the end of the week, the solar wind speed was slowly decreasing to the values around around 450 km/s.
Geomagnetism
At the start of the week the geomagnetic conditions were quiet to unsettled (NOAA KP 1-3 and K-Bel 1-3). On September 02, the level increased to moderate storm conditions globally (NOAA Kp =6-) and minor storm conditions locally (K Bel = 5), likely related to a high speed stream influence, possibly combined with a weak arrival of CMEs from Aug 29 - 30. Conditions then returned to quiet to unsettled levels on September 03.
International Sunspot Number by SILSO
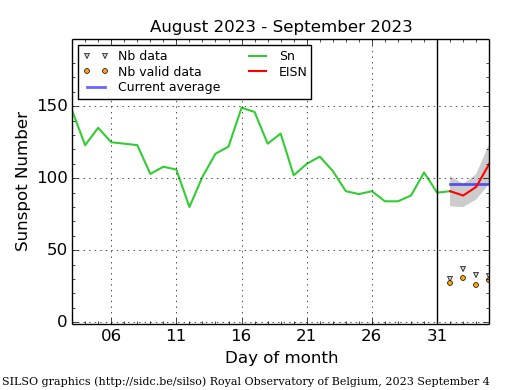
The daily Estimated International Sunspot Number (EISN, red curve with shaded error) derived by a simplified method from real-time data from the worldwide SILSO network. It extends the official Sunspot Number from the full processing of the preceding month (green line), a few days more than one solar rotation. The horizontal blue line shows the current monthly average. The yellow dots give the number of stations that provided valid data. Valid data are used to calculate the EISN. The triangle gives the number of stations providing data. When a triangle and a yellow dot coincide, it means that all the data is used to calculate the EISN of that day.
Noticeable Solar Events
| DAY | BEGIN | MAX | END | LOC | XRAY | OP | 10CM | TYPE | Cat | NOAA |
| 01 | 0220 | 0318 | 0326 | M1.0 | 150 | IV/2VI/1II/2 | 31 | 3413 | ||
| 01 | 0326 | 0352 | 0406 | M1.2 | ||||||
| 01 | 0254 | 0351 | 0447 | M1.2 | 190 | IV/2VI/1II/2 | 31 | 3413 | ||
| 02 | 0633 | 0712 | 0738 | N10W82 | M3.3 | SF | 230 | VI/1 | 31 | 3413 |
| 03 | 0014 | 0023 | 0033 | M1.1 | III/2 | 31 | 3413 | |||
| 03 | 0809 | 0836 | 0849 | M6.0 | III/1 | 31 | 3413 |
| LOC: approximate heliographic location | TYPE: radio burst type |
| XRAY: X-ray flare class | Cat: Catania sunspot group number |
| OP: optical flare class | NOAA: NOAA active region number |
| 10CM: peak 10 cm radio flux |
Review of Ionospheric Activity
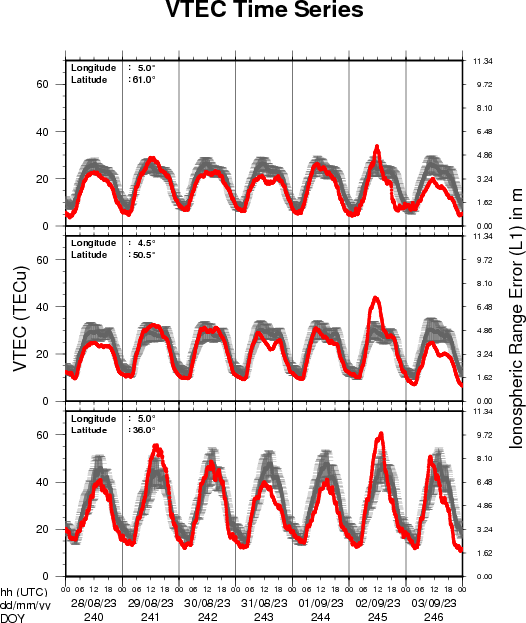
The figure shows the time evolution of the Vertical Total Electron Content (VTEC) (in red) during the last week at three locations:
a) in the northern part of Europe(N 61deg E 5deg)
b) above Brussels(N 50.5deg, E 4.5 deg)
c) in the southern part of Europe(N 36 deg, E 5deg)
This figure also shows (in grey) the normal ionospheric behaviour expected based on the median VTEC from the 15 previous days.
The VTEC is expressed in TECu (with TECu=10^16 electrons per square meter) and is directly related to the signal propagation delay due to the ionosphere (in figure: delay on GPS L1 frequency).
The Sun's radiation ionizes the Earth's upper atmosphere, the ionosphere, located from about 60km to 1000km above the Earth's surface.The ionization process in the ionosphere produces ions and free electrons. These electrons perturb the propagation of the GNSS (Global Navigation Satellite System) signals by inducing a so-called ionospheric delay.
See http://stce.be/newsletter/GNSS_final.pdf for some more explanations ; for detailed information, see http://gnss.be/ionosphere_tutorial.php
Geomagnetic Observations in Belgium
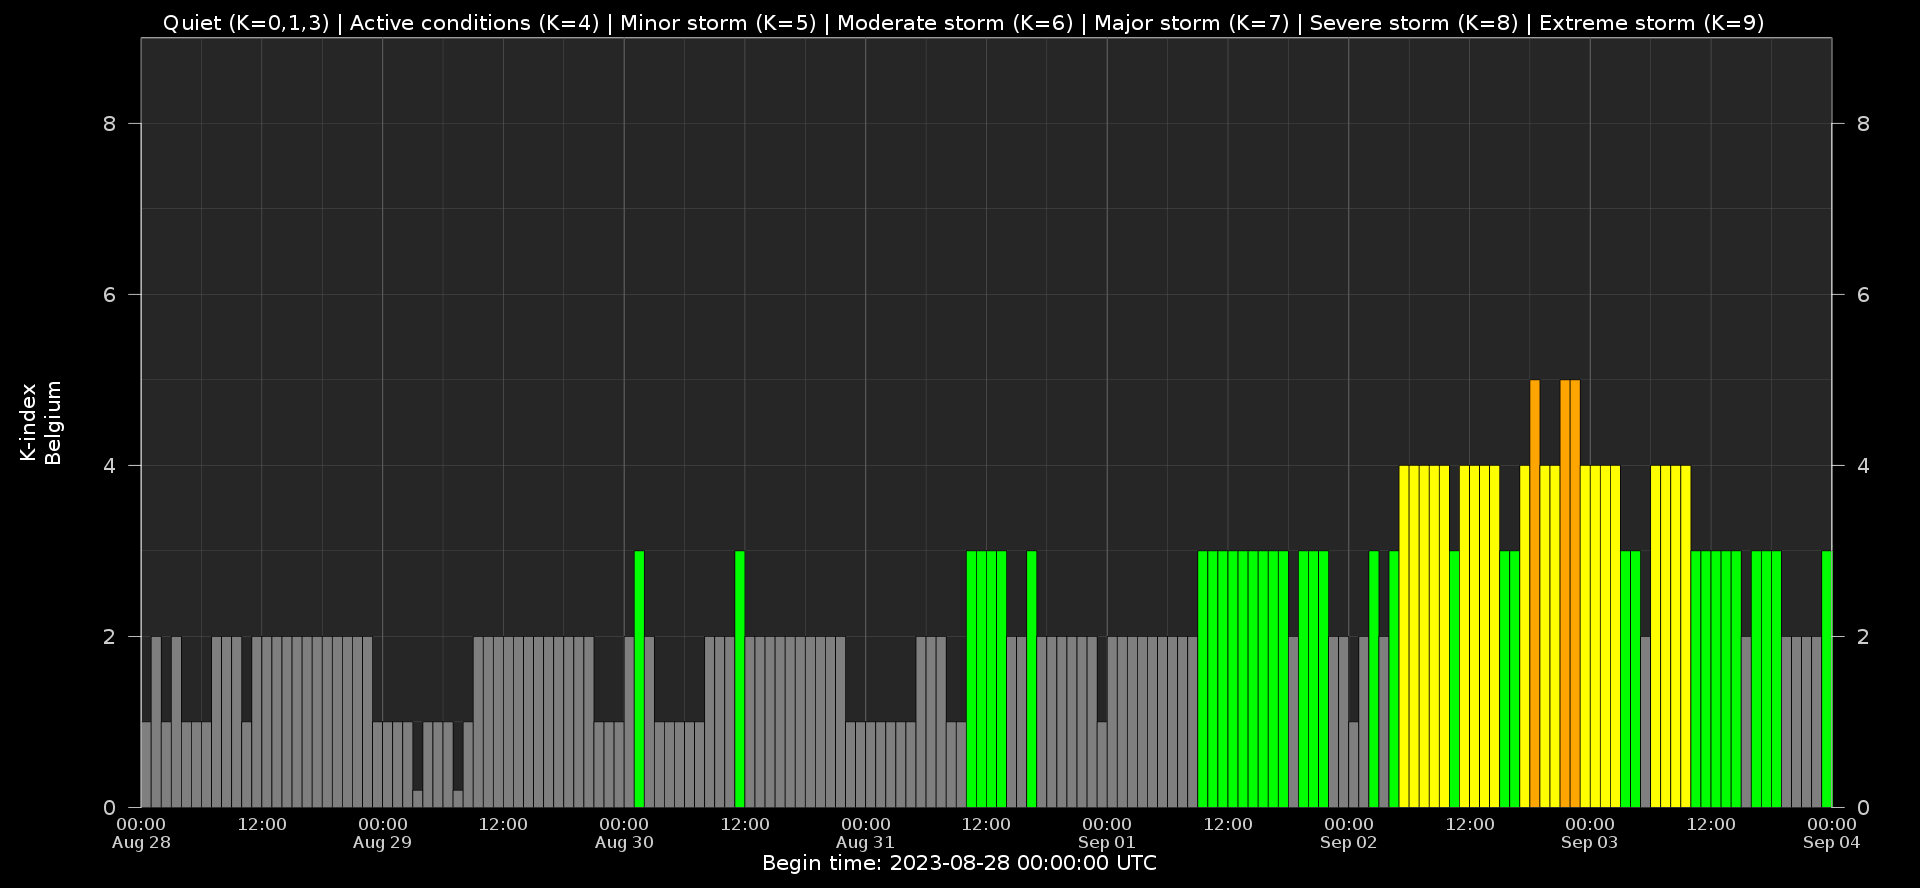
Local K-type magnetic activity index for Belgium based on data from Dourbes (DOU) and Manhay (MAB). Comparing the data from both measurement stations allows to reliably remove outliers from the magnetic data. At the same time the operational service availability is improved: whenever data from one observatory is not available, the single-station index obtained from the other can be used as a fallback system.
Both the two-station index and the single station indices are available here: http://ionosphere.meteo.be/geomagnetism/K_BEL/
The SIDC Space Weather Briefing
The Space Weather Briefing presented by the forecaster on duty from August 28 to September 3. It reflects in images and graphs what is written in the Solar and Geomagnetic Activity report: https://www.stce.be/briefings/20230904_SWbriefing

If you need to access the movies, contact us: stce_coordination at stce.be
STCE Activities
Check out our activity calendar: activities and encounters with the Sun-Space-Earth system and Space Weather as the main theme. We provide occasions to get submerged in our world through educational, informative and instructive activities.
If you want your event in our calendar, contact us: stce_coordination at stce.be
* Sept 9-10, Open Doors at the Humain Radioastronomy Station, Humain, Belgium
* Sept 12-13, PITHIA-NRF Fifth Training for Partners, London, UK
* Sep 18-20, STCE Space Weather Introductory Course, Brussels, Belgium - full
* Sep 26, post-Space Weather Introductory Course, by JMG, registration is included in the September SWIC
* Nov 18-19, e-SWAN Space Weather School: data, models and services, by the STCE, Toulouse, France
* Dec 4-6, STCE course: Space Weather impacts on ionospheric wave propagation - focus on GNSS and HF, Brussels, Belgium - Registrations are open
* Jan 22-24, 2024, STCE Space Weather Introductory Course, Brussels, Belgium - Registrations are open
* Jan 25, 2024, post-Space Weather Introductory Course, by JMG and MeteoWing, place TBD - registration is included in the January SWIC
Check: https://www.stce.be/calendar