- Table of Content
- 1.Filament erupt...
- 2.Review of Spac...
- 3.International ...
- 4.PROBA2 Observa...
- 5.Noticeable Sol...
- 6.Geomagnetic Ob...
- 7.Review of Iono...
- 8.The SIDC Space...
- 9.STCE Activitie...
2. Review of Space Weather
3. International Sunspot Number by SILSO
4. PROBA2 Observations
5. Noticeable Solar Events
6. Geomagnetic Observations in Belgium
7. Review of Ionospheric Activity
8. The SIDC Space Weather Briefing
9. STCE Activities
Filament eruption
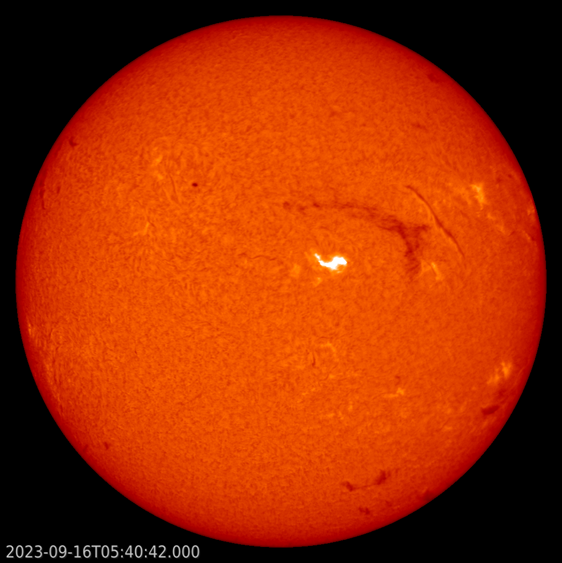
Solar filaments are clouds of charged particles ("plasma") above the solar surface squeezed between magnetic regions of opposite polarity. Being cooler and denser than the plasma underneath and their surroundings, they appear as dark lines when seen on the solar disk and as bright blobs when seen near the solar limb (then they are called "prominences"). Special filters are required to observe these features, and one such a filter is the Hydrogen-alpha (H-alpha) line in the red part of the solar spectrum.
Early on 16 September a large filament near active region NOAA 3429 became unstable and erupted. The source of this instability might have been an M2 flare by NOAA 3429 that peaked at 00:50UTC. A stronger flare (M3) in the same sunspot region peaked a few hours later at 05:38UTC, but at that time, the filament eruption was already well going on. It is also possible that the magnetic fields holding the filament became unstable from their own as this concerned indeed quite a long filament. The eruption itself was not associated with an obvious x-ray flare. The H-alpha snapshot underneath was taken by the groundstations of the NSO/GONG network (https://gong.nso.edu/ ), showing the filament eruption in process around the time of the maximum of the M3 flare. Many decades ago, such events were also called "disparition brusque" (sudden disappearance), to highlight the suddenness of the filament's vanishing often after days or weeks with no appreciable change.
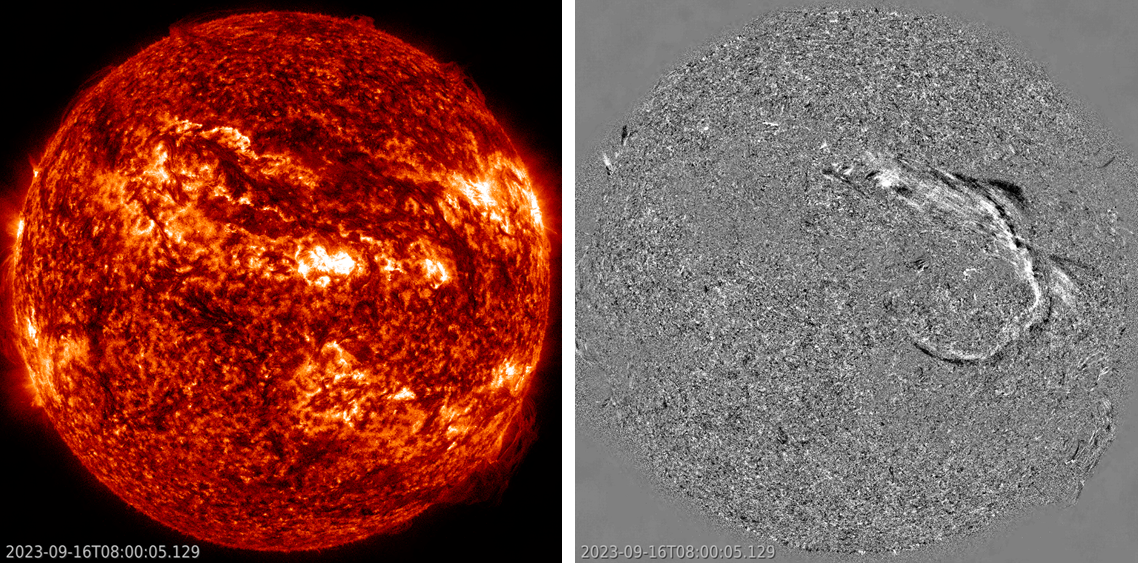
SDO AIA 304 imagery (https://sdo.gsfc.nasa.gov/data/aiahmi/ ) reveal the size of the erupting filament, including the evolution of the anchor points, one of which was located in the southern hemisphere near another active region (NOAA 3431). This eruption can be even better followed in the difference images, where one image is subtracted from the next. Note the filament eruption itself was not associated with a significant flare. Ribbons were not visible in H-alpha images, but AIA 304 images show some ribbons in particular for the northern half of the eruption and to a much smaller extent near the outer end of the southern half. These ribbons are located fairly symmetrically (parallel) along the magnetic inversion line ("neutral line") and result from coronal material raining down into the much denser chromosphere. The images underneath show the eruption in AIA 304 (left) and the difference images (right). Clips are available in the online version of this newsitem at https://www.stce.be/news/665/welcome.html
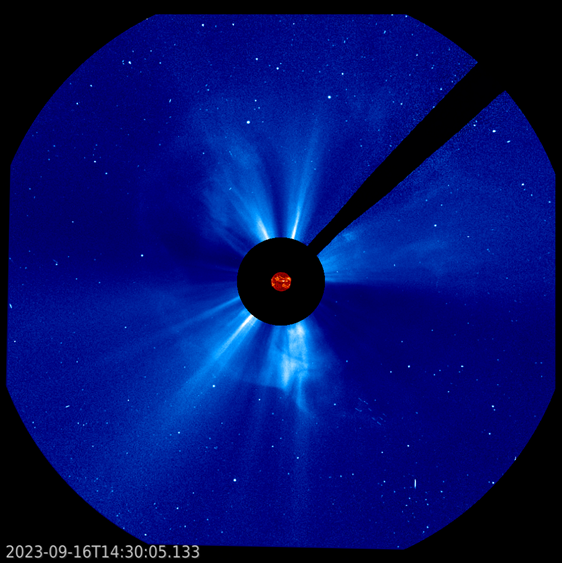
Finally, a coronal mass ejection (CME) was associated with this eruption. Coronagraphic imagery by SOHO/LASCO C2 (http://sohowww.nascom.nasa.gov/data/realtime-images.html ) revealed a partial halo CME with rather slow speed around 400 km/s starting at 09:12UTC (CACTus - https://www.sidc.be/cactus/out/latestCMEs.html ). Underneath is a compilation of AIA 304 and LASCO C3 images. An impact was expected on 19 September, with a moderate geomagnetic storm possible.
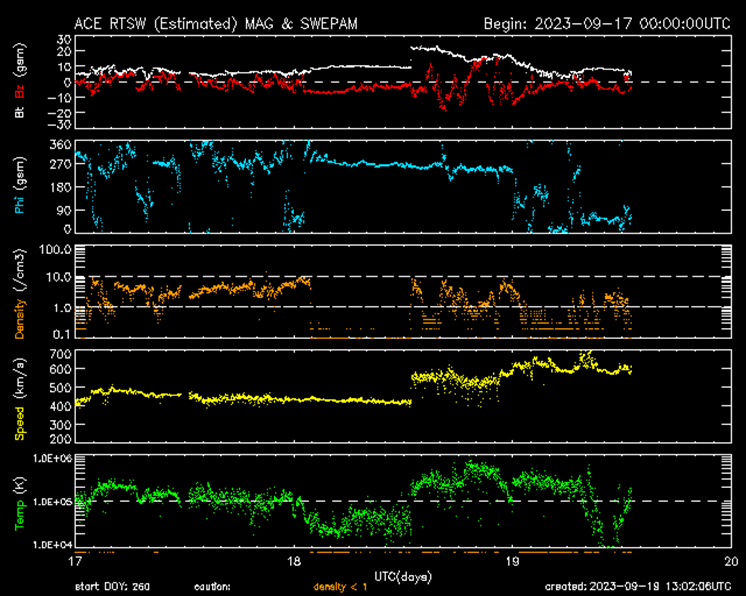
As it turns out, the interplanetary CME arrived at the earth environment over a day sooner than expected, with a strong shock in the solar wind parameters (DSCOVR - https://www.swpc.noaa.gov/products/real-time-solar-wind ) observed on 18 September at 12:57 UTC. The magnetic field jumped from 9 to 22 nT, and the solar wind speed from 420 to 550 km/s (SIDC PRESTO - https://www.sidc.be/index.php ). The graphs underneath are from the ACE satellite (https://www.swpc.noaa.gov/products/ace-real-time-solar-wind ), showing for the period 17-19 September the total intensity of the interplanetary magnetic field and that of the north-south component Bz (resp. white and red), the direction of the horizontal component (i.e. towards or away from the Sun ; blue), the solar wind density (orange), speed (yellow) and temperature (green). Strong (major) geomagnetic storming levels were observed during the 03-06UTC interval (Kp) on 19 September. The Dst index (Kyoto WDC - https://wdc.kugi.kyoto-u.ac.jp/index.html ) only decreased to a modest -82 nT, which correpsonds to a moderate storm as outlined in the STCE's SWx classification page at https://www.stce.be/educational/classification#levelsmagn . The local K-index for Belgium (http://ionosphere.meteo.be/geomagnetism/K_BEL/ ) reached only minor geomagnetic storm levels.
A few space weather effects were recorded. Aurora were photographed in France, but in general their visibility remained restricted to the usual locations such as Scotland, Scandinavia, and along the Canada-United States border. The launch of an Electron rocket apparently got delayed by 20 minutes due to the adverse geomagnetic conditions (SpaceNews - https://spacenews.com/electron-fails-during-capella-space-launch/ ). A number of advisories were issued (https://pecasus.eu/ ) for the benefit of the civil aviation, alerting for a depression of the maximum useable radio frequency (HF range, i.e. 3-30 MHz - see also this STCE newsitem at https://www.stce.be/news/640/welcome.html for more info).
Review of Space Weather
Solar Active Regions and flares
The solar flaring activity over the past week was mostly at low to moderate levels.
There were fifteen active regions (ARs) on the visible solar disk facing Earth and 11 M-class flares were recorded. The solar activity throughout the week was dominated by NOAA AR 3429, which was the most complex active region and produced most of the observed M-class flaring. It started the week with underlying magnetic field configuration classified as class beta and later on evolved into a more complex type beta-gamma-delta. The largest active region with largest number of sunspots throughout the week was NOAA AR 3423. It was classified as magnetic type beta-gamma for several days, but produced only a single isolated low M-class flare. Other notable regions were NOAA AR 3425 and NOAA AR 3431, which both contributed to the moderate levels of activity and reached magnetic complexity type beta-gamma and beta-delta, respectively. The remaining active regions have been either simple and inactive or have shown only low levels of activity.
Coronal mass ejections
As expected for this period approaching solar maximum, the solar surface was full of filaments and multiple filament eruptions were observed throughout the week.
A notable filament eruption was detected around 06:26 UTC on Sept 14th near NOAA AR3429 (beta) with an associated M1.4 flare, start time 06:40 UTC, end time 08:39UTC, peak time 07:45 UTC, and a north-westward halo coronal mass ejection (CME) first visible in the LASCO/C2 chronograph imagery at 07:30 UTC. The CME had a projected velocity close to 600 km/s and a glancing blow from it was expected to arrive to Earth on Sept 16th or Sept 17th.
Several back-sided partial halo CMEs were detected on Sept 11th with no expected impact on Earth.
A very slow north-westward CME was detected by LASCO/C2 on Sept 10th at 17:12 UTC with projected speed of 225 km/s. Some chances were given for a glancing blow from this CME to arrive to Earth on Sept 14th or Sept 15th.
An eastward partial halo CME was observed on Sept 11th at 01:25 UTC with a projected velocity of about 500 km/s. The CME was associated with an M1.4 flare from NOAA AR 3429 and a type II radio emission. A glancing blow was
possible on Sept 14th.
The most notable CME throughout the week was related to a large filament eruption in the central-north part of the Sun near NOAA AR 3429 and NOAA AR 3434 which occurred around 04:13 UTC on Sept 16th. The associated halo CME was first observed in SOHO/LASCO-C2 coronagraph data at 09:12 UTC on Sept 16th with a projected velocity of about 400 km/s. The CME was estimated to be Earth-directed with expected arrival on Sept 19th.
Coronal Holes
Five relatively small coronal holes of different polarity had crossed the central meridian throughout the week.
An elongated high-latitude positive polarity coronal hole in the northern hemisphere and a small negative polarity coronal hole in the southern hemisphere have crossed central the meridian on Sept 10th and related possible enhancements in the solar wind near Earth could be expected to arrive on Sept 14th-Sept 15th. A elongated equatorial negative polarity coronal hole had crossed the central meridian on Sept 12th and some enhanced solar wind conditions could be expected on Sept 16th - Sept 17th. Finally a small mid-latitude positive polarity coronal hole in the southern hemisphere and an elongated negative polarity coronal hole in the northern hemisphere have crossed the central meridian on Sept 16th. Enhanced solar wind speeds at Earth were expected at the earliest on Sept 19th.
Proton flux levels
The greater than 10 MeV proton flux was at the background level during the whole week with minor enhancements on Sept 14th probably due to gradual particle acceleration at the shock of the Sept 16th coronal mass ejection.
Electron fluxes at GEO
The greater than 2 MeV electron flux was below the 1000 pfu threshold throughout the entire the week. The corresponding electron fluence was at nominal levels.
Solar wind
The week started in a slow solar wind regime until a fast-forward shock marking an ICME arrival was registered in the solar wind parameters (DSCOVR and ACE) around 11:22 UTCon Sept 12th. The ICME arrival was possibly related to a faint halo CME from Sept 07th. During the arrival the interplanetary magnetic field reached 20 nT with a minimum Bz down to -19 nT. The solar wind velocity mildly increased up to 440 km/s.
The solar wind conditions remained slightly elevated on Sept 13th and registered an expected high speed stream (HSS) arrival on Sept 14th with velocities reaching 520 km/s. The HSS influence was waning on Sept 15th and signatures of the next HSS arrival were disclosed in the solar wind data starting in the late UTC evening of Sept 16th. The interplanetary magnetic field was mildly enhanced to 11 nT with a minimum Bz of -8.7 nT. The solar wind velocity reached 500 km/s. The solar wind conditions remained at these mildly elevated levels throughout Sept 17th.
Geomagnetism
The geomagnetic conditions in the beginning of the week were predominantly quiet.
Minor to moderate storm levels were reached for several hours with the ICME arrival in the UTC afternoon of Sept 12th with NOAA Kp index reaching 6- in the interval 03-06 UTC. Locally over Belgium only minor storm levels were observed. Mostly unsettled to active conditions were observed on Sept 13th under the waning influence of the ICME arrival. Further active conditions were observed globally following a high speed stream (HSS) on Sept 14th with local isolated minor storms registered over Belgium close to UTC midnight. The geomagnetic conditions returned to mostly quiet levels on Sept 15th and remained so until the next HSS arrival in the late UTC evening of Sept 16th. From then onwards mostly unsettled geomagnetic conditions were observed with isolated active periods.
International Sunspot Number by SILSO

The daily Estimated International Sunspot Number (EISN, red curve with shaded error) derived by a simplified method from real-time data from the worldwide SILSO network. It extends the official Sunspot Number from the full processing of the preceding month (green line), a few days more than one solar rotation. The horizontal blue line shows the current monthly average. The yellow dots give the number of stations that provided valid data. Valid data are used to calculate the EISN. The triangle gives the number of stations providing data. When a triangle and a yellow dot coincide, it means that all the data is used to calculate the EISN of that day.
PROBA2 Observations
Solar Activity
Solar flare activity fluctuated from low to moderate during the week.
In order to view the activity of this week in more detail, we suggest to go to the following website from which all the daily (normal and difference) movies can be accessed: https://proba2.oma.be/ssa
This page also lists the recorded flaring events.
A weekly overview movie can be found here (SWAP week 703). https://proba2.sidc.be/swap/data/mpg/movies/weekly_movies/weekly_movie_2023_09_11.mp4
Details about some of this week's events can be found further below.
If any of the linked movies are unavailable they can be found in the P2SC movie repository here: https://proba2.sidc.be/swap/data/mpg/movies/
Thursday Sep 14
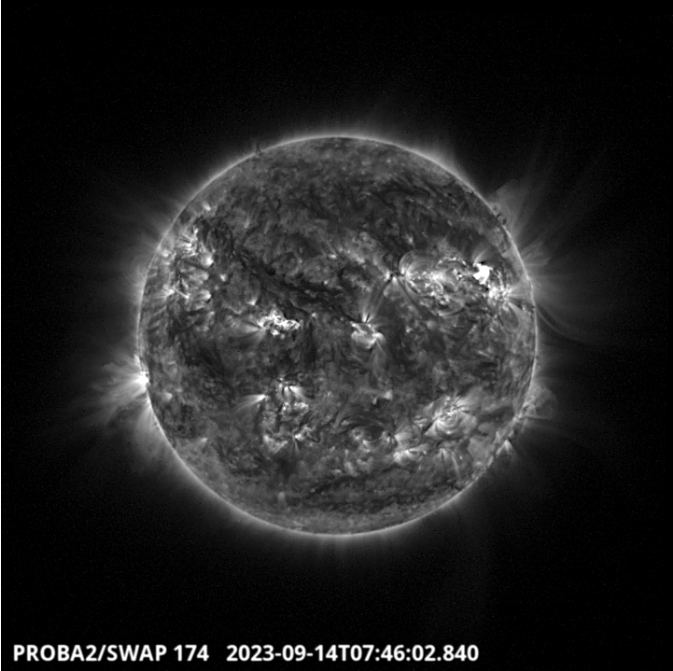
A filament erupted around 07:46 UT from the North West quadrant of the solar disk. It was followed
directly by a flare produced by the active region NOAA 3429. Find a SWAP movie of the event here. https://proba2.sidc.be/swap/movies/20230914_swap_movie.mp4
Saturday Sep 16
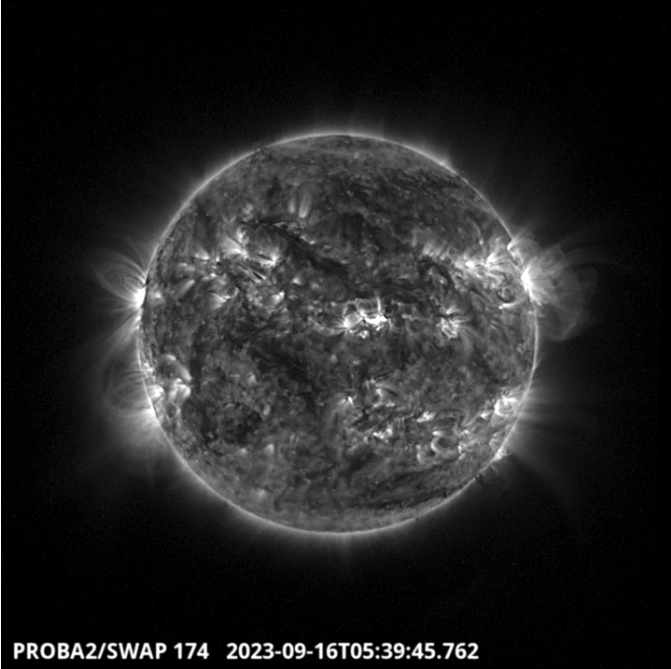
The largest flare of the week, an M3.3, has been produced around 05:39 UT by active region NOAA 3429, close to the center of the solar disk. Another eruptive signature, a dimming, was also
visible (AR3433) on the North East part of the solar disk. Find a SWAP movie of the event here. https://proba2.sidc.be/swap/movies/20230916_swap_movie.mp4
Noticeable Solar Events
| DAY | BEGIN | MAX | END | LOC | XRAY | OP | 10CM | TYPE | Cat | NOAA |
| 11 | 0108 | 0128 | 0157 | N8E62 | M1.3 | 1F | II/2VI/2III/2 | 57 | 3429 | |
| 11 | 0358 | 0407 | 0415 | S9E59 | M1.1 | SN | 58 | 3431 | ||
| 11 | 1438 | 1449 | 1459 | S4E50 | M1.1 | SN | 58 | 3431 | ||
| 12 | 0418 | 0426 | 0431 | N22E3 | M1.9 | 1B | 48 | 3425 | ||
| 12 | 0647 | 0707 | 0719 | N17W31 | M2.5 | 2N | 44 | 3423 | ||
| 12 | 0431 | 0442 | 0447 | M1.8 | ||||||
| 14 | 0640 | 0745 | 0839 | M1.4 | III/2 | 57 | 3429 | |||
| 14 | 1923 | 1931 | 1940 | N12E9 | M1.9 | SN | III/2 | 57 | 3429 | |
| 14 | 2117 | 2126 | 2132 | N12E8 | M2.5 | SN | VI/1 | 57 | 3429 | |
| 15 | 2219 | 2229 | 2234 | N12W8 | M1.7 | 1F | 57 | 3429 | ||
| 16 | 0038 | 0050 | 0057 | N11W9 | M2.9 | 1N | 57 | 3429 | ||
| 16 | 0530 | 0538 | 0551 | N11W11 | M3.3 | 1B | 57 | 3429 |
| LOC: approximate heliographic location | TYPE: radio burst type |
| XRAY: X-ray flare class | Cat: Catania sunspot group number |
| OP: optical flare class | NOAA: NOAA active region number |
| 10CM: peak 10 cm radio flux |
Geomagnetic Observations in Belgium

Local K-type magnetic activity index for Belgium based on data from Dourbes (DOU) and Manhay (MAB). Comparing the data from both measurement stations allows to reliably remove outliers from the magnetic data. At the same time the operational service availability is improved: whenever data from one observatory is not available, the single-station index obtained from the other can be used as a fallback system.
Both the two-station index and the single station indices are available here: http://ionosphere.meteo.be/geomagnetism/K_BEL/
Review of Ionospheric Activity

The figure shows the time evolution of the Vertical Total Electron Content (VTEC) (in red) during the last week at three locations:
a) in the northern part of Europe(N 61deg E 5deg)
b) above Brussels(N 50.5deg, E 4.5 deg)
c) in the southern part of Europe(N 36 deg, E 5deg)
This figure also shows (in grey) the normal ionospheric behaviour expected based on the median VTEC from the 15 previous days.
The VTEC is expressed in TECu (with TECu=10^16 electrons per square meter) and is directly related to the signal propagation delay due to the ionosphere (in figure: delay on GPS L1 frequency).
The Sun's radiation ionizes the Earth's upper atmosphere, the ionosphere, located from about 60km to 1000km above the Earth's surface.The ionization process in the ionosphere produces ions and free electrons. These electrons perturb the propagation of the GNSS (Global Navigation Satellite System) signals by inducing a so-called ionospheric delay.
See http://stce.be/newsletter/GNSS_final.pdf for some more explanations ; for detailed information, see http://gnss.be/ionosphere_tutorial.php
The SIDC Space Weather Briefing
The Space Weather Briefing presented by the forecaster on duty from September 10 to 17. It reflects in images and graphs what is written in the Solar and Geomagnetic Activity report: https://www.stce.be/briefings/20230918_SWbriefing.pdf
If you need to access the movies, contact us: stce_coordination at stce.be
STCE Activities
Check out our activity calendar: activities and encounters with the Sun-Space-Earth system and Space Weather as the main theme. We provide occasions to get submerged in our world through educational, informative and instructive activities.
If you want your event in our calendar, contact us: stce_coordination at stce.be
* Oct 12, E-SWAN Sustainability webinar: Going beyond the “old normal” for a sustainable future in science, online
* Nov 18-19, E-SWAN Space Weather School: data, models and services, by the STCE, Toulouse, France
* Dec 4-6, STCE course: Space Weather impacts on ionospheric wave propagation - focus on GNSS and HF, Brussels, Belgium - Registrations are open
* Jan 22-24, 2024, STCE Space Weather Introductory Course, Brussels, Belgium - Registrations are open
* Jan 25, 2024, post-Space Weather Introductory Course, by JMG and MeteoWing, place TBD - registration is included in the Jan SWIC
Check: https://www.stce.be/calendar