- Table of Content
- 1.Delta does it!...
- 2.Review of spac...
- 3.PROBA2 Observa...
- 4.Noticeable Sol...
- 5.International ...
- 6.Geomagnetic Ob...
- 7.Review of Iono...
- 8.The SIDC Space...
- 9.Activities at ...
2. Review of space weather
3. PROBA2 Observations (18 Sep 2023 - 24 Sep 2023)
4. Noticeable Solar Events
5. International Sunspot Number by SILSO
6. Geomagnetic Observations in Belgium
7. Review of Ionospheric Activity
8. The SIDC Space Weather Briefing
9. Activities at the STCE
Delta does it!...
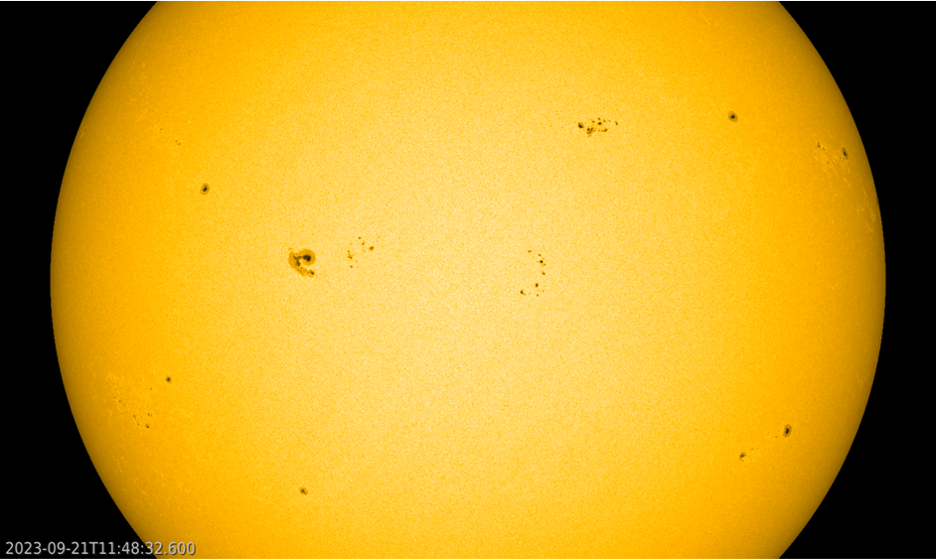
The Sun was peppered with sunspots last week. About a dozen sunspot groups could be seen almost daily, and the estimated international sunspot number (SILSO - https://www.sidc.be/SILSO/home ) even exceeded 200 on 22 and 23 September. The most complex sunspot group was active region NOAA 3435 and stood out because of its compactness. The white light imagery (SDO/HMI - http://sdo.gsfc.nasa.gov/data/aiahmi/ ) underneath shows the numerous freckles on the Sun. NOAA 3435 is the sunspot group in the eastern ("left") solar hemisphere near the solar equator. Clips are in the online version of this newsitem at https://www.stce.be/news/666/welcome.html
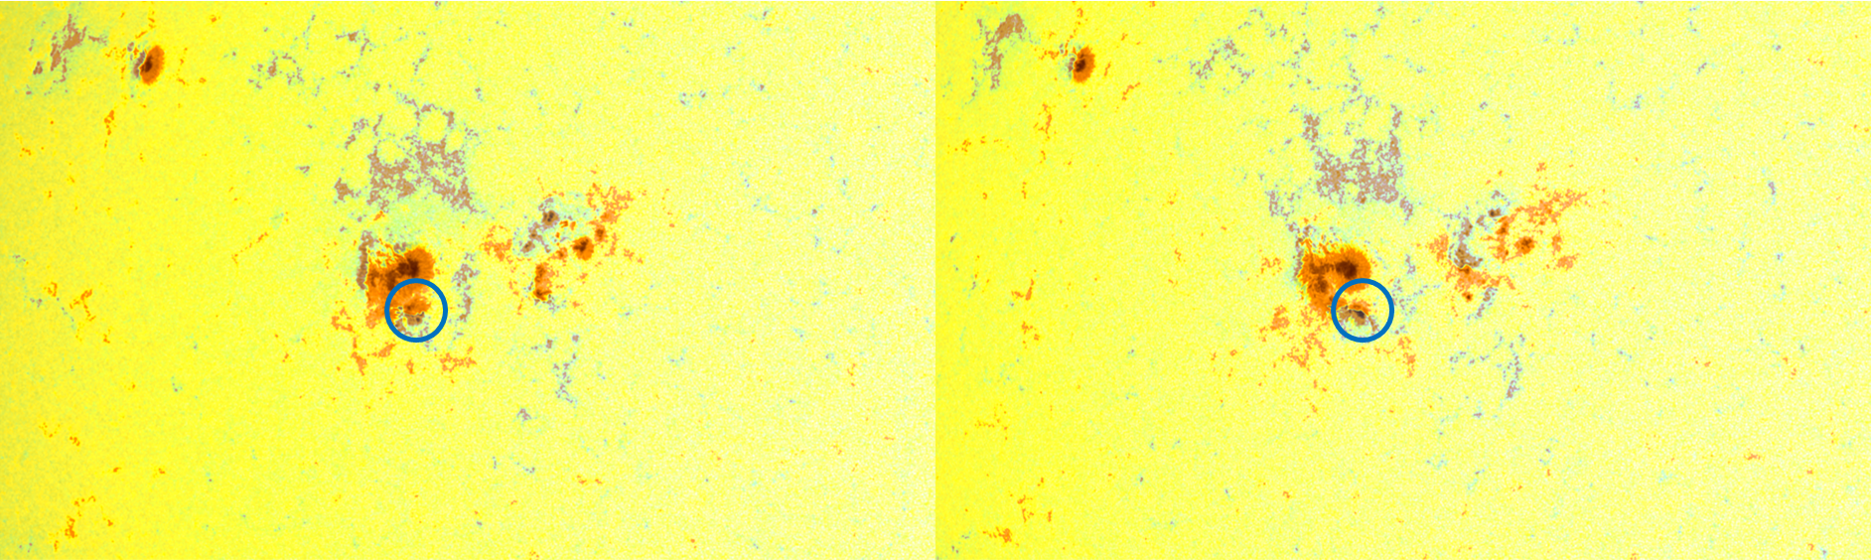
The group developed a magnetic delta configuration from the 18th onwards. A sunspot group is said to contain a magnetic delta when it has at least one mature spot in which umbrae (the dark cores of a sunspot) of opposite magnetic polarities are separated by less than 2 degrees and situated within the common penumbra (the more greyish area surrounding the umbrae). Delta regions have a much higher flaring probability than the other regions. More information on the magnetic configuration of sunspot groups, as well as numerous examples can be found on the STCE's Space Weather classification page at https://www.stce.be/educational/classification This delta in NOAA 3435 developed south of the region's main spot, and gradually moved to the west ("right") during the next few days, gradually separating from the main spot and finally dissolving by late on 22 September. This can be seen in the SDO images underneath where a magnetogram is overlaid on a white light image. The clip covers the 19-22 September range, and the times of the compilation underneath correspond to the timing of the two most important flares produced by this region: an M8.2 event on 20 September at 14:19UTC, and an M8.7 flare on 21 September at 12:54UTC. Blue and red colors denote the opposite magnetic polarities.
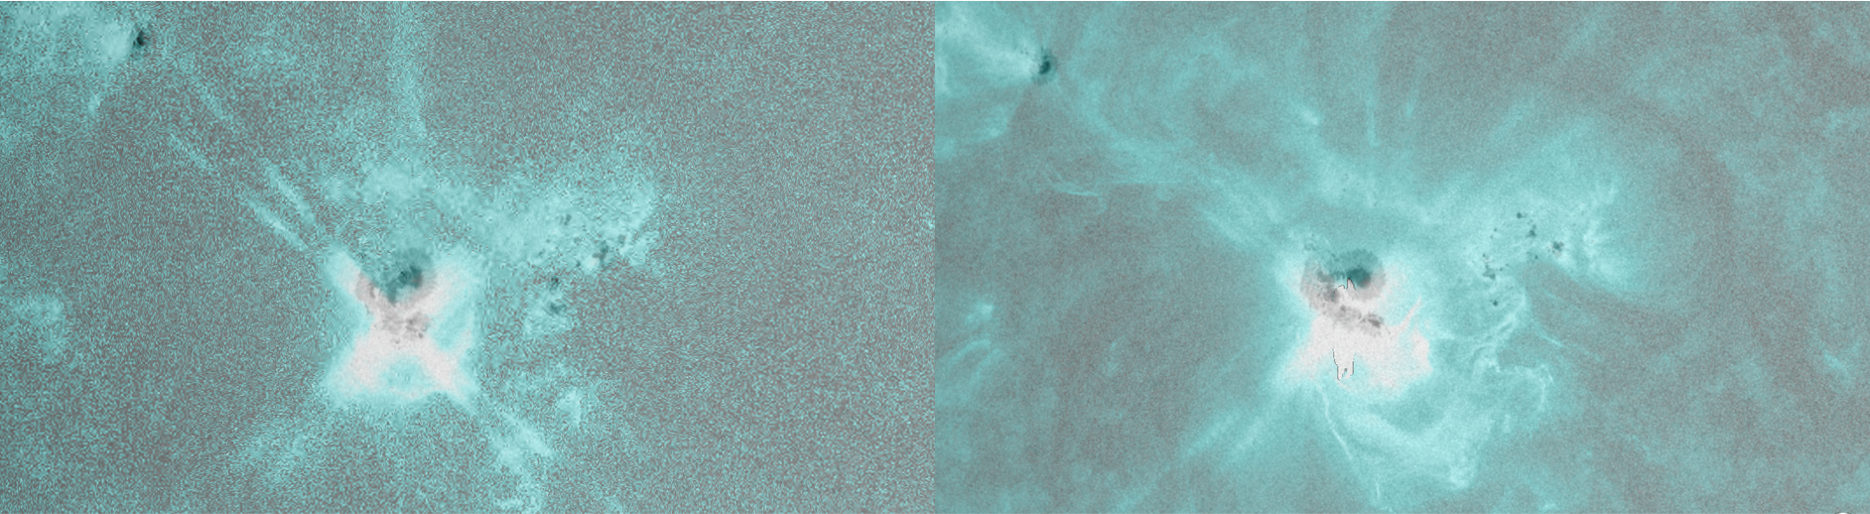
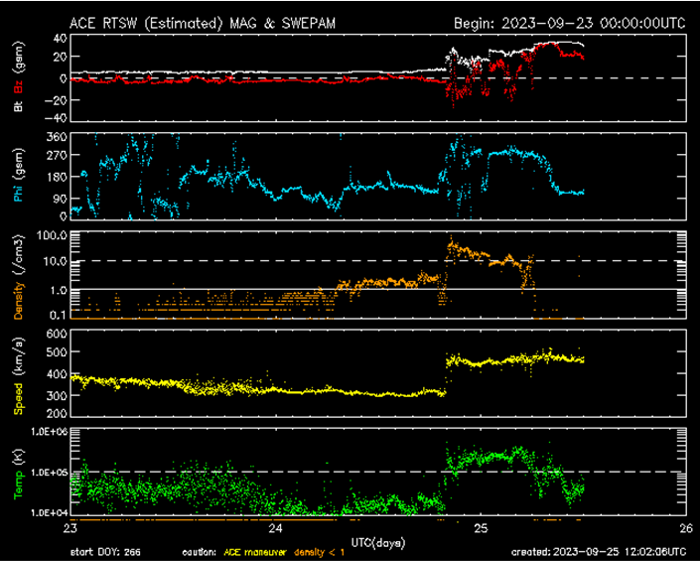
The two M-class flares can be seen in the compilation above (lower row) where an extreme ultraviolet image (SDO/AIA 131) has been overlaid on a white light image. Both flares can be seen to have taken place next to the location of the magnetic delta. The blooming and diffraction patterns in the EUV images are image artefacts, not related to the flare - See this STCE newsitem https://www.stce.be/news/499/welcome.html for more info. The online clip covers 2 days (20-21 September), and the flashes of these M-class events show the relative brief duration of the flaring events, resp. 14 and 20 minutes. Nonetheless, these flares were associated with coronal mass ejections (CME), but only the one from 21 September was thought to have an earth-directed component. Sure enough, a shock was recorded in the solar wind parameters on 24 September around 20 UTC (ACE - https://www.swpc.noaa.gov/products/ace-real-time-solar-wind ; see image underneath). The shock can be clearly seen as a step-like structure in the solar wind density (orange curve), speed (yellow curve) and temperature (green). The intensity of the interplanetary magnetic field reached 34 nT (SIDC - https://www.sidc.be/index.php ), with the north-south component Bz reaching a good -27 nT, one of the strongest so far this solar cycle. There is a possibility that there was some interaction with a faster CME from 22 September, but the jury is still out on this one. It might explain why the solar wind disturbance was somewhat stronger than expected.
However, the ensuing geomagnetic storm reached only 6- on the Kp-scale (NOAA - https://www.swpc.noaa.gov/products/planetary-k-index ), which is a moderate storm. Locally in Dourbes Belgium (K_BEL - http://ionosphere.meteo.be/geomagnetism/K_BEL/ ), the storm reached only minor storming levels, and the provisional Disturbance storm-time index got only -66 nT (Kyoto WDC - https://wdc.kugi.kyoto-u.ac.jp/index.html ). Compare that to the whopping -212 nT during the severe geomagnetic storm from last April, as described in the STCE newsitem at https://www.stce.be/news/642/welcome.html ! Despite the relatively weak storm, reports are pouring in that red aurora have been observed and photographed from the north of Belgium, the Netherlands, South-England and France (Burgundy). All observers mentioned the briefness and brightness of the event (only a few minutes), and not everybody was able to visually see the red hues (sources: https://www.spaceweather.com/ and HLN - https://www.hln.be/wetenschap-en-planeet/ ).
Review of space weather
Solar Active Regions (ARs) and flares
There were 22 active regions visible this week (NOAA ARs 3424 to 3446). They all had relatively simple alpha or beta magnetic field configuration, except for NOAA AR 3435 (beta-delta), 3436 (beta-gamma), 3438 (beta-gamma), 3441 (beta-gamma), 3442 (beta-gamma), 3443 (beta-gamma) and 3445 (beta-delta). There were 10 M-class flares during the week, from NOAA AR 3435, 3443, 3436 and 3445. The strongest was an M8.7 from NOAA AR 3435, peaking at 12:54 UTC on 21 September.
Coronal mass ejections
There were numerous CMEs per day. In particular, five CMEs with a possible Earth directed component were observed on 17 September 13:25 UTC, 18 September 11:12 UTC, 20 September 14:10 UTC, 21 September 13:36 UTC and 22 September 02:24 UTC (all times referred to the first image of the CME visible in LASCO-C2).
Coronal Holes
Several small coronal holes were visible during the week, but none of them were significant.
Electron fluxes at GEO
The greater than 2 MeV electron flux was fluctuating above and below the 1000 pfu threshold, as measured by GOES 16. The 24 hour electron fluence was at moderate levels.
Solar wind at L1
The solar wind was dominated by the ICMEs. Two of them reached the L1 point on 18 September (the corresponding CMEs were from the previous week, on 14 and 16 September), preceded by a shock. The interplanetary magnetic field increased to 22 nT then, with Bz down to -17nT and the solar wind speed reaching 690 km/s (probably mixed with the influence of the high speed solar wind from small coronal holes). Then the conditions returned to a slow solar wind regime, until 24 September when the shock and ICME corresponding to the CMEs of 21 and 22 September arrived to the Earth, causing the interplanetary magnetic field to increase to 33 nT and Bz down to -27nT, the solar wind speed reached 490 km/s.
Geomagnetism
Geomagnetic conditions reached major storm levels globally (Kp 7) and minor storm levels locally (K_Bel 5) during the arrival of ICMEs on 19 September. The geomagnetic conditions were then mostly unsettled the rest of the week until the arrival of the shock and ICME on 24 September, when globally the moderate storm level (Kp 6) and locally the minor storm level (K_Bel 5) was reached.
Proton flux levels near Earth
the 10 MeV GOES proton flux was below the threshold throughout the week.
PROBA2 Observations (18 Sep 2023 - 24 Sep 2023)
Solar Activity
Solar flare activity fluctuated from low to moderate during the week.
In order to view the activity of this week in more detail, we suggest to go to the following website from which all the daily (normal and difference) movies can be accessed: https://proba2.oma.be/ssa
This page also lists the recorded flaring events.
A weekly overview movie (SWAP week 704) can be found here: https://proba2.sidc.be/swap/data/mpg/movies/weekly_movies/weekly_movie_2023_09_18.mp4.
Details about some of this week's events can be found further below.
If any of the linked movies are unavailable they can be found in the P2SC movie repository here: https://proba2.oma.be/swap/data/mpg/movies/.
Thursday September 21
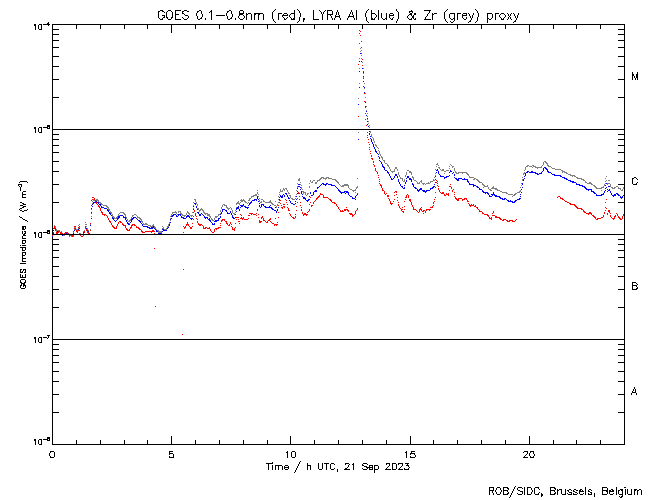
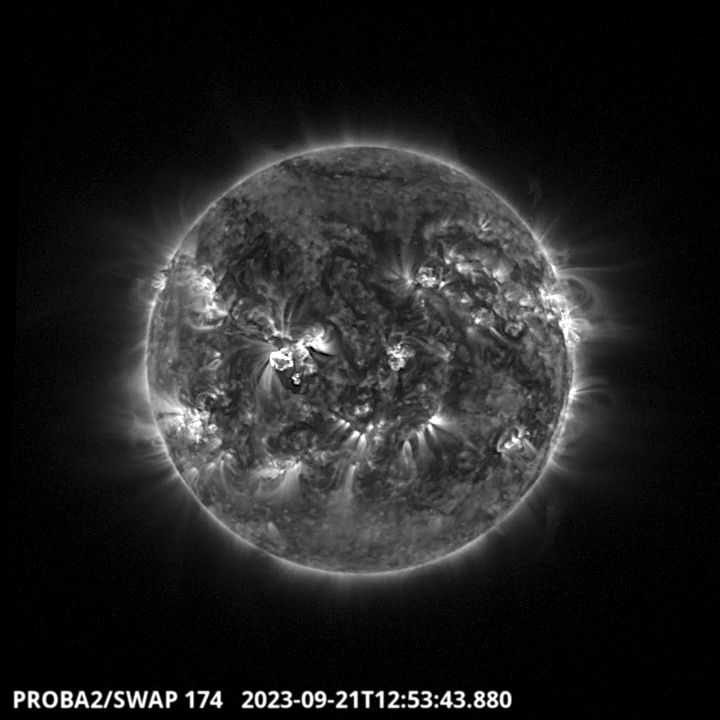
The largest flare of this week, an M8.7, was observed by LYRA (top panel) and SWAP (bottom panel). The flare peaked on 2023-Sep-21 at 12:54 UT. It occurred close to the Sun center, originating from NOAA AR3435, and it was associated with a front-sided geo-effective CME.
Find a SWAP movie of the event here: https://proba2.sidc.be/swap/movies/20230921_swap_movie.mp4.
Noticeable Solar Events
| DAY | BEGIN | MAX | END | LOC | XRAY | OP | 10CM | TYPE | Cat | NOAA |
| 19 | 0345 | 0355 | 0401 | M1.1 | F | II/2 | 70 | 3435 | ||
| 19 | 0923 | 0938 | 0944 | M1.8 | 70 | 3435 | ||||
| 19 | 2001 | 2014 | 2021 | M4.0 | 70 | 3435 | ||||
| 20 | 1411 | 1419 | 1425 | M8.2 | 70 | 3435 | ||||
| 21 | 1242 | 1254 | 1302 | M8.7 | 70 | 3435 | ||||
| 22 | 0225 | 0336 | 0656 | M1.2 | F | 70 | 3435 | |||
| 22 | 1553 | 1623 | 1646 | M1.4 | 73 | 3443 | ||||
| 22 | 1706 | 1715 | 1720 | M1.5 | III/2 | 73 | 3443 | |||
| 22 | 2225 | 2300 | 2313 | N2W3 | M1.9 | SF | III/2 | 73 | 3443 | |
| 23 | 2014 | 2043 | 2100 | M1.5 | 3436 | |||||
| 24 | 0317 | 0328 | 0336 | S12E22 | M4.4 | 1N | 77 | 3445 | ||
| 24 | 1451 | 1500 | 1505 | M1.0 | III/2II/1 | 73 | 3443 |
| LOC: approximate heliographic location | TYPE: radio burst type |
| XRAY: X-ray flare class | Cat: Catania sunspot group number |
| OP: optical flare class | NOAA: NOAA active region number |
| 10CM: peak 10 cm radio flux |
International Sunspot Number by SILSO
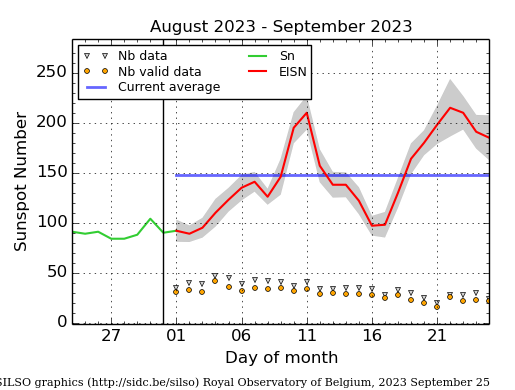
The daily Estimated International Sunspot Number (EISN, red curve with shaded error) derived by a simplified method from real-time data from the worldwide SILSO network. It extends the official Sunspot Number from the full processing of the preceding month (green line), a few days more than one solar rotation. The horizontal blue line shows the current monthly average. The yellow dots give the number of stations that provided valid data. Valid data are used to calculate the EISN. The triangle gives the number of stations providing data. When a triangle and a yellow dot coincide, it means that all the data is used to calculate the EISN of that day.
Geomagnetic Observations in Belgium
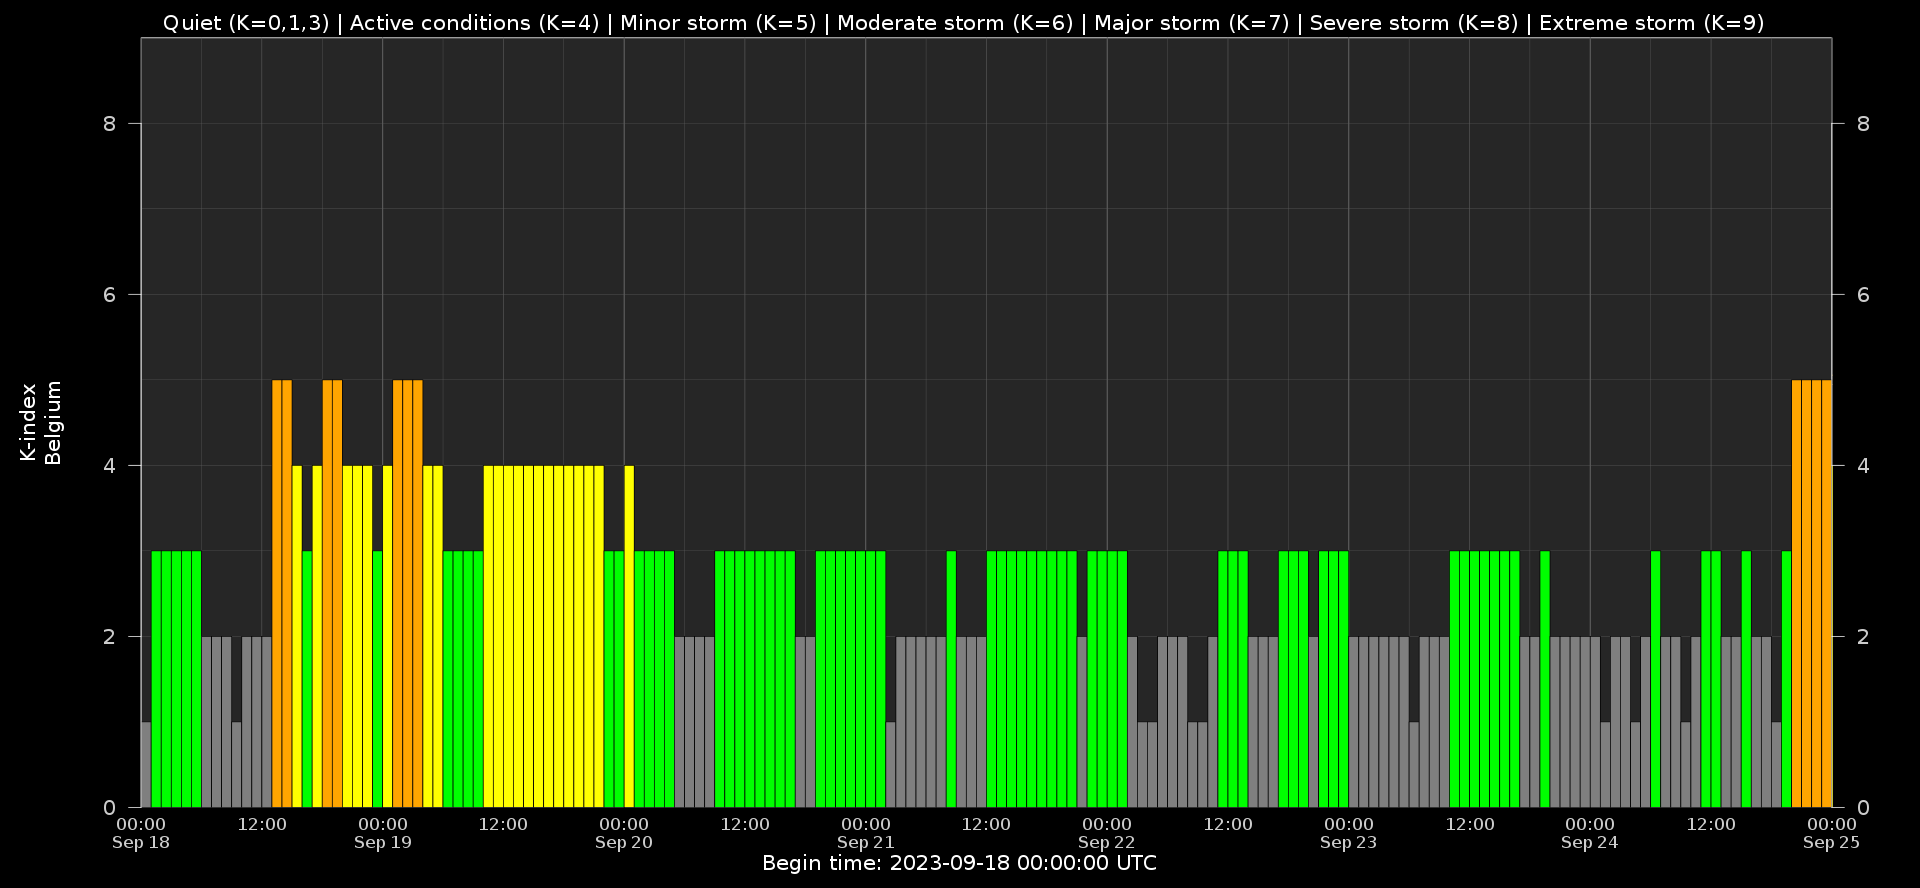
Local K-type magnetic activity index for Belgium based on data from Dourbes (DOU) and Manhay (MAB). Comparing the data from both measurement stations allows to reliably remove outliers from the magnetic data. At the same time the operational service availability is improved: whenever data from one observatory is not available, the single-station index obtained from the other can be used as a fallback system.
Both the two-station index and the single station indices are available here: http://ionosphere.meteo.be/geomagnetism/K_BEL/
Review of Ionospheric Activity
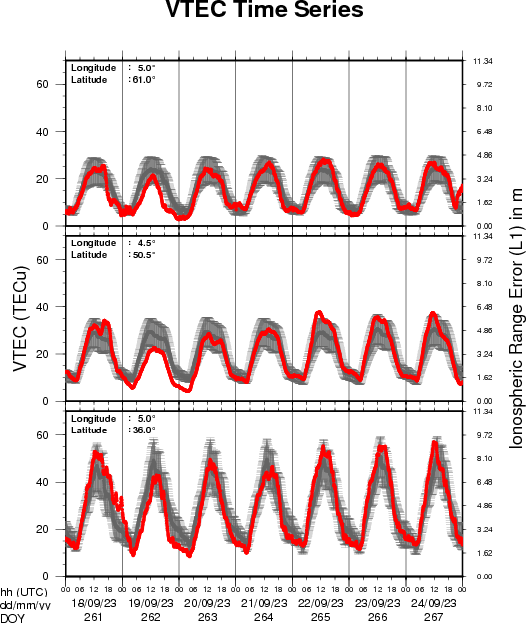
The figure shows the time evolution of the Vertical Total Electron Content (VTEC) (in red) during the last week at three locations:
a) in the northern part of Europe(N 61deg E 5deg)
b) above Brussels(N 50.5deg, E 4.5 deg)
c) in the southern part of Europe(N 36 deg, E 5deg)
This figure also shows (in grey) the normal ionospheric behaviour expected based on the median VTEC from the 15 previous days.
The VTEC is expressed in TECu (with TECu=10^16 electrons per square meter) and is directly related to the signal propagation delay due to the ionosphere (in figure: delay on GPS L1 frequency).
The Sun's radiation ionizes the Earth's upper atmosphere, the ionosphere, located from about 60km to 1000km above the Earth's surface.The ionization process in the ionosphere produces ions and free electrons. These electrons perturb the propagation of the GNSS (Global Navigation Satellite System) signals by inducing a so-called ionospheric delay.
See http://stce.be/newsletter/GNSS_final.pdf for some more explanations ; for detailed information, see http://gnss.be/ionosphere_tutorial.php
The SIDC Space Weather Briefing
The Space Weather Briefing presented by the forecaster on duty from Sept 17 to 24. It reflects in images and graphs what is written in the Solar and Geomagnetic Activity report: https://www.stce.be/briefings/20230925_SWbriefing.pdf
If you need to access the movies, contact us: stce_coordination at stce.be
Activities at the STCE
Check out our activity calendar: activities and encounters with the Sun-Space-Earth system and Space Weather as the main theme. We provide occasions to get submerged in our world through educational, informative and instructive activities.
If you want your event in our calendar, contact us: stce_coordination at stce.be
* Oct 12, E-SWAN Sustainability webinar: Going beyond the �old normal� for a sustainable future in science, online
* Oct 19, E-SWAN Sustainability webinar: The Space Sustainability Paradox - What is space sustainability and how can it be achieved?, online
* Nov 18-19, E-SWAN Space Weather School: data, models and services, by the STCE, Toulouse, France
* Dec 4-6, STCE course: Space Weather impacts on ionospheric wave propagation - focus on GNSS and HF, Brussels, Belgium - Registrations are open
* Jan 22-24, 2024, STCE Space Weather Introductory Course, Brussels, Belgium - Registrations are open
* Jan 25, 2024, post-Space Weather Introductory Course, by JMG and MeteoWing, place TBD - registration is included in the Jan SWIC
Check: https://www.stce.be/calendar