- Table of Content
- 1.Vote for Chris...
- 2.The Locarno di...
- 3.PROBA2 Observa...
- 4.Review of spac...
- 5.The SIDC Space...
- 6.International ...
- 7.Noticeable Sol...
- 8.Geomagnetic Ob...
- 9.Review of Iono...
- 10.STCE calendar
2. The Locarno digitization project
3. PROBA2 Observations (2 Oct 2023 - 8 Oct 2023)
4. Review of space weather
5. The SIDC Space Weather Briefing
6. International Sunspot Number by SILSO
7. Noticeable Solar Events
8. Geomagnetic Observations in Belgium
9. Review of Ionospheric Activity
10. STCE calendar
Vote for Christine!
Christine Verbeke makes it to the final round of the Flemish PHD Cup 2023
Christine Verbeke, who until recently worked at STCE's space weather prediction center, is competing in the final of the Flemish PhD Cup (https://phdcup.be/).
In this contest, new PhD's have to present their research and convince a jury in less than 3 minutes. The final can be followed through a live stream by VRTmax on October 19, 2023 at 19:00. Christine will present her work on the modelling of solar storms, which resulted in a more precise estimate of the arrival time and the intensity of such events. Thanks to her research the accuracy of the space weather predictions that are made daily at ROB will continue to improve.
In addition, the PhD Cup contest also has a public prize, in which anyone can vote for one of the eight finalists. For this public prize, the chosen finalists present their research in a very short pitch. Christine's video, titled "Gevaar uit de ruimte" (Danger from space), talks about space weather and the dangers coming from the Sun.
The clip can be found here: https://youtu.be/eoUjbSQUPnA
The winner of the public prize will get a publication in the popular science magazine EOS Magazine. Voting is allowed until October 19, 2023 at 17:00. Afterwards, the winner will be announced through the PhD Cup media channels.
Cast your vote here: https://phdcup.be/publieksprijs
Good luck and congratulations to Christine!

The Locarno digitization project
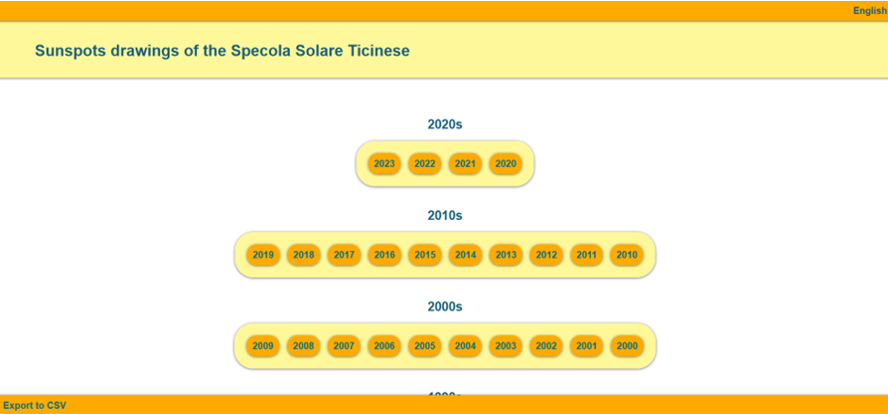
The Specola Solare Ticinese (SST), which is the pilot station of the SILSO network (https://www.sidc.be/SILSO/home ), completed a 5 years project for the digitization and safe archiving of the sunspot observations and data collected at the Specola Solare Ticinese in Locarno : https://doi.org/10.5281/zenodo.8117331. In addition, SST and IRSOL (https://www.irsol.usi.ch/?noredirect=en_US) also developed an interactive web interface to look at these data, located at https://sunspots.irsol.usi.ch/db/ A screenshot of this webpage is shown underneath.
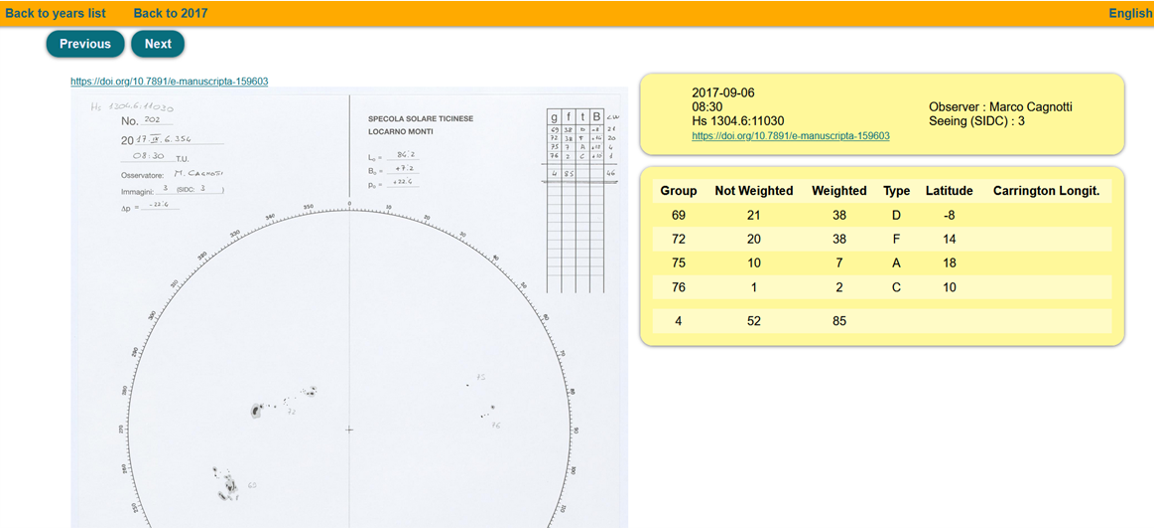
The database contains data for each sunspot group observed and recorded at the Specola Solare Ticinese from 1 June 1957 until 2022, and daily updated since. Recorded for each group are the date and time of observation, a code for the observer, the sky quality during the observation, the incremental group number, the weighted sunspot count, the unweighted sunspot count (if available), the Zurich classification, the latitude and longitude determined with DigiSun (a free software developed by SILSO for measuring and recording sunspot group features) or, if these are not available, the latitude and longitude determined manually with the Stonyhurst solar disk, the ETH Zurich signature, and the DOI code of the drawing (Digital Object Identifier). Further details can be found on the aforementioned Zenodo website. Underneath an example combining the SST drawing with the extracted data for 6 September 2017.
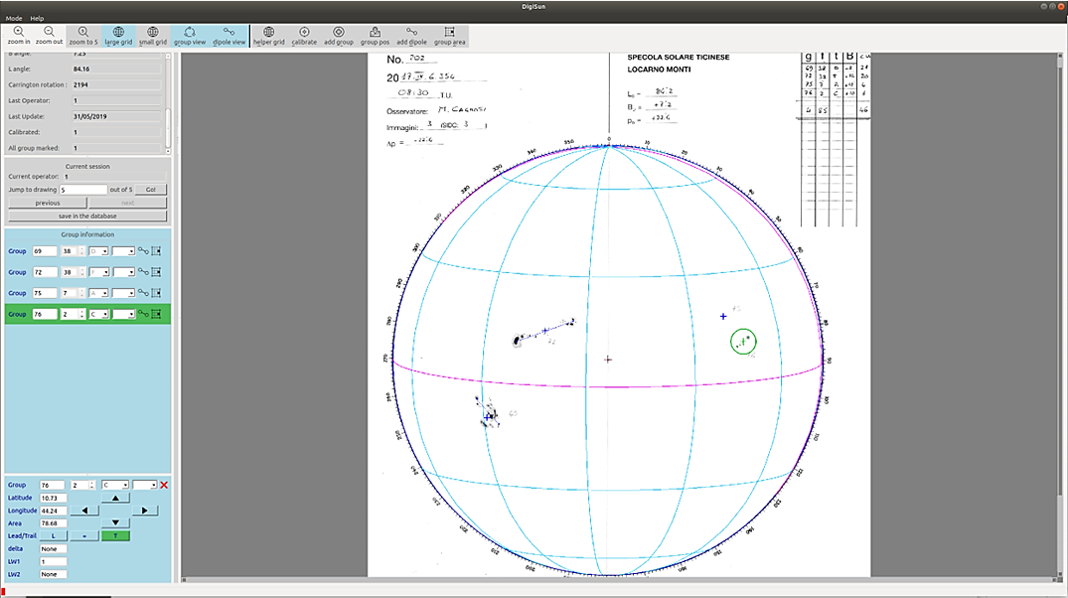
DigiSun is a semi-automatic software developed at the Royal Observatory of Belgium (https://www.astro.oma.be/en/ ; ROB/SILSO/USET) to measure parameters from sunspot drawings. The software was recently rewritten in Python with new functionalities such as the sunspot group area measurement. One of the strengths and the originality of the software is its ability to handle different drawing formats and hence to analyse drawings from other collections. By sharing the software with different observatories, the goal is to achieve a better homogenization of sunspot drawing data. This would ease the merge of data from different collections to fill the inevitable data gaps at one single station and to extend collections back into the past. A first international collaboration with the Specola Observatory in Locarno was initiated in 2019. Since then the DigiSun software is used on a daily basis for the processing of the new observations at Specola and it was used to analyse the whole collection since 1957. Underneath screenshot shows the DigiSun software at work with the Locarno drawing of 6 September 2017. That day, the strongest flare of the entire solar cycle 24 was produced by the sunspot group labeled here as number 69.
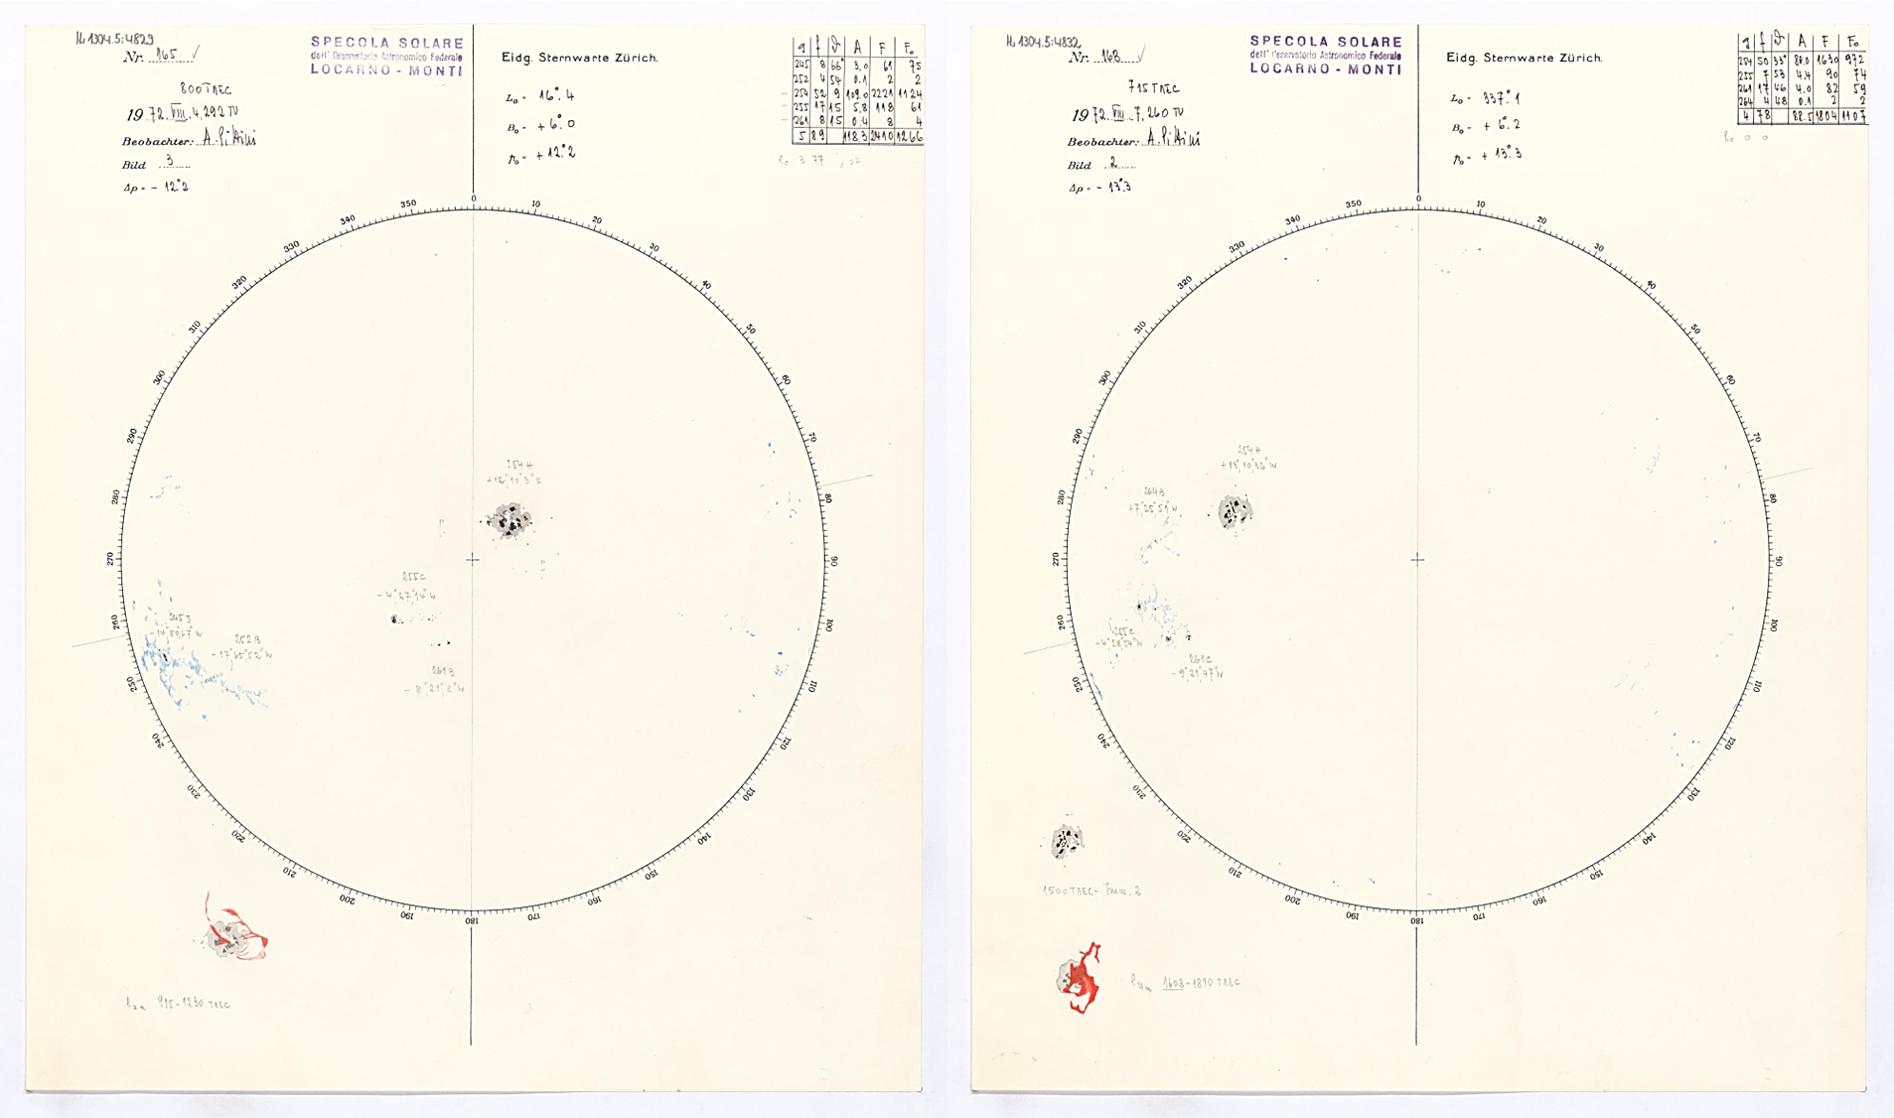
The two drawings underneath were made on 4 and 7 August 1972 and illustrate what a treasure trove the digitized Locarno archive truly is. The complex sunspot group that is present on the solar disk (number 254) was responsible for important flaring activity and related space weather effects on 4 August (the "Apollo" storm - Knipp et al. 2018 - https://doi.org/10.1029/2018SW002024 ) and the famous "Seahorse" flare on 7 August (NASA/MSFC/BBSO - https://en.m.wikipedia.org/wiki/File:Seahorse_flare.jpg ). The observers for those 2 days added in the lower left corner also detailed drawings in white light and H-alpha (a line in the red portion of the solar spectrum at 656.3 nm) of the eruptive activity they observed over the region number 254. The 4 August detail shows the gradually weakening flare ribbons associated with the strong eruption that peaked barely 2 hours earlier at 06:21 UTC. The 7 August detail captures the major flare (peaking at 15:28 UTC, and estimated X9 or X10 by NOAA space weather forecasters at that time) in progress.
This STCE newsitem has been written in collaboration with Sabrina Bechet (SILSO/USET).
PROBA2 Observations (2 Oct 2023 - 8 Oct 2023)
Solar Activity
Solar flare activity fluctuated from low to moderate during the week.
In order to view the activity of this week in more detail, we suggest to go to the following website from which all the daily (normal and difference) movies can be accessed: https://proba2.oma.be/ssa
This page also lists the recorded flaring events.
A weekly overview movie (SWAP week 706) can be found here: https://proba2.sidc.be/swap/data/mpg/movies/weekly_movies/weekly_movie_2023_10_02.mp4.
Details about some of this week's events can be found further below.
If any of the linked movies are unavailable they can be found in the P2SC movie repository here: https://proba2.oma.be/swap/data/mpg/movies/.
Monday October 02
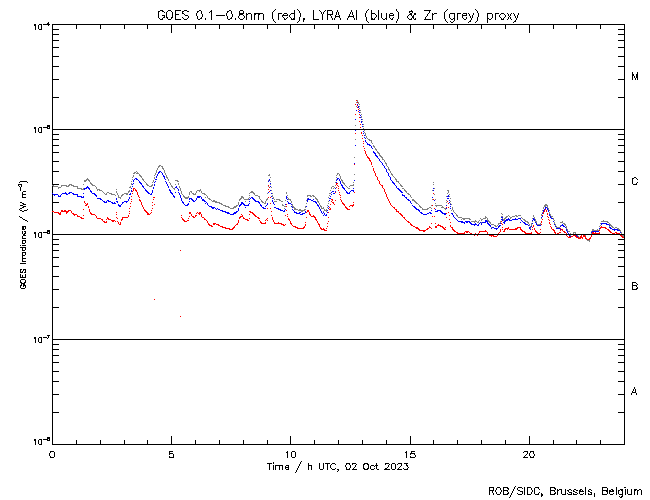
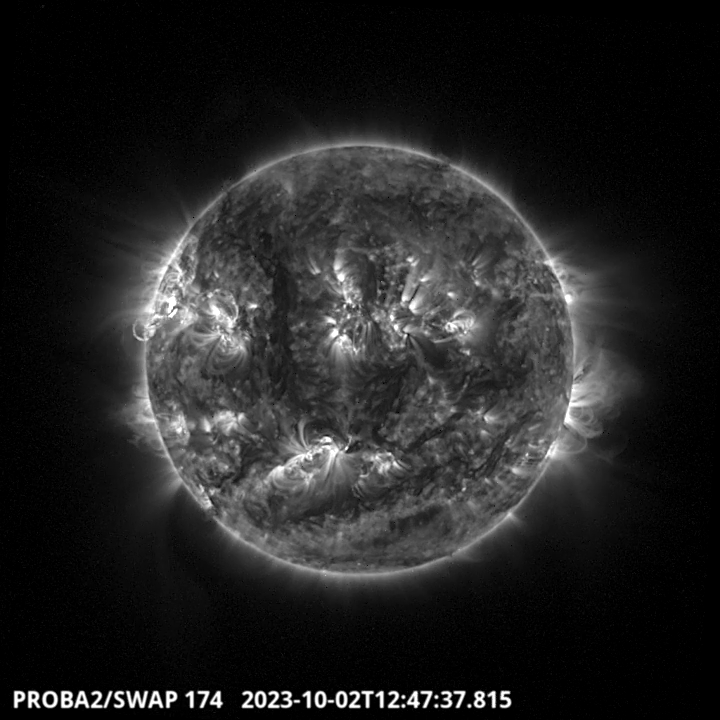
The largest flare of this week, an M1.9, was observed by LYRA (top panel) and SWAP (bottom panel). The flare peaked on 2023-Oct-02 at 12:46 UT. It occurred in the north-eastern hemisphere close to the solar limb, and it originated from NOAA AR3455.
Find a SWAP movie of the event here: https://proba2.sidc.be/swap/movies/20231002_swap_movie.mp4.
Review of space weather
Solar Active Regions (ARs) and flares
Solar flaring activity was moderate with two M-class flares and several C-class flares. An M2.5 flare was produced by NOAA AR 3451 with a peak time at 01:32 UTC on October 01, an M1.8 flare occurred in the NOAA Active Region 3460 with a peak time at 8:06 UTC on October 07.
Coronal mass ejections
A partial halo Coronal Mass Ejection (CME) was observed on the East limb at 11:36 UTC on October 03 with a projected speed of about 800 km/s. The analysis indicated that the source was on the back side, therefore no Earth impact was expected.
Another partial halo CME was observed on the West limb at 20:00 UTC on October 05 in the SOHO/LASCO images. The analysis indicated that the source of the CME also was on the back side. Therefore no impact on the solar wind condition near Earth was expected.
The C6.7-class flare peaking at 03:40 UTC on October 08 occurring in the NOAA Active Region 3460 was associate with a CME. This CME came into the SOHO/LASCO-C2 Field of View at 03:48 UTC. Based on the location of the active region and the trajectory of the CME, no impact on the Earth was expected.
Coronal Holes
Two small positive polarity coronal holes close to the equator reached the central meridian on October 01 and October 02. A large equatorial corona hole with a negative magnetic polarity reached the central meridian on October 08.
Proton flux levels
The greater than 10 MeV proton flux was at background levels.
Electron fluxes at GEO
The greater than 2 MeV electron flux measured by GOES-16 was below the 1000 pfu threshold. The 24h electron fluence was at normal levels.
Solar wind at L1
The solar wind conditions near Earth were slightly enhanced due to the effect of the solar wind streams associated with the 2 small positive polarity coronal holes that crossed the central meridian on October 01 and 02. The total interplanetary magnetic field (IMF) was ranging between 5.0 nT and 9.5 nT. The Bz-component of the IMF was mainly negative with a minimum of -7.9 nT. The solar wind varied between 288 km/s and 507 km/s. The phi-angle was mainly in the positive sector with an IMF directed away from the Sun.
Geomagnetism
In response to the solar wind streams associated to the 2 small positive polarity coronal holes, the geomagnetic conditions were unsettled with a minor storm on October 05 (K Bel 3, Kp-NOAA 5).
The SIDC Space Weather Briefing
The Space Weather Briefing presented by the forecaster on duty from Oct 1 to 8. It reflects in images and graphs what is written in the Solar and Geomagnetic Activity report: https://www.stce.be/briefings/20231009_SWbriefing.pdf
If you need to access the movies, contact us: stce_coordination at stce.be
International Sunspot Number by SILSO

The daily Estimated International Sunspot Number (EISN, red curve with shaded error) derived by a simplified method from real-time data from the worldwide SILSO network. It extends the official Sunspot Number from the full processing of the preceding month (green line), a few days more than one solar rotation. The horizontal blue line shows the current monthly average. The yellow dots give the number of stations that provided valid data. Valid data are used to calculate the EISN. The triangle gives the number of stations providing data. When a triangle and a yellow dot coincide, it means that all the data is used to calculate the EISN of that day.
Noticeable Solar Events
| DAY | BEGIN | MAX | END | LOC | XRAY | OP | 10CM | TYPE | Cat | NOAA |
| 02 | 1235 | 1246 | 1258 | N20E65 | M1.9 | 1N | VI/2CTM/1 | 3455 | ||
| 07 | 1757 | 1806 | 1810 | S10E39 | M1.7 | SB | III/1II/1 | 3460 |
| LOC: approximate heliographic location | TYPE: radio burst type |
| XRAY: X-ray flare class | Cat: Catania sunspot group number |
| OP: optical flare class | NOAA: NOAA active region number |
| 10CM: peak 10 cm radio flux |
Geomagnetic Observations in Belgium

Local K-type magnetic activity index for Belgium based on data from Dourbes (DOU) and Manhay (MAB). Comparing the data from both measurement stations allows to reliably remove outliers from the magnetic data. At the same time the operational service availability is improved: whenever data from one observatory is not available, the single-station index obtained from the other can be used as a fallback system.
Both the two-station index and the single station indices are available here: http://ionosphere.meteo.be/geomagnetism/K_BEL/
Review of Ionospheric Activity
NEW! The time series below illustrates (in green) the VTEC deviation from normal quiet behaviour.


VTEC time series at 3 locations in Europe from 2 Oct 2023 till 8 Oct 2023
The top figure shows the time evolution of the Vertical Total Electron Content (VTEC) (in red) during the last week at three locations:
a) in the northern part of Europe(N 61deg E 5deg)
b) above Brussels(N 50.5deg, E 4.5 deg)
c) in the southern part of Europe(N 36 deg, E 5deg)
This top figure also shows (in grey) the normal ionospheric behaviour expected based on the median VTEC from the 15 previous days.
The time series below shows the VTEC difference (in green) and relative difference (in blue) with respect to the median of the last 15 days in the North, Mid (above Brussels) and South of Europe. It thus illustrates the VTEC deviation from normal quiet behaviour.
The VTEC is expressed in TECu (with TECu=10^16 electrons per square meter) and is directly related to the signal propagation delay due to the ionosphere (in figure: delay on GPS L1 frequency).
The Sun's radiation ionizes the Earth's upper atmosphere, the ionosphere, located from about 60km to 1000km above the Earth's surface.The ionization process in the ionosphere produces ions and free electrons. These electrons perturb the propagation of the GNSS (Global Navigation Satellite System) signals by inducing a so-called ionospheric delay.
See http://stce.be/newsletter/GNSS_final.pdf for some more explanations ; for detailed information, see http://gnss.be/ionosphere_tutorial.php
STCE calendar
Check out our activity calendar: activities and encounters with the Sun-Space-Earth system and Space Weather as the main theme. We provide occasions to get submerged in our world through educational, informative and instructive activities.
If you want your event in our calendar, contact us: stce_coordination at stce.be
* Oct 12, E-SWAN Sustainability webinar: Going beyond the “old normal” for a sustainable future in science, online
* Oct 19, E-SWAN Sustainability webinar: The Space Sustainability Paradox - What is space sustainability and how can it be achieved?, online
* Oct 19, PhD cup finale, with finalist Christine Verbeke, ‘Gevaar uit de ruimte’, Brussels, Belgium and online
* Nov 18-19, E-SWAN Space Weather School: data, models and services, by the STCE, Toulouse, France
* Dec 4-6, STCE course: Space Weather impacts on ionospheric wave propagation - focus on GNSS and HF, Brussels, Belgium - Registrations are open
* Jan 22-24, 2024, STCE Space Weather Introductory Course, Brussels, Belgium - Registrations are open
* Jan 25, 2024, post-Space Weather Introductory Course, by JMG and MeteoWing, place TBD - registration is included in the Jan SWIC
Check: https://www.stce.be/calendar