- Table of Content
- 1.Plunging sunsp...
- 2.Review of spac...
- 3.The SIDC Space...
- 4.PROBA2 Observa...
- 5.International ...
- 6.Geomagnetic Ob...
- 7.Review of Iono...
- 8.Calendar
2. Review of space weather
3. The SIDC Space Weather Briefing
4. PROBA2 Observations (16 Oct 2023 - 22 Oct 2023)
5. International Sunspot Number by SILSO
6. Geomagnetic Observations in Belgium
7. Review of Ionospheric Activity
8. Calendar
Plunging sunspot numbers... or not?
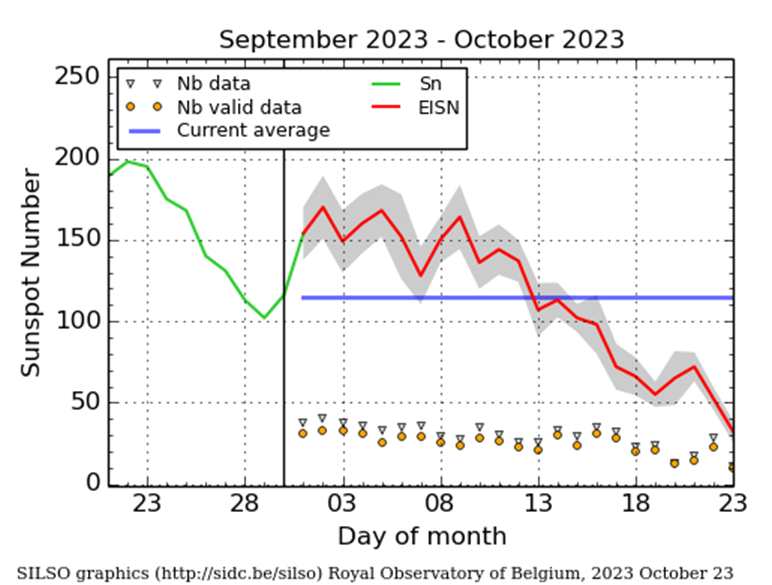
The estimated daily sunspot number (ROB/SILSO - https://www.sidc.be/SILSO/home ) continued to sharply decline this week. From values near 160 around 9 October, the sunspot number has dropped to values well below 50 by 23 October, barely 2 weeks later. Such low sunspot activity has not been recorded since early April this year and early December last year. The graph underneath shows the evolution of the daily estimated international sunspot number (EISN) as recorded by the observers from the SILSO network over the last month. It extends the official Sunspot Number from the full processing of the preceding month (green line), a few days more than one solar rotation. The horizontal blue line shows the current monthly average. The yellow dots give the number of stations that provided valid data. Only valid data are used to calculate the EISN. The triangle gives the number of stations providing data. When a triangle and a yellow dot coincide, it means that all the observations are used to calculate the EISN of that day.
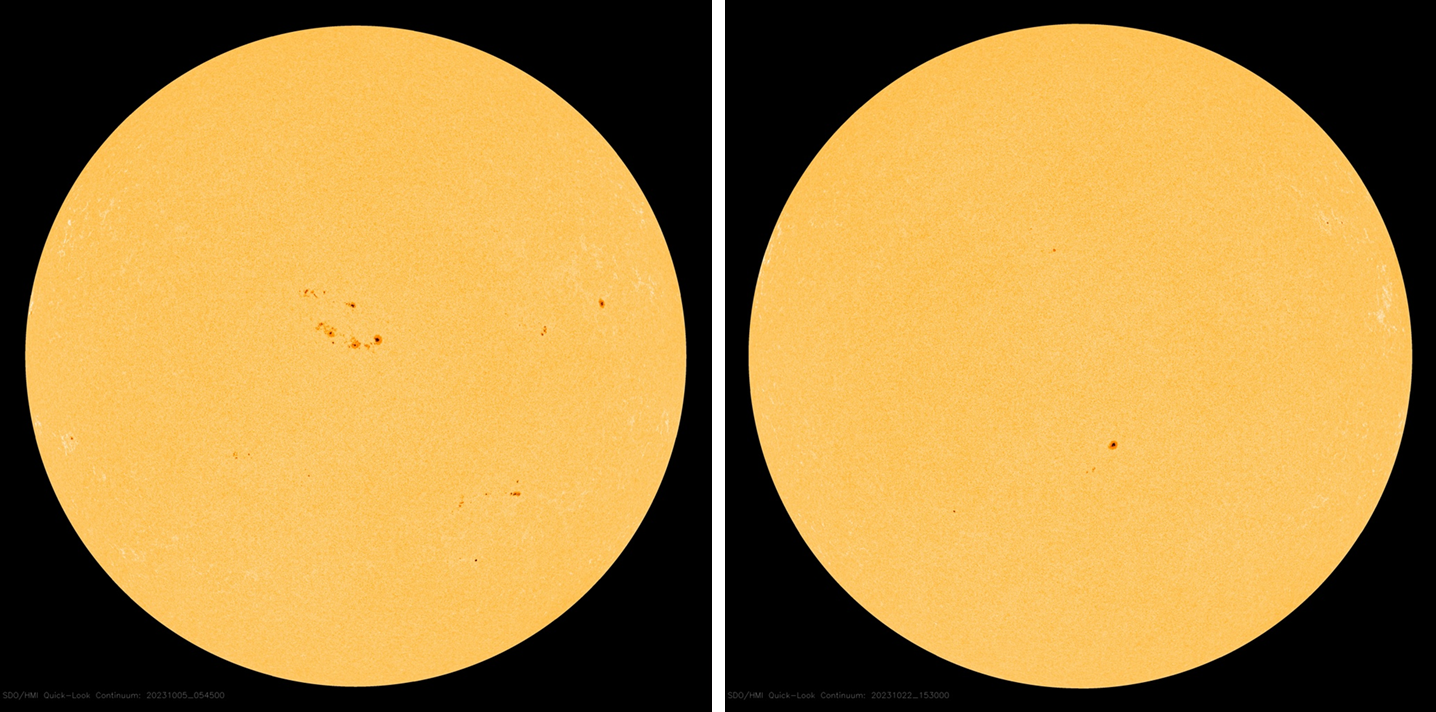
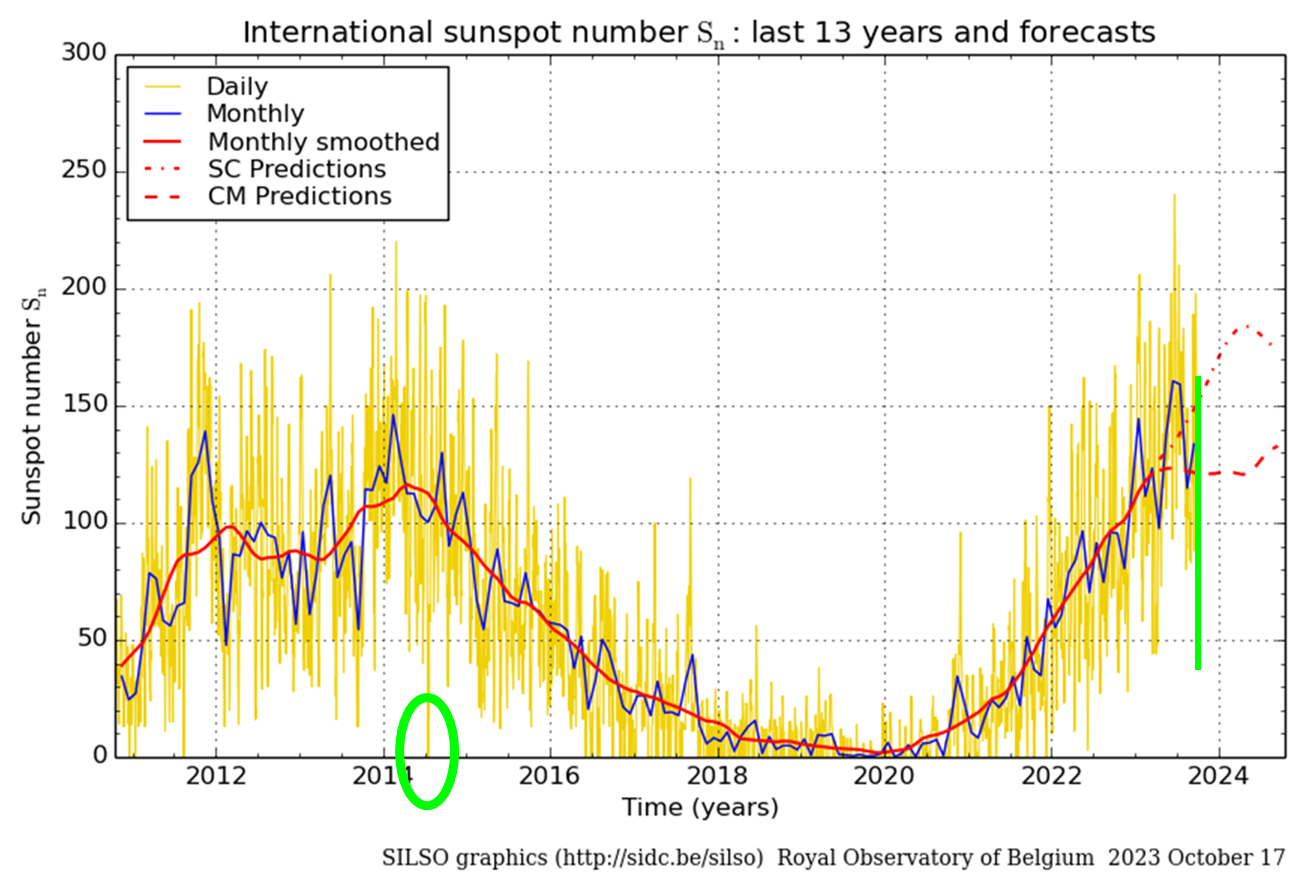
The images above were taken on 9 and 22 October by SDO/HMI (http://sdo.gsfc.nasa.gov/data/aiahmi/ ) and show the remarkable difference in appearance of the solar disk. The decline has also been noted in related parameters such as the sunspot area and the 10.7cm solar radio flux, both being at their lowest values since the start of the enhanced solar activity in December last year. So, have we passed the solar cycle maximum? Most likely not. The ups-and-downs in daily sunspot numbers are typical during the period of solar cycle maximum, such as e.g. during the previous solar cycle maximum when the daily sunspot number dropped from values close to 200 to 0 in barely 10 days (July 2014; see the STCE newsitem at https://www.stce.be/news/261/welcome.html ). Note the many sharp drops in the daily sunspot number during the entire maximum period of the previous solar cycle. It is one of the reasons why solar observers use monthly and smoothed monthly (see the SIDC formula at https://www.sidc.be/SILSO/faq6 ) sunspot numbers, to weed out as much as possible this erratic behaviour of the solar activity and to get as such a better view on its overall evolution. The SILSO map underneath shows the daily, monthly and monthly smoothed sunspot number for the previous and ongoing solar cycle. It has been annotated (in green) to highlight the spotless day in July 2014, and contains a sketch of the low sunspot numbers over the last 2 weeks. We're not done with this solar cycle yet!
Review of space weather
Solar Active Regions (ARs) and flares
Solar flaring activity was low. Ten (10) active regions were observed on the visible solar disk, most of these were relatively small and simple. The largest flare was an C9.8 flare, peaking at 16:06 UTC October 16. This flare originated from beyond the north east limb. On October 16, NOAA AR 3467 produced a C7.5 flare. Towards the end of the week solar activity decreased further and was very low by October 22.
Coronal mass ejections
Three (3) Coronal Mass Ejections (CMEs) were considered to have an Earth directed component.
The first, associated with the C7.5 flare from NOAA 3467, was mostly directed to the east but a wider shock was visible in SOHO/LASCO-C2 data from 11:48 UTC October 16.
The second CME, first observed from 05:17 UTC on October 17 in SOHO/LASCO-C2 to the south-west, was associated with the long duration C2 flare from NOAA3463.
The third was a faint CME directed to the south-east, visible in SOHO/LASCO-C2 data from 06:12 UTC October 18, and was associated with an eruption to the south-west of NOAA 3468.
A glancing blow at Earth of each of these CME's was predicted between October 20 and 22.
Coronal Holes
Two small negative polarity coronal holes, one near the equator, the other in the northern hemisphere, began to cross the central meridian on October 16 and 19, respectively. A small equatorial positive polarity coronal hole began to cross the central meridian on October 22.
Proton flux levels
The greater than 10 MeV GOES proton flux was at nominal levels.
Electron fluxes at GEO
The greater than 2 MeV electron flux was remained below the 1000 pfu threshold. The 24h electron fluence was at nominal levels.
Solar wind
At the start of the week, the solar wind speed decreased from 450 km/s on October 15 to around 300 km/s on October 17.
On October 18, the solar wind then increased again to around 460 km/s, likely associated with the high-speed stream associated with the positive polarity coronal hole, which crossed the central meridian on October 14. The interplanetary magnetic field (IMF) phi angle switched to the positive sector on October 18.
Between October 20 and 23, the solar wind parameters indicated ongoing weak transient magnetic structures, possibly associated to one or multiple CME glancing blows. The interplanetary magnetic field (IMF) ranged between 2 and 13nT. Bz had a minimum value of -9nT. Bz was negative for an extended period on October 21.
Geomagnetism
The geomagnetic conditions were mostly at quiet to active. There was a global minor storm (NOAA Kp 5) on October 21, due to the extended period of negative Bz.
The SIDC Space Weather Briefing
The Space Weather Briefing presented by the forecaster on duty from Oct 15 to 22. It reflects in images and graphs what is written in the Solar and Geomagnetic Activity report: https://www.stce.be/briefings/20231023_SWbriefing.pdf
If you need to access the movies, contact us: stce_coordination at stce.be
PROBA2 Observations (16 Oct 2023 - 22 Oct 2023)
Solar Activity
Solar flare activity fluctuated from very low to low during the week.
In order to view the activity of this week in more detail, we suggest to go to the following website from which all the daily (normal and difference) movies can be accessed: https://proba2.oma.be/ssa
This page also lists the recorded flaring events.
A weekly overview movie (SWAP week 708) can be found here: https://proba2.sidc.be/swap/data/mpg/movies/weekly_movies/weekly_movie_2023_10_16.mp4.
Details about some of this week's events can be found further below.
If any of the linked movies are unavailable they can be found in the P2SC movie repository here: https://proba2.oma.be/swap/data/mpg/movies/.
Monday October 16
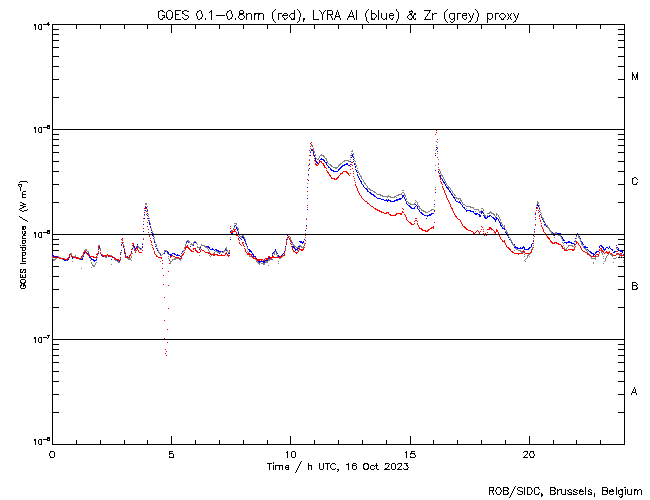
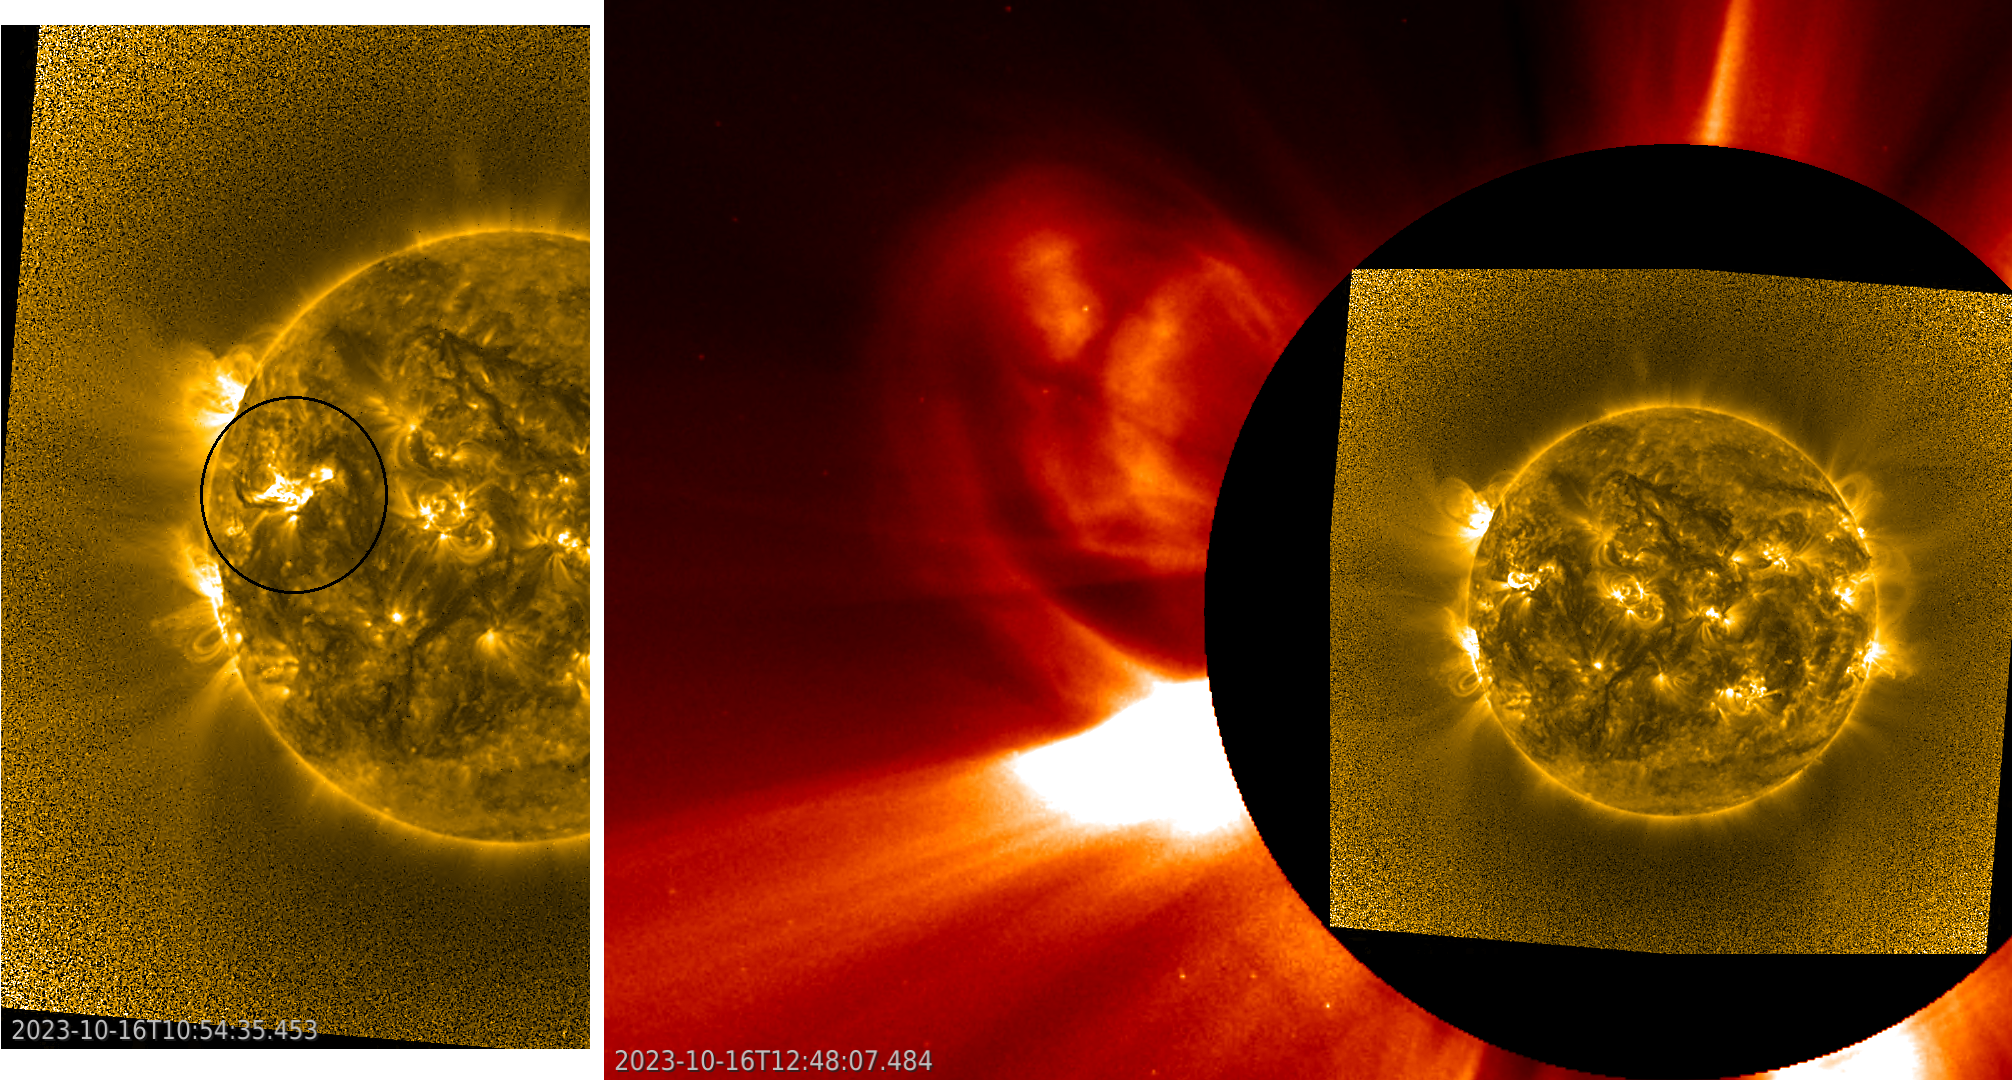
A filament eruption occurred on 2023-Oct-16 and originated from NOAA AR3467 located on the eastern hemisphere. The filament can be seen encircled in black in the SWAP image in the bottom left figure. The eruption was associated with a C7.5 flare, which peaked at 10:51 UT and can be seen in the LYRA curve in the top panel. The event was also correlated with an eastward CME which was captured by SOHO/LASCO C2 (entered the field of view at 11:48 UT) and can be seen in the bottom right composite image with SWAP in the center.
Find a SWAP movie of the event here: https://proba2.sidc.be/swap/movies/20231016_swap_movie.mp4.
International Sunspot Number by SILSO
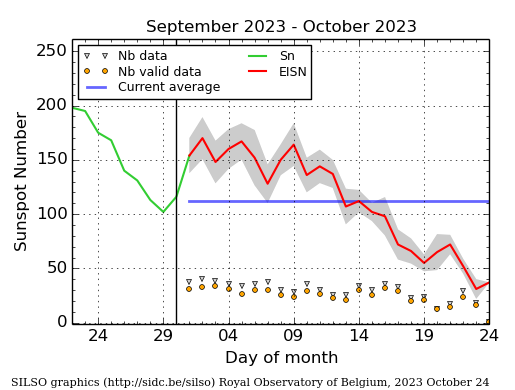
The daily Estimated International Sunspot Number (EISN, red curve with shaded error) derived by a simplified method from real-time data from the worldwide SILSO network. It extends the official Sunspot Number from the full processing of the preceding month (green line), a few days more than one solar rotation. The horizontal blue line shows the current monthly average. The yellow dots give the number of stations that provided valid data. Valid data are used to calculate the EISN. The triangle gives the number of stations providing data. When a triangle and a yellow dot coincide, it means that all the data is used to calculate the EISN of that day.
Geomagnetic Observations in Belgium
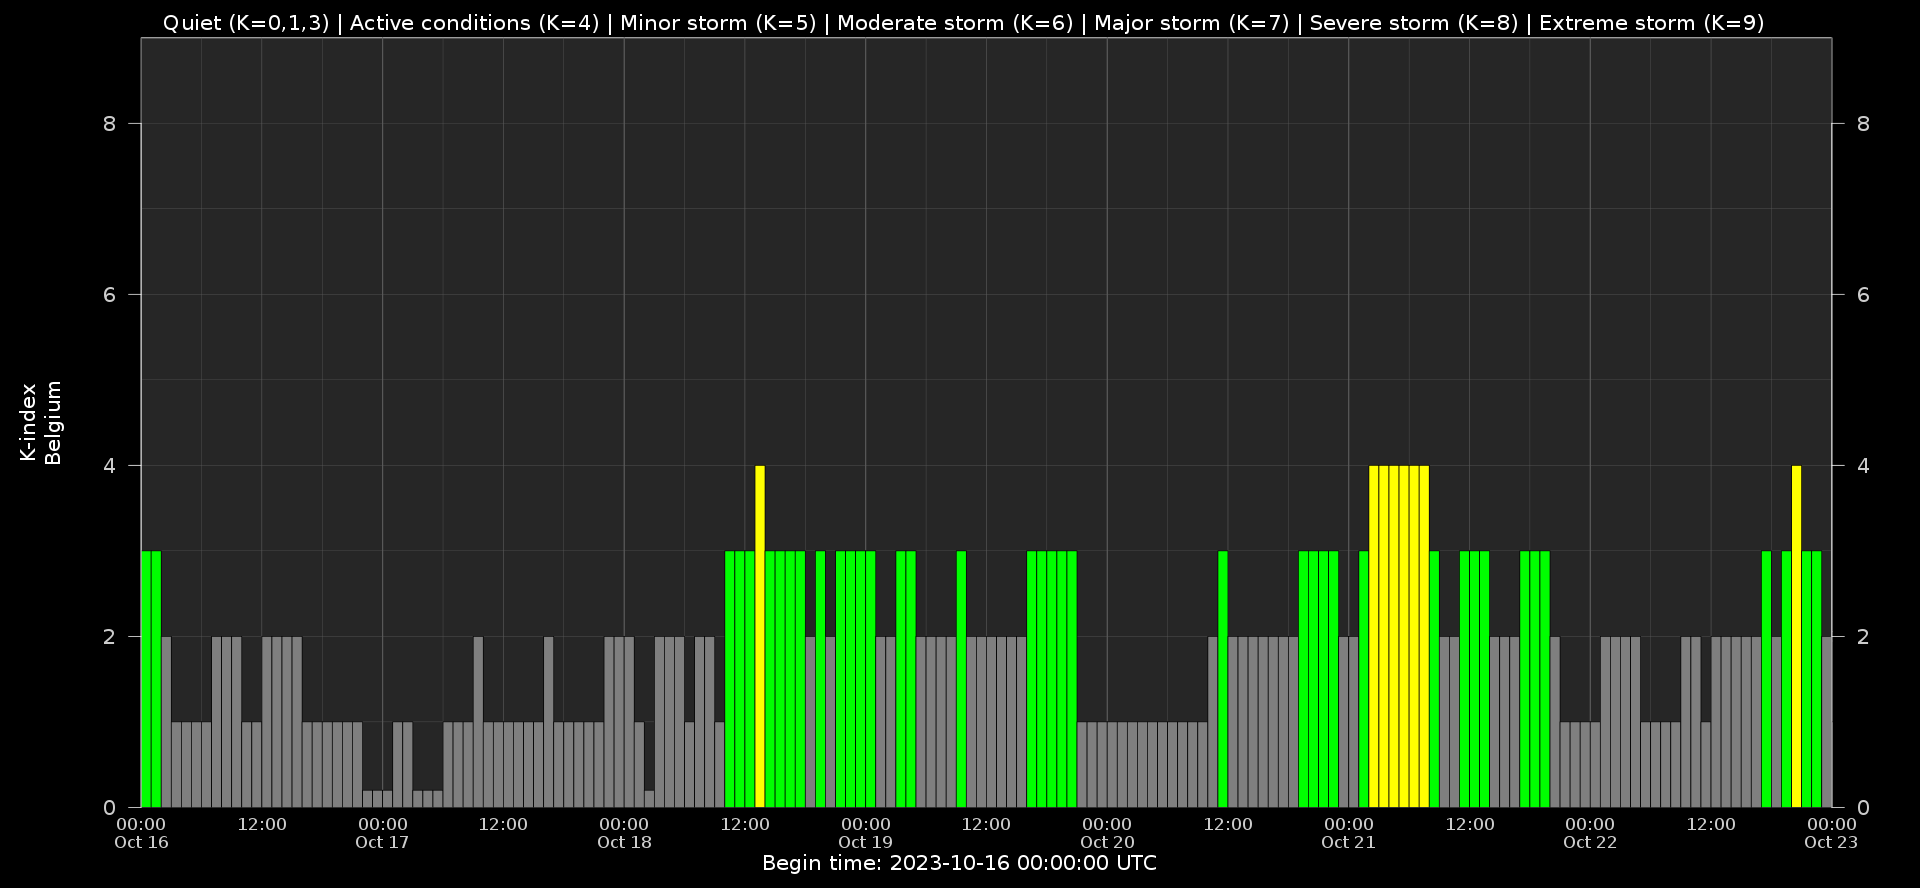
Local K-type magnetic activity index for Belgium based on data from Dourbes (DOU) and Manhay (MAB). Comparing the data from both measurement stations allows to reliably remove outliers from the magnetic data. At the same time the operational service availability is improved: whenever data from one observatory is not available, the single-station index obtained from the other can be used as a fallback system.
Both the two-station index and the single station indices are available here: http://ionosphere.meteo.be/geomagnetism/K_BEL/
Review of Ionospheric Activity
NEW! The time series below illustrates (in green) the VTEC deviation from normal quiet behaviour.
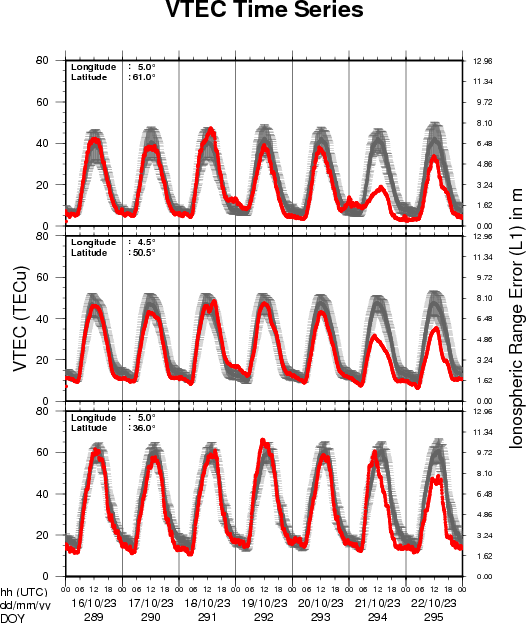

VTEC time series at 3 locations in Europe from 16 Oct 2023 till 22 Oct 2023
The top figure shows the time evolution of the Vertical Total Electron Content (VTEC) (in red) during the last week at three locations:
a) in the northern part of Europe(N 61deg E 5deg)
b) above Brussels(N 50.5deg, E 4.5 deg)
c) in the southern part of Europe(N 36 deg, E 5deg)
This top figure also shows (in grey) the normal ionospheric behaviour expected based on the median VTEC from the 15 previous days.
The time series below shows the VTEC difference (in green) and relative difference (in blue) with respect to the median of the last 15 days in the North, Mid (above Brussels) and South of Europe. It thus illustrates the VTEC deviation from normal quiet behaviour.
The VTEC is expressed in TECu (with TECu=10^16 electrons per square meter) and is directly related to the signal propagation delay due to the ionosphere (in figure: delay on GPS L1 frequency).
The Sun's radiation ionizes the Earth's upper atmosphere, the ionosphere, located from about 60km to 1000km above the Earth's surface.The ionization process in the ionosphere produces ions and free electrons. These electrons perturb the propagation of the GNSS (Global Navigation Satellite System) signals by inducing a so-called ionospheric delay.
See http://stce.be/newsletter/GNSS_final.pdf for some more explanations ; for detailed information, see http://gnss.be/ionosphere_tutorial.php
Calendar
Check out our activity calendar: activities and encounters with the Sun-Space-Earth system and Space Weather as the main theme. We provide occasions to get submerged in our world through educational, informative and instructive activities.
If you want your event in our calendar, contact us: stce_coordination at stce.be
* Nov 18-19, E-SWAN Space Weather School: data, models and services, by the STCE, Toulouse, France
* Nov 24, Webinar: Meet EPOS-BE, ROB, online
* Nov 26, STCE @ Dag van de Wetenschap, Planetarium, Brussels
* Dec 4-6, STCE course: Space Weather impacts on ionospheric wave propagation - focus on GNSS and HF, Brussels, Belgium - Registrations are open
* Jan 22-24, 2024, STCE Space Weather Introductory Course, Brussels, Belgium - Registrations are open
* Jan 25, 2024, post-Space Weather Introductory Course, by JMG and MeteoWing, place TBD - registration is included in the Jan SWIC
Check: https://www.stce.be/calendar