- Table of Content
- 1.Numerous sunsp...
- 2.Review of sola...
- 3.International ...
- 4.PROBA2 Observa...
- 5.Noticeable Sol...
- 6.Geomagnetic Ob...
- 7.Review of Iono...
- 8.The SIDC Space...
- 9.Activities at ...
2. Review of solar and geomagnetic activity
3. International Sunspot Number by SILSO
4. PROBA2 Observations
5. Noticeable Solar Events
6. Geomagnetic Observations in Belgium
7. Review of Ionospheric Activity
8. The SIDC Space Weather Briefing
9. Activities at the STCE
Numerous sunspots, few strong flares
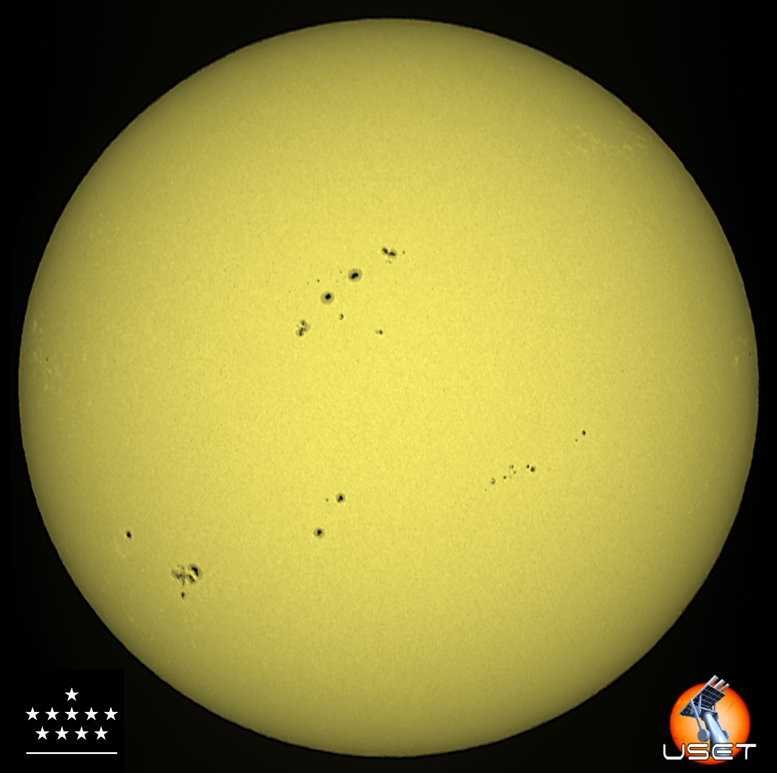
Starting on 18 November, a nest of sunspots started to round the Sun's northeast limb. It concerned a conglomerate of 5 sunspot groups cramped into an area of 15 by 20 degrees, as sardines in a can. This sunspot nest was then followed by a string of sunspot groups in the southern hemisphere nicely following one after the other. The white light image underneath was taken with the solar telescopes of the Royal Observatory of Belgium (ROB/USET - https://www.sidc.be/uset/ ) showing the solar disk on 23 November around noon.
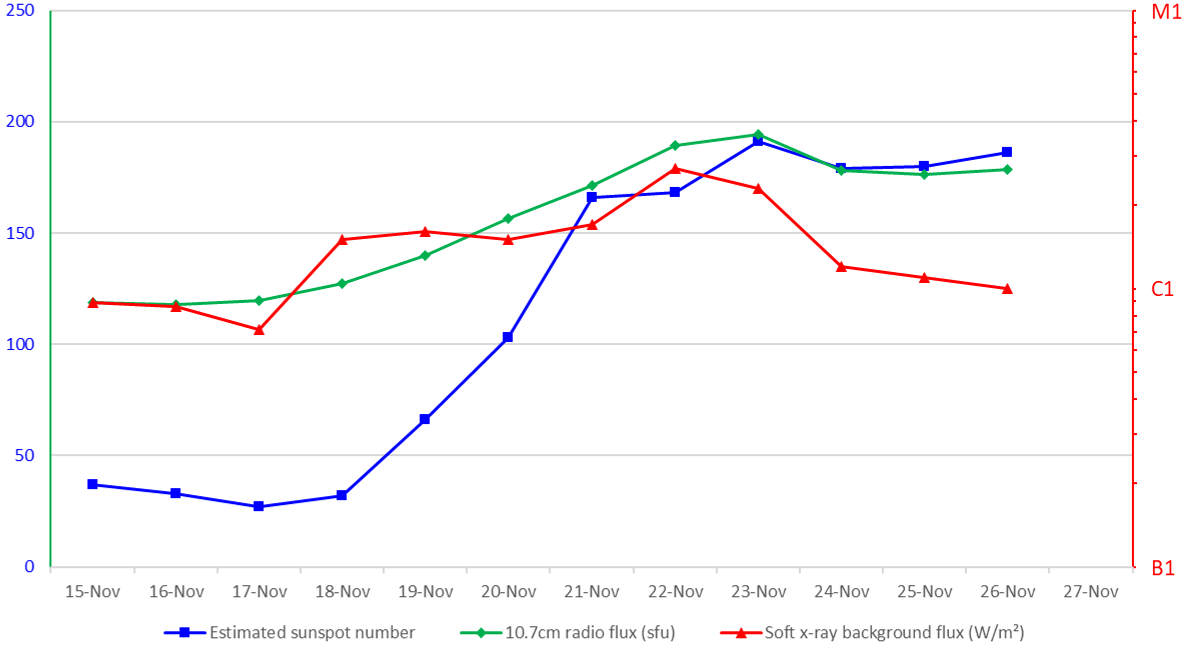
The daily estimated sunspot number (SILSO - https://www.sidc.be/SILSO/home ) increased from around 30 on 18 November to nearly 200 on 23 November, as shown by the blue curve in graph underneath. Its twin, the 10.7cm radio flux (https://www.spaceweather.gc.ca/forecast-prevision/solar-solaire/solarflux/sx-en.php ), followed suit and increased from its lowest value so far this year (118 sfu on 16 November, with sfu short for "solar flux unit") to a high 194 sfu on 23 November. The sharp increase was also recorded for other solar parameters, such as the average soft x-ray background solar flux which more than tripled in value in just a few days, from B7 to C2 (red curve; it uses the same scaling as solar flares). In other words, the entire Sun started to emit three times as much soft x-ray radiation than only a few days earlier.
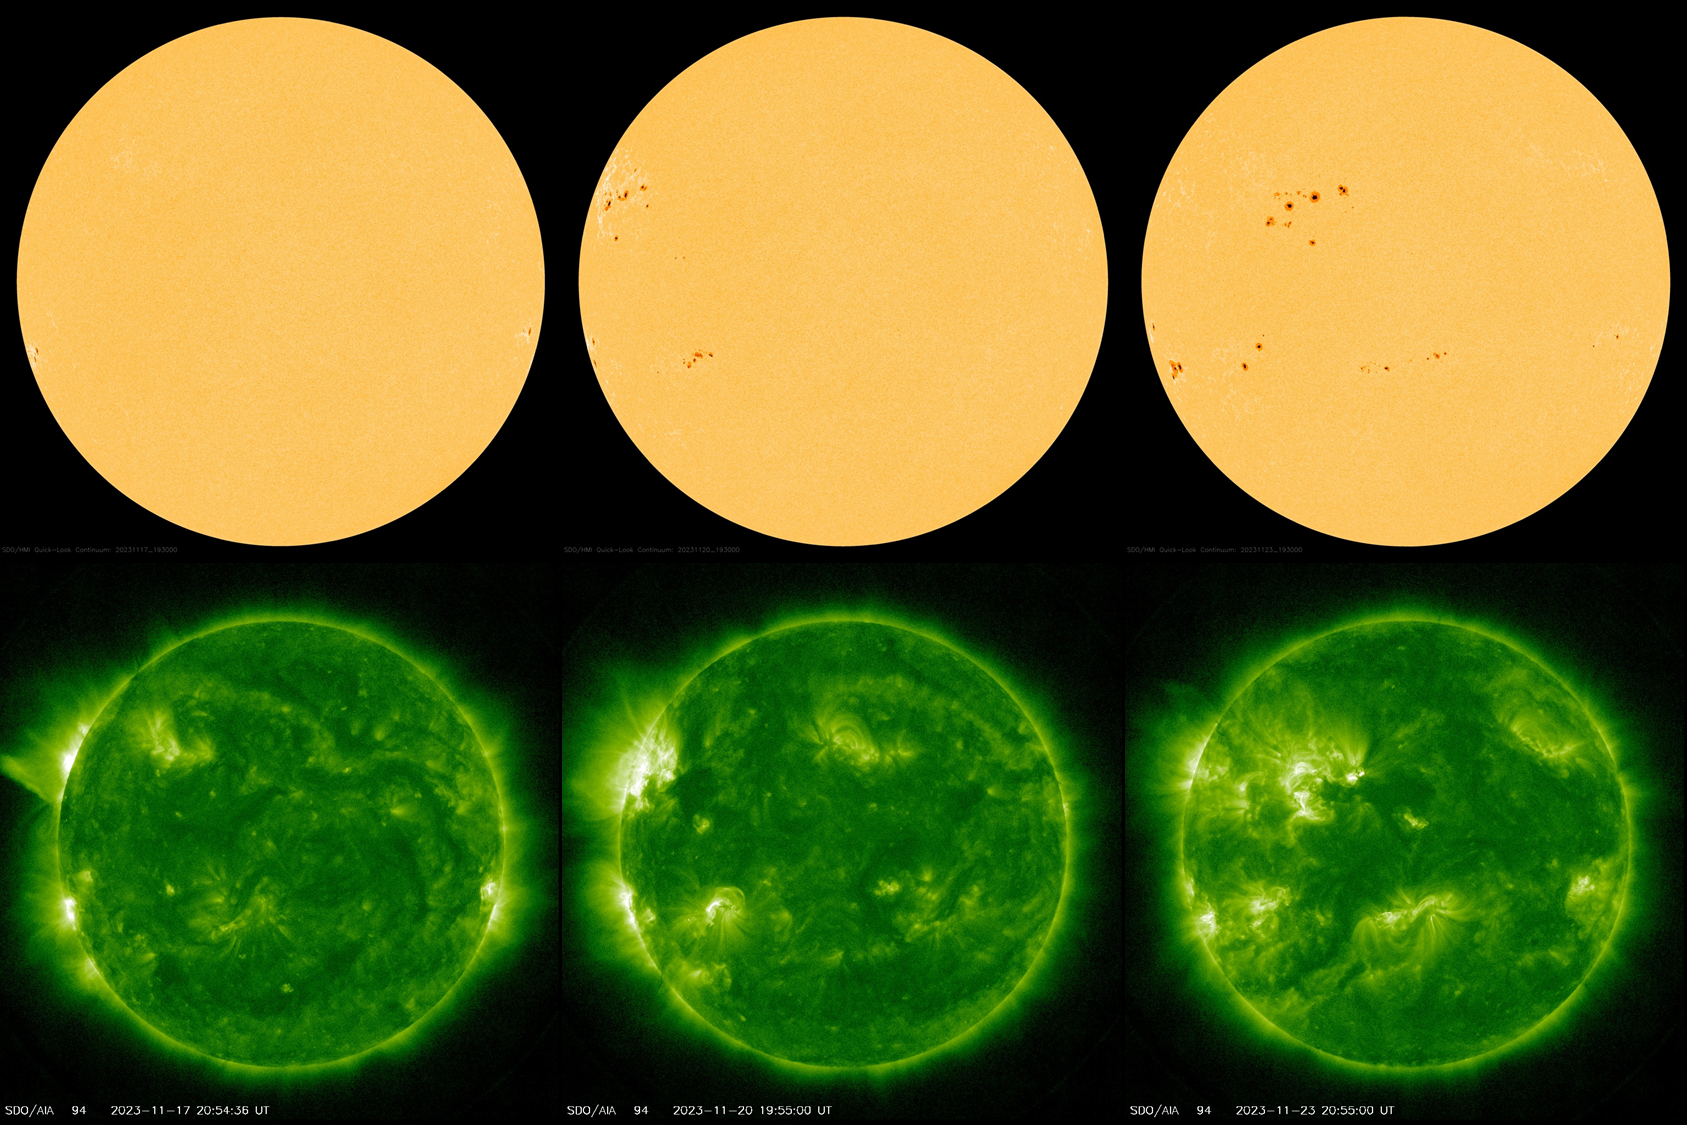
Extreme ultraviolet (EUV) images such as from SDO/AIA (http://sdo.gsfc.nasa.gov/data/aiahmi/ ), GOES/SUVI (https://www.swpc.noaa.gov/products/goes-solar-ultraviolet-imager-suvi ) and PROBA2/SWAP (https://proba2.sidc.be/ssa ) also showed an impressive facelift of the solar disk as the active regions gradually conquered the solar hemisphere visible from the Earth. This can be seen in the SDO images underneath. For 17, 20 and 23 November, white light (top row) and EUV (AIA094 filter, at multi-million degrees; bottom row) images show the change in outlook of the Sun as it evolves from a dim and quite featureless appearance into a complex disk with many bright active regions.
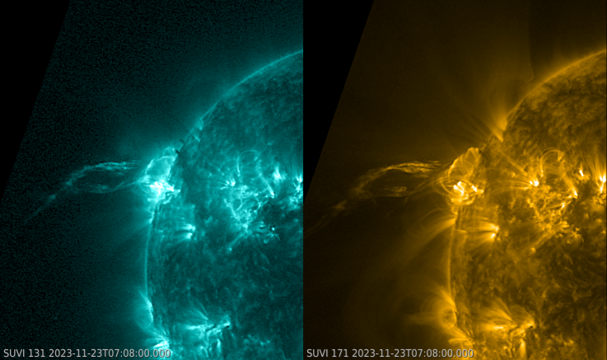
Despite all those sunspot groups, the flaring activity was limited to C-class flares and only 4 (four!) low-level M-class flares. The strongest one a was a long-duration M1.4 flare that peaked on 23 November at 03:38UTC. Its source was behind the northeast limb and as such not related to the sunspot nest that was already approaching the central meridian. The eruption apparently destabilized other areas on the Sun, resulting in the ejection (in two phases) of a filament at the northeast limb starting from around 05:30UTC onwards. A clip can be found in the online version of this newsitem currently at https://www.sidc.be/index.php It shows the Sun in multi-millions degrees (GOES/SUVI 131) on the left and at slightly "cooler" temperatures near 700.000 degrees (GOES/SUVI 171) on the right. The post-eruption coronal loops towered nearly 150.000 km above the solar limb, and the ejected filament material could be traced through the entire field of view of SUVI more than 450.000 km away from the Sun. Both the farside event as the filament eruption were associated with separate coronal mass ejections, but none of those had an earth-directed component.
Review of solar and geomagnetic activity
WEEK 1195 from 2023 Nov 20
Solar Active Regions and flares
There were 14 active regions (ARs) visible throughout the week (NOAA ARs 3489 to 3503). The majority of them had a simple alpha or beta magnetic field configuration at the start of the week, while more complex regions, such as NOAA AR 3500 (beta-gamma-delta), were visible during the second half of the week. Four M-class flares were measured. The strongest flare was an M1.5 from NOAA AR 3489, peaking at 03:38 UTC on 23 November.
Coronal mass ejections
Numerous CMEs per day occurred. Three of them had a slight chance of a glancing blow to Earth. A shock was observed in the solar wind parameters at 07:55 UTC on November 25, possibly from the CME seen in LASCO C2 at 06:48UT on November 22.
Coronal Holes
Four coronal holes were on-disk during the week, with two of them crossing central meridian on November 21 and 23, one with negative polarity at mid southern latitudes and an a mid northern latitudinal one with positive polarity.
Proton flux levels
The 10 MeV GOES proton flux was below threshold level the full week.
Electron fluxes at GEO
The greater than 2 MeV electron flux was below the 1000 pfu threshold, as measured by GOES 16 for the majority of the week, with exception November 24, when it crossed the 1000 pfu threshold.
The 24 hour electron fluence was at normal levels.
Solar wind
At the start of the the week transient features and influences from the high latitudes northern coronal holes appeared to be influencing the solar wind parameters. On November 22, the high speed stream from the eastern mid latitudinal positive polarity coronal hole was apparent, with values returning towards background levels by November 24. The week ended with the possible arrival of the ICME at 07:55 UTC on November 25, possibly from the CME seen in LASCO C2 at 06:48UT on November 22, combined with the high speed stream from the mid latitudinal positive polarity coronal hole that crossed central meridian on November 23.
Geomagnetism
Geomagnetic conditions reached moderate storm levels globally and locally (Kp 6 and K_Bel 6) late on November 25. This was due to the the combined effects of the ICME with the high speed streams.
International Sunspot Number by SILSO

The daily Estimated International Sunspot Number (EISN, red curve with shaded error) derived by a simplified method from real-time data from the worldwide SILSO network. It extends the official Sunspot Number from the full processing of the preceding month (green line), a few days more than one solar rotation. The horizontal blue line shows the current monthly average. The yellow dots give the number of stations that provided valid data. Valid data are used to calculate the EISN. The triangle gives the number of stations providing data. When a triangle and a yellow dot coincide, it means that all the data is used to calculate the EISN of that day.
PROBA2 Observations
Solar Activity
Solar flare activity fluctuated from low to moderate during the week.
In order to view the activity of this week in more detail, we suggest to go to the following website from which all the daily (normal and difference) movies can be accessed: https://proba2.oma.be/ssa
This page also lists the recorded flaring events.
A weekly overview movie (SWAP week 713) can be found here: https://proba2.sidc.be/swap/data/mpg/movies/weekly_movies/weekly_movie_2023_11_20.mp4.
Details about some of this week's events can be found further below.
If any of the linked movies are unavailable they can be found in the P2SC movie repository here: https://proba2.oma.be/swap/data/mpg/movies/.
Thursday November 23
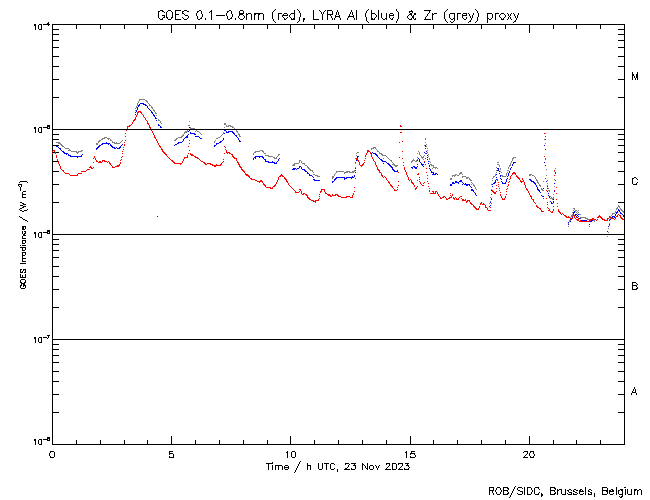

The largest flare of this week, an M1.4, was observed by LYRA (top panel) and SWAP (bottom panel). The flare peaked on 2023-Nov-23 at 03:38 UT. It occurred on the north-eastern limb, and it originated from the then still unnumbered NOAA AR3503, which was just behind the visible side of the solar disc. The flare was also associated with a large prominence eruption.
Find a SWAP movie of the event here: https://proba2.sidc.be/swap/movies/20231123_swap_movie.mp4.
Noticeable Solar Events
| DAY | BEGIN | MAX | END | LOC | XRAY | OP | 10CM | TYPE | Cat | NOAA |
| 20 | 0854 | 0903 | 0912 | M1.2 | 3492 | |||||
| 23 | 0259 | 0338 | 0405 | M1.4 | III/1VI/2 | |||||
| 23 | 1425 | 1437 | 1442 | M1.0 | III/2 | 54 | 3490 | |||
| 24 | 0917 | 0933 | 0943 | S16W2 | M1.1 | 1F | VI/2III/2 | 53 | 3499 |
| LOC: approximate heliographic location | TYPE: radio burst type |
| XRAY: X-ray flare class | Cat: Catania sunspot group number |
| OP: optical flare class | NOAA: NOAA active region number |
| 10CM: peak 10 cm radio flux |
Geomagnetic Observations in Belgium

Local K-type magnetic activity index for Belgium based on data from Dourbes (DOU) and Manhay (MAB). Comparing the data from both measurement stations allows to reliably remove outliers from the magnetic data. At the same time the operational service availability is improved: whenever data from one observatory is not available, the single-station index obtained from the other can be used as a fallback system.
Both the two-station index and the single station indices are available here: http://ionosphere.meteo.be/geomagnetism/K_BEL/
Review of Ionospheric Activity
NEW! The time series below illustrates (in green) the VTEC deviation from normal quiet behaviour.
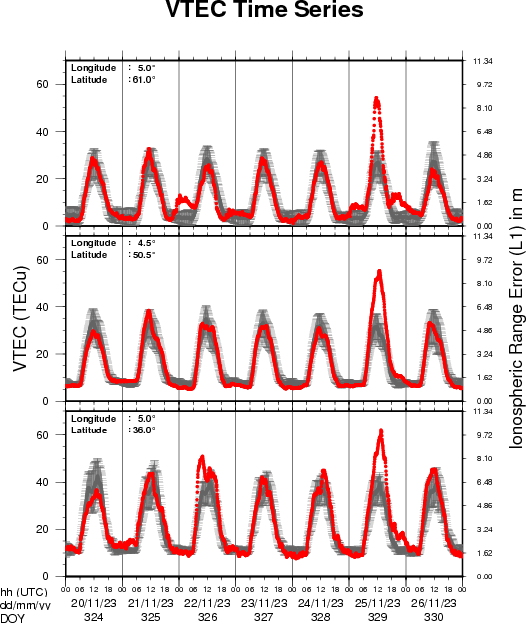

VTEC time series at 3 locations in Europe from 20 Nov 2023 till 26 Nov 2023
The top figure shows the time evolution of the Vertical Total Electron Content (VTEC) (in red) during the last week at three locations:
a) in the northern part of Europe(N 61deg E 5deg)
b) above Brussels(N 50.5deg, E 4.5 deg)
c) in the southern part of Europe(N 36 deg, E 5deg)
This top figure also shows (in grey) the normal ionospheric behaviour expected based on the median VTEC from the 15 previous days.
The time series below shows the VTEC difference (in green) and relative difference (in blue) with respect to the median of the last 15 days in the North, Mid (above Brussels) and South of Europe. It thus illustrates the VTEC deviation from normal quiet behaviour.
The VTEC is expressed in TECu (with TECu=10^16 electrons per square meter) and is directly related to the signal propagation delay due to the ionosphere (in figure: delay on GPS L1 frequency).
The Sun's radiation ionizes the Earth's upper atmosphere, the ionosphere, located from about 60km to 1000km above the Earth's surface.The ionization process in the ionosphere produces ions and free electrons. These electrons perturb the propagation of the GNSS (Global Navigation Satellite System) signals by inducing a so-called ionospheric delay.
See http://stce.be/newsletter/GNSS_final.pdf for some more explanations ; for detailed information, see http://gnss.be/ionosphere_tutorial.php
The SIDC Space Weather Briefing
The Space Weather Briefing presented by the forecaster on duty from November 20 to 26. It reflects in images and graphs what is written in the space weather report: https://www.stce.be/briefings/20231127_SWbriefing.pdf
If you need to access the movies, contact us: stce_coordination at stce.be
Activities at the STCE
Check out our activity calendar: activities and encounters with the Sun-Space-Earth system and Space Weather as the main theme. We provide occasions to get submerged in our world through educational, informative and instructive activities.
If you want your event in our calendar, contact us: stce_coordination at stce.be
* Dec 4-6, STCE course: Space Weather impacts on ionospheric wave propagation - focus on GNSS and HF, Brussels, Belgium - Registrations are open
* Jan 22-24, 2024, STCE Space Weather Introductory Course, Brussels, Belgium - Registrations are open
* Jan 25, 2024, post-Space Weather Introductory Course, by JMG and MeteoWing, place TBD - registration is included in the Jan SWIC
* Mar 4-5, 2024, STCE Space Weather Introductory Course, focus n aviation, online - Registrations will open soon
* Apr 22-24, 2024, STCE Space Weather Introductory Course, Brussels, Belgium - Registrations will open soon
Check: https://www.stce.be/calendar