- Table of Content
- 1.PROBA2 Observa...
- 2.International ...
- 3.Noticeable Sol...
- 4.Geomagnetic Ob...
- 5.Review of Iono...
- 6.The SIDC Space...
- 7.STCE Activitie...
2. International Sunspot Number by SILSO
3. Noticeable Solar Events
4. Geomagnetic Observations in Belgium
5. Review of Ionospheric Activity
6. The SIDC Space Weather Briefing
7. STCE Activities
PROBA2 Observations
Solar Activity
Solar flare activity fluctuated from low to moderate during the week.
In order to view the activity of this week in more detail, we suggest to go to the following website from which all the daily (normal and difference) movies can be accessed: https://proba2.oma.be/ssa
This page also lists the recorded flaring events.
A weekly overview movie can be found here (SWAP week 715). https://proba2.sidc.be/swap/data/mpg/movies/weekly_movies/weekly_movie_2023_12_04.mp4
Details about some of this week's events can be found further below.
If any of the linked movies are unavailable they can be found in the P2SC movie repository here https://proba2.oma.be/swap/data/mpg/movies/
Friday Dec 08
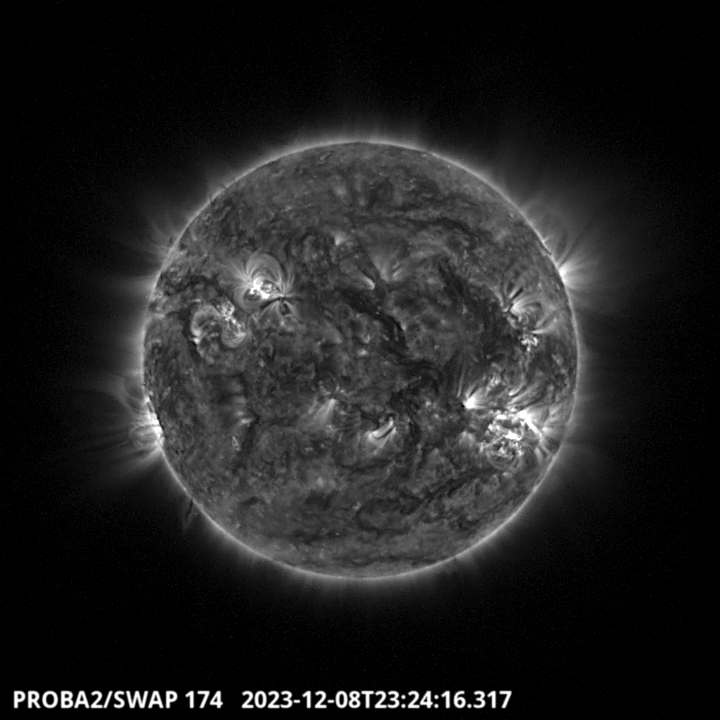
The largest flare of the week is a M5.8. It has been produced by the NOAA active region 3511 which is located on the South West part of the solar disk. Find a SWAP movie of the event here. https://proba2.sidc.be/swap/movies/20231208_swap_movie.mp4
Sunday Dec 10
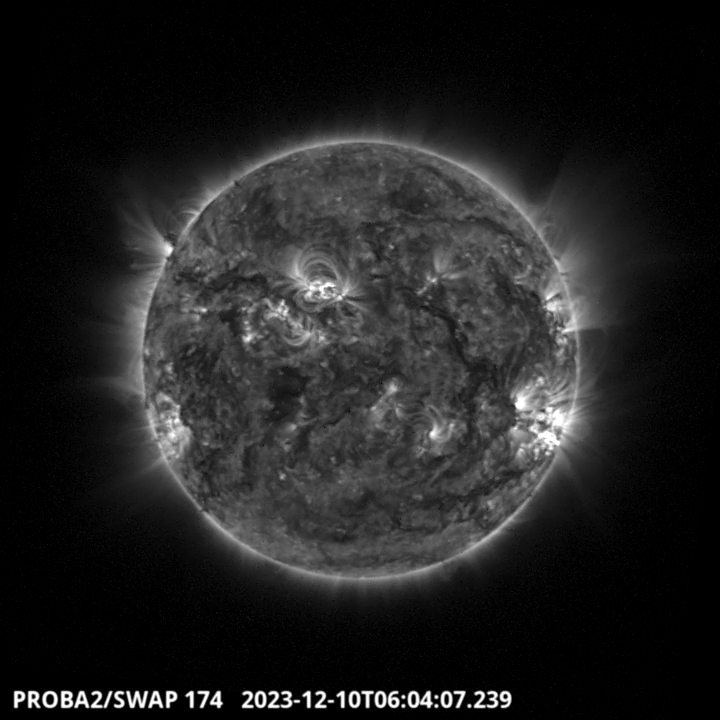
Elongated coronal hole from NorthEast to SouthEast part of the solar disk. Find a SWAP movie of the event here. https://proba2.sidc.be/swap/movies/20231210_swap_movie.mp4
International Sunspot Number by SILSO

The daily Estimated International Sunspot Number (EISN, red curve with shaded error) derived by a simplified method from real-time data from the worldwide SILSO network. It extends the official Sunspot Number from the full processing of the preceding month (green line), a few days more than one solar rotation. The horizontal blue line shows the current monthly average. The yellow dots give the number of stations that provided valid data. Valid data are used to calculate the EISN. The triangle gives the number of stations providing data. When a triangle and a yellow dot coincide, it means that all the data is used to calculate the EISN of that day.
Noticeable Solar Events
| DAY | BEGIN | MAX | END | LOC | XRAY | OP | 10CM | TYPE | Cat | NOAA |
| 05 | 0639 | 0644 | 0648 | N18E87 | M1.5 | 1F | 3513 | |||
| 05 | 2059 | 2110 | 2117 | N20E70 | M1.0 | 1N | 3513 | |||
| 05 | 2117 | 2120 | 2125 | M1.4 | 3513 | |||||
| 06 | 0530 | 0541 | 0552 | N18E66 | M2.1 | 2N | III/1 | 3513 | ||
| 06 | 2126 | 2144 | 2155 | N20E55 | M2.3 | 1B | 3513 | |||
| 08 | 2257 | 2307 | 2314 | S21W47 | M5.4 | 1B | III/3 | 79 | 3511 | |
| 09 | 0941 | 0955 | 1006 | S21W54 | M1.5 | SF | III/2 | 79 | 3511 | |
| 09 | 1303 | 1319 | 1337 | M1.0 | III/1 | 79 | 3511 | |||
| 10 | 0342 | 0353 | 0358 | S20W66 | M2.3 | SF | 3511 | |||
| 10 | 2237 | 2243 | 2247 | M1.4 | 3511 |
| LOC: approximate heliographic location | TYPE: radio burst type |
| XRAY: X-ray flare class | Cat: Catania sunspot group number |
| OP: optical flare class | NOAA: NOAA active region number |
| 10CM: peak 10 cm radio flux |
Geomagnetic Observations in Belgium
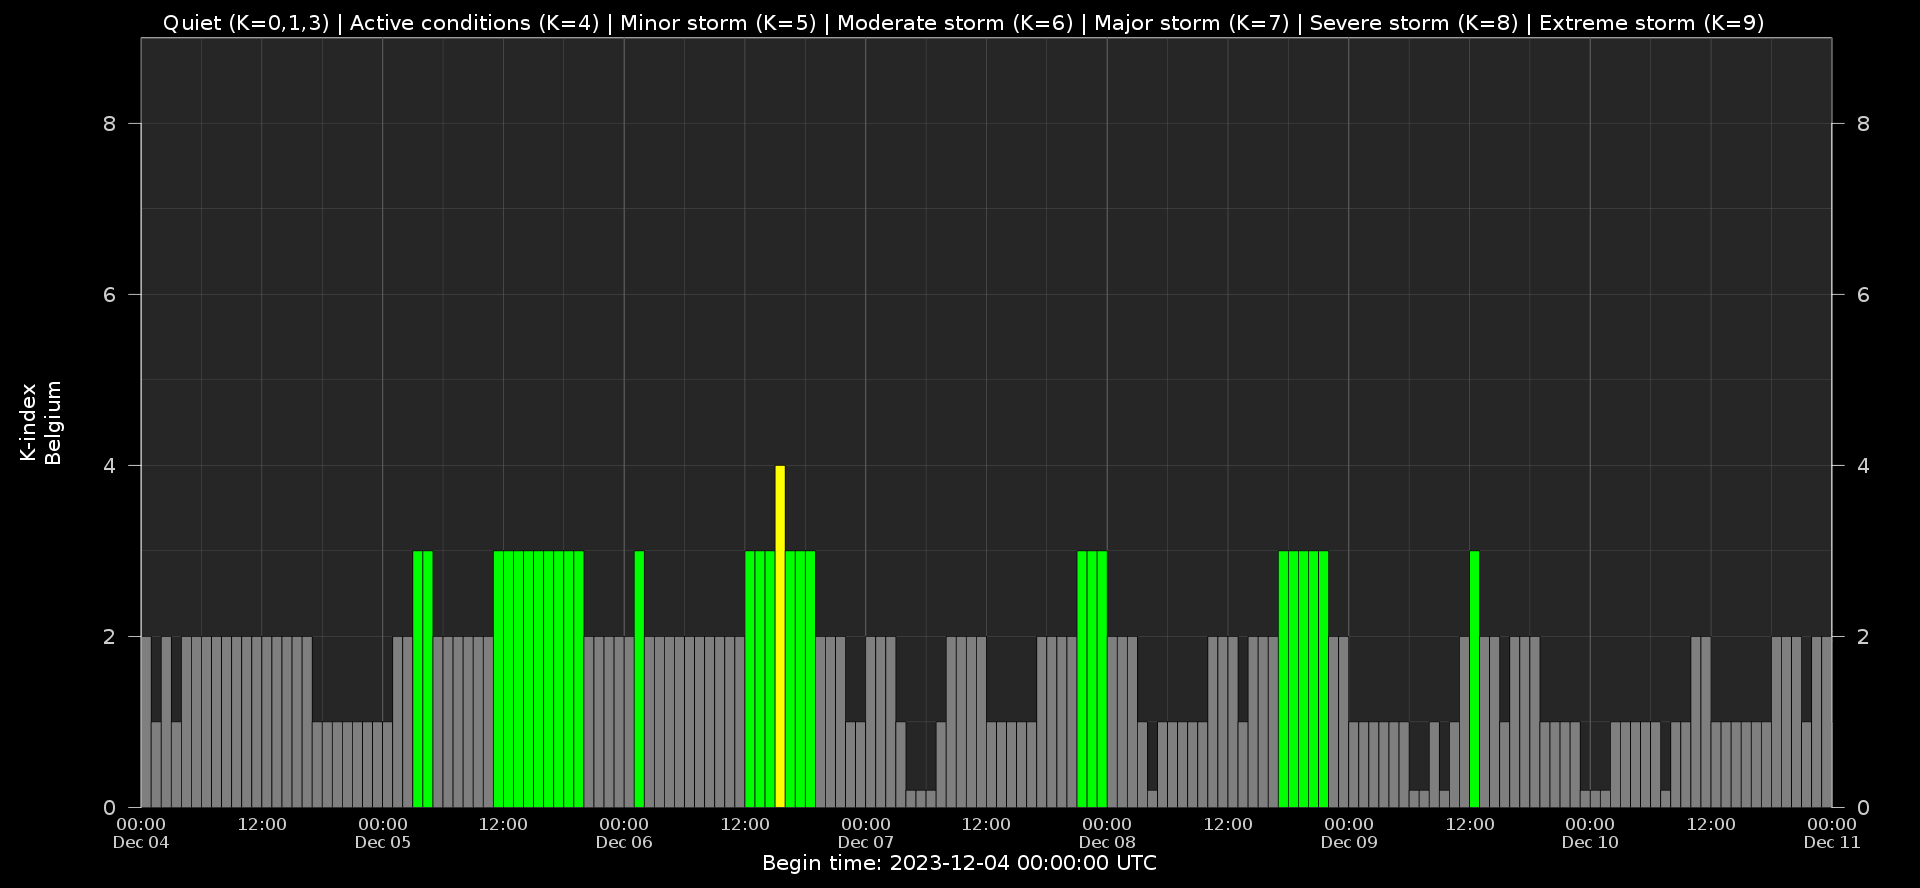
Local K-type magnetic activity index for Belgium based on data from Dourbes (DOU) and Manhay (MAB). Comparing the data from both measurement stations allows to reliably remove outliers from the magnetic data. At the same time the operational service availability is improved: whenever data from one observatory is not available, the single-station index obtained from the other can be used as a fallback system.
Both the two-station index and the single station indices are available here: http://ionosphere.meteo.be/geomagnetism/K_BEL/
Review of Ionospheric Activity
NEW! The time series below illustrates (in green) the VTEC deviation from normal quiet behaviour.
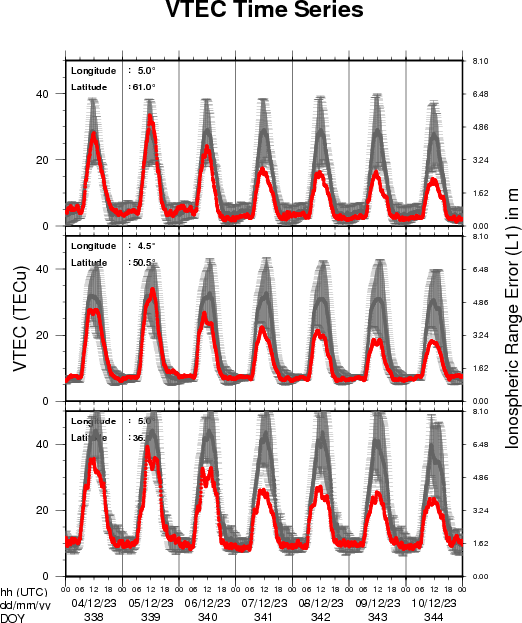
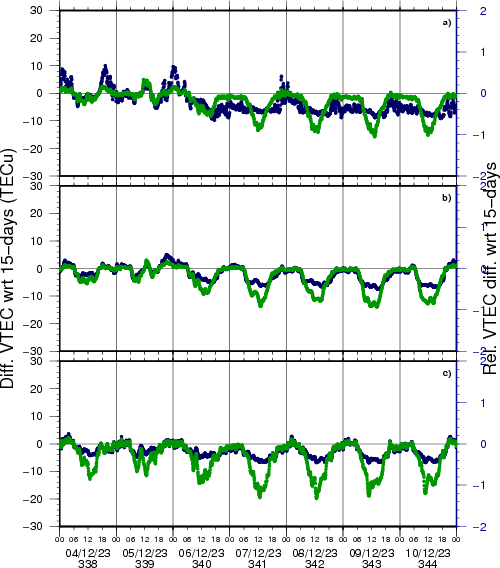
VTEC time series at 3 locations in Europe from 4 Dec 2023 till 10 Dec 2023
The top figure shows the time evolution of the Vertical Total Electron Content (VTEC) (in red) during the last week at three locations:
a) in the northern part of Europe(N 61deg E 5deg)
b) above Brussels(N 50.5deg, E 4.5 deg)
c) in the southern part of Europe(N 36 deg, E 5deg)
This top figure also shows (in grey) the normal ionospheric behaviour expected based on the median VTEC from the 15 previous days.
The time series below shows the VTEC difference (in green) and relative difference (in blue) with respect to the median of the last 15 days in the North, Mid (above Brussels) and South of Europe. It thus illustrates the VTEC deviation from normal quiet behaviour.
The VTEC is expressed in TECu (with TECu=10^16 electrons per square meter) and is directly related to the signal propagation delay due to the ionosphere (in figure: delay on GPS L1 frequency).
The Sun's radiation ionizes the Earth's upper atmosphere, the ionosphere, located from about 60km to 1000km above the Earth's surface.The ionization process in the ionosphere produces ions and free electrons. These electrons perturb the propagation of the GNSS (Global Navigation Satellite System) signals by inducing a so-called ionospheric delay.
See http://stce.be/newsletter/GNSS_final.pdf for some more explanations ; for detailed information, see http://gnss.be/ionosphere_tutorial.php
The SIDC Space Weather Briefing
The Space Weather Briefing presented by the forecaster on duty from 4 to 10 December. It reflects in images and graphs what is written in the space weather report: https://www.stce.be/briefings/20231211_SWbriefing

If you need to access the movies, contact us: stce_coordination at stce.be
STCE Activities
Check out our activity calendar: activities and encounters with the Sun-Space-Earth system and Space Weather as the main theme. We provide occasions to get submerged in our world through educational, informative and instructive activities.
If you want your event in our calendar, contact us: stce_coordination at stce.be
* Jan 22-24, 2024, STCE Space Weather Introductory Course, Brussels, Belgium - Registrations are open
* Jan 25, 2024, post-Space Weather Introductory Course, by JMG and MeteoWing, place TBD - registration is included in the Jan SWIC
* Mar 4-5, 2024, STCE Space Weather Introductory Course, focus on aviation, online - Registrations are open
* Apr 22-24, 2024, STCE Space Weather Introductory Course, Brussels, Belgium - Registrations are open
More info needed? Contact us: stce_coordination at stce.be
Check: https://www.stce.be/calendar