- Table of Content
- 1.Impression of
- 2.Review of Spac...
- 3.EUI at the mov...
- 4.Noticeable Sol...
- 5.International ...
- 6.Geomagnetic Ob...
- 7.PROBA2 Observa...
- 8.The SIDC Space...
- 9.Review of Iono...
- 10.STCE calendar
2. Review of Space Weather
3. EUI at the movies
4. Noticeable Solar Events
5. International Sunspot Number by SILSO
6. Geomagnetic Observations in Belgium
7. PROBA2 Observations (11 Dec 2023 - 17 Dec 2023)
8. The SIDC Space Weather Briefing
9. Review of Ionospheric Activity
10. STCE calendar
Impression of
We had recently the kick-off of a new course on Space Weather impacts on ionospheric wave propagation - focus on GNSS and HF.
It was a succes.
a fast impression:

A big thank you to the participants and the lecturers!
The Course: https://events.spacepole.be/event/173/
Review of Space Weather
Solar Active Regions (ARs) and flares
Solar flaring activity reached high levels. Seventeen (17) active regions were observed on the visible side of the Sun.
The week started at moderate levels with an M1.4-flare, peak time 22:43 UTC on Dec 10th, from NOAA AR 3511. This region, that at the beginning of the week was rotating out of view over the west limb, was the main driver of the flaring activity observed during the first two days.
From December 13th, the majority of the flaring activity originated from NOAA AR 3514, that was also the source of all strong flares observed for the rest of the week. The largest flare of the week, and of the solar cycle so far, was an X2.8 flare, on December 14 with peak time 17:02 UTC. Type II and Type IV radio emission were detected at 17:08 on December 14th during the flaring activity. The Type II burst indicates the presence of a shock and type IV emission indicates that the event is very probably associated with a coronal mass ejection. From the same region, M6.3 and M6.9 flares peaking at 07:15 UTC and 07:34 on December 15th were observed and associated with a Type IV Radio Emission. NOAA AR 3514 also produced M5.8 and M2.3 flares with peak time at 07:44 UTC and 13:48 UTC on December 14th.
Coronal Mass Ejections
A partial halo coronal mass ejection (CME) was observed in SOHO/LASCO-C2 from 19:12 UTC on December 12 (detected also by CACTUS software). The CME was directed primarily to the South-East from Earth perspective. This was a back-sided eruption and therefore not expected to impact Earth.
A faint partial halo CME was observed in SOHO/LASCO-C2 at around 23:36 UTC on December 12, directed towards the North-West from Earth perspective. The CME was likely associated to C2.9 flare from NOAA AR 3514 and a small coronal dimming. This CME was predicted to impact the Earth late on Dec 15.
A faint CME was observed in SOHO/LASCO-C2 at around 07:39 UTC on December 14, directed towards the North-West from Earth's perspective. This CME was likely associated with the M5.8 flare from NOAA AR 3514 and a small coronal dimming.
Another CME was observed in LASCO/C2 coronagraph data from 17:24 UTC on December 14. This CME was associated with the X2.8 flare, originating from NOAA AR 3514, along with a Type II and Type IV radio burst. The CME was directed primarily to the West from the Earth perspective. As the latter CME was much faster than the former, they were expected to merge into each other, and a glancing blow to the Earth's environment was predicted early on December 17.
A partial CME was first observed in the SOHO/LASCO-C2 field of view at 07:48 UTC on December 15. This CME was likely associated with the M6.3 and an M6.9 flare, which peaked at 07:15 UTC and 07:34 UTC on December 15th, originating from NOAA AR 3514, along with a Type IV radio burst. The CME was directed primarily to the South-West from the Earth’s perspective and the bulk of the CME was not expected to impact the Earth. However, the CME had the potential of a glancing blow early on December 17, although with low confidence.
Coronal Holes
Two positive polarity coronal holes, one equatorial and one in the northern hemisphere were visible in the week. The first one began to transit the central meridian on December 11 and the second one on December 15.
Electron fluxes at GEO
The greater than 2 MeV electron flux exceeded the 1000 pfu threshold for interval of a few hours on December 12th, due to the enhanced solar wind conditions of the previous week. From December 13th it returned to background values. The 24-hour electron fluence started at moderate levels and dropped back to nominal levels at the second half of the week.
Solar wind
The solar wind exhibited signatures of several weak ICME arrivals.
The passage of a solar wind structure with an unclear source was observed around 12:30 UTC on December 12th and on 21:05 UTC on December 13th. On December 15th at 10:57 UTC a shock was observed in ACE data. The magnetic field jumped from 5 to 21 nT, and the solar wind speed from 280 to 430 km/s, that was probably associated to the arrival of faint partial halo CME observed on December 13.
A solar wind shock was also observed on December 17th at around 07:45 UTC. The magnetic field reached 16 nT (please, note the data gap in ACE and DSCOVR data that occurred between 05:54 UTC and 07:32 UTC on December 17). The solar wind speed increased from 445 to 550 km/s. The southward interplanetary magnetic component, Bz, reached a minimum of -11 nT. These disturbances most likely marked the arrival of the CMEs, that occurred on December 14-15.
Geomagnetism
Last week, the geomagnetic conditions were mostly quiet to unsettle with a short periods of active conditions. Geomagnetic conditions reached minor storm levels both globally and locally (Kp = 5, K Bel = 5) during the arrival of ICMEs on December 17.
EUI at the movies
The EUV imager EUI onboard of the space craft Solar Orbiter could capture the solar eruption on December 14.
The solar energy was released in the form of e.m. radiation (an X2.8 flare - this is extreme!) and ejected plasma, i.e. coronal mass ejection. The flare impacted the Earth immediately on the day side. The solar wind disturbances at L1 on December 17 were probably linked to the coronal mass ejection.

174 movie: https://www.sidc.be/EUI/data/movie/dailySynoptics/20231214_FSI174_L1.mp4
304 movie: https://www.sidc.be/EUI/data/movie/dailySynoptics/20231214_FSI304_L1.mp4
Noticeable Solar Events
| DAY | BEGIN | MAX | END | LOC | XRAY | OP | 10CM | TYPE | Cat | NOAA |
| 14 | 0711 | 0744 | 0800 | N4W41 | M5.8 | SF | VI/1CTM/2 | 83 | 3514 | |
| 14 | 1329 | 1348 | 1408 | M2.3 | 83 | 3514 | ||||
| 14 | 1647 | 1702 | 1712 | X2.8 | II/2IV/2 | 83 | 3514 | |||
| 15 | 0703 | 0715 | 0723 | M6.3 | 1200 | IV/2 | 83 | 3514 | ||
| 15 | 0723 | 0734 | 0743 | M6.9 | III/1 | 83 | 3514 | |||
| 17 | 2008 | 2017 | 2021 | M1.1 | 83 | 3514 |
| LOC: approximate heliographic location | TYPE: radio burst type |
| XRAY: X-ray flare class | Cat: Catania sunspot group number |
| OP: optical flare class | NOAA: NOAA active region number |
| 10CM: peak 10 cm radio flux |
International Sunspot Number by SILSO

The daily Estimated International Sunspot Number (EISN, red curve with shaded error) derived by a simplified method from real-time data from the worldwide SILSO network. It extends the official Sunspot Number from the full processing of the preceding month (green line), a few days more than one solar rotation. The horizontal blue line shows the current monthly average. The yellow dots give the number of stations that provided valid data. Valid data are used to calculate the EISN. The triangle gives the number of stations providing data. When a triangle and a yellow dot coincide, it means that all the data is used to calculate the EISN of that day.
Geomagnetic Observations in Belgium
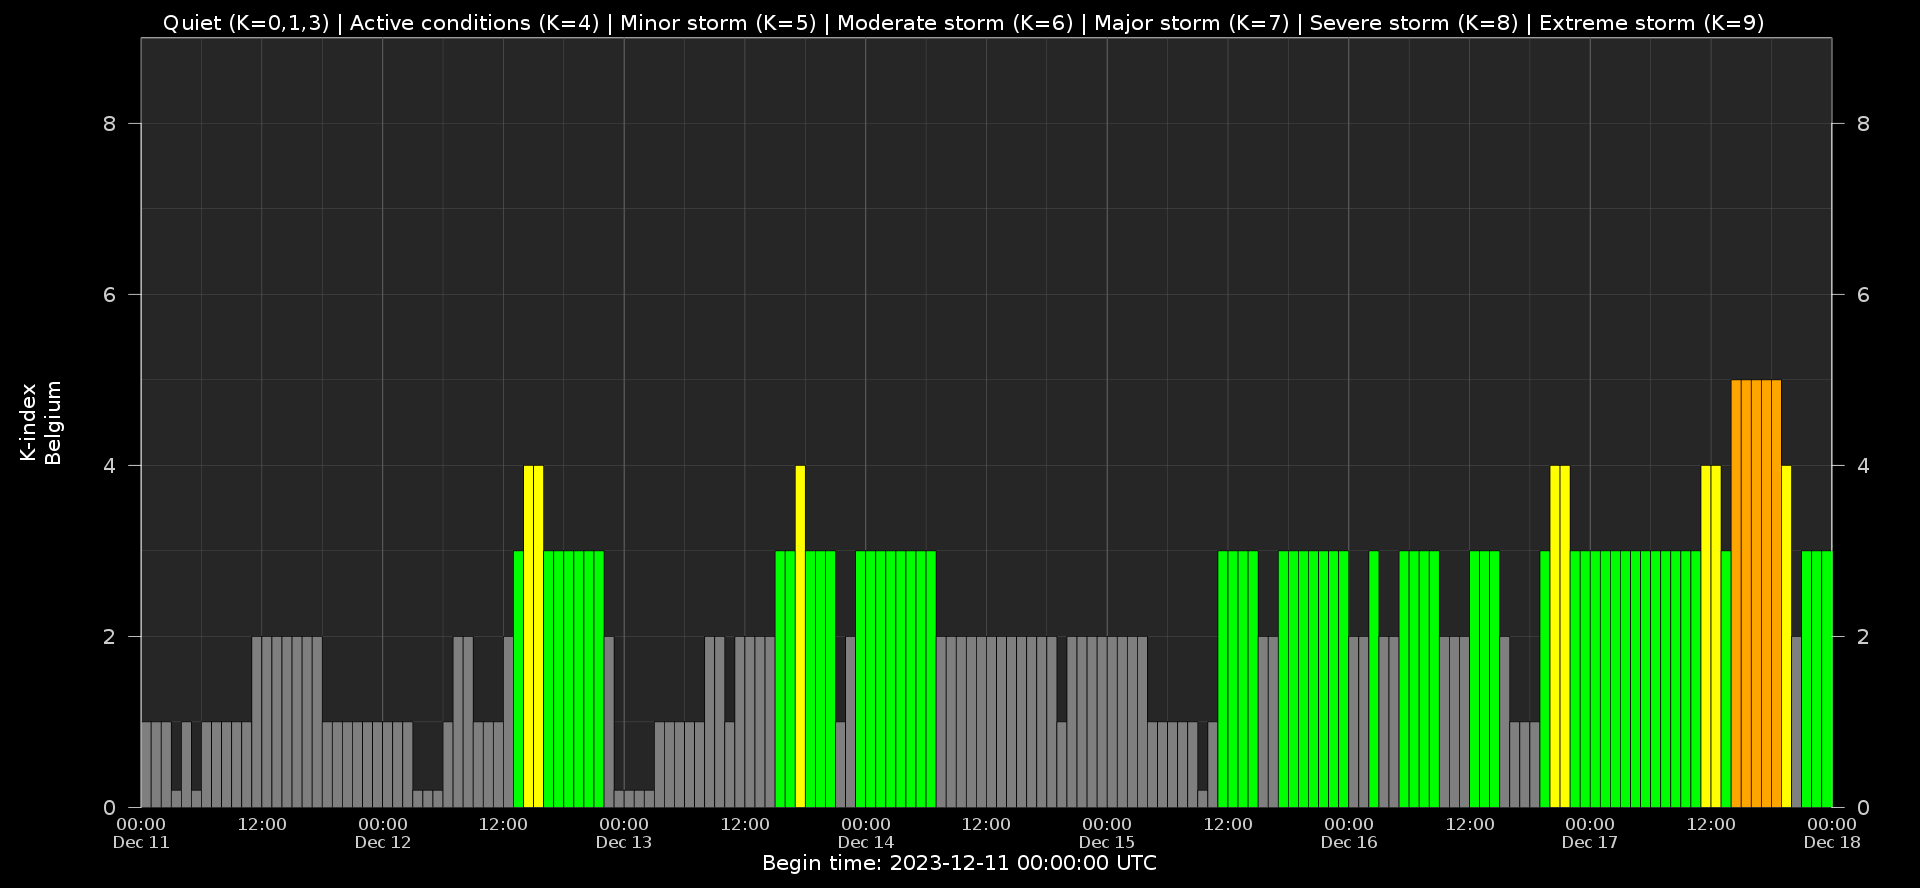
Local K-type magnetic activity index for Belgium based on data from Dourbes (DOU) and Manhay (MAB). Comparing the data from both measurement stations allows to reliably remove outliers from the magnetic data. At the same time the operational service availability is improved: whenever data from one observatory is not available, the single-station index obtained from the other can be used as a fallback system.
Both the two-station index and the single station indices are available here: http://ionosphere.meteo.be/geomagnetism/K_BEL/
PROBA2 Observations (11 Dec 2023 - 17 Dec 2023)
Solar Activity
Solar flare activity fluctuated from low to high during the week.
In order to view the activity of this week in more detail, we suggest to go to the following website from which all the daily (normal and difference) movies can be accessed: https://proba2.oma.be/ssa
This page also lists the recorded flaring events.
A weekly overview movie can be found here (SWAP week 716). https://proba2.sidc.be/swap/data/mpg/movies/weekly_movies/weekly_movie_2023_12_11.mp4
Details about some of this week’s events can be found further below.
If any of the linked movies are unavailable they can be found in the P2SC movie repository here https://proba2.sidc.be/swap/data/mpg/movies/
Thursday Dec 14
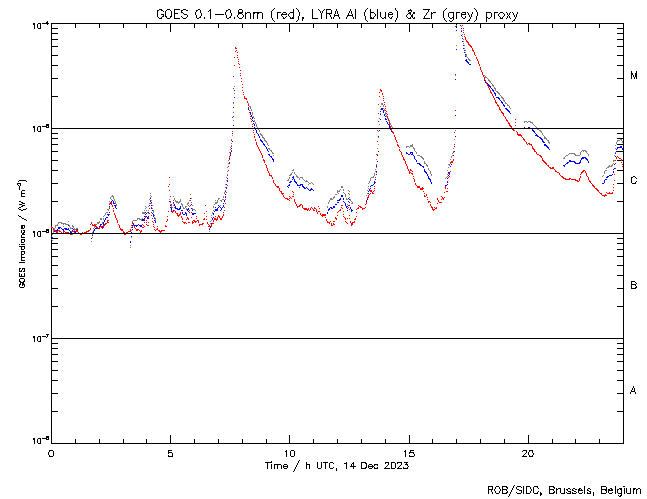
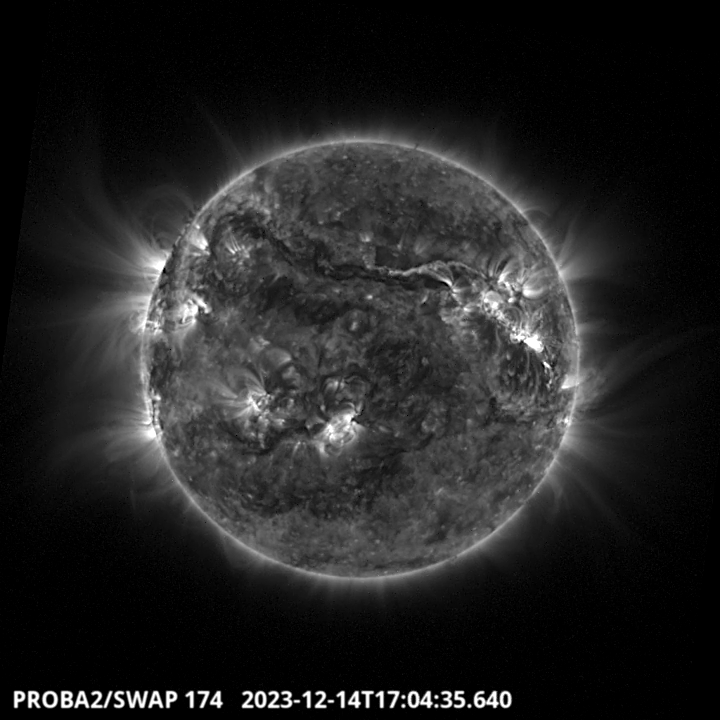
A X2.8 flare, the largest flare of the current solar cycle so far, occurred on December 14 around
17:04 UT in the North West part of the solar disk (see the above LYRA curves and SWAP image).
It was produced by the NOAA AR 3514 (N05W50). It was followed by a CME.
The SIDC Space Weather Briefing
The Space Weather Briefing presented by the forecaster on duty from Dec 10 to 17. It reflects in images and graphs what is written in the space weather report: https://www.stce.be/briefings/SIDCbriefing-20231218.pdf

If you need to access the movies, contact us: stce_coordination at stce.be
Review of Ionospheric Activity
NEW! The time series below illustrates (in green) the VTEC deviation from normal quiet behaviour.


VTEC time series at 3 locations in Europe from 11 Dec 2023 till 17 Dec 2023
The top figure shows the time evolution of the Vertical Total Electron Content (VTEC) (in red) during the last week at three locations:
a) in the northern part of Europe(N 61deg E 5deg)
b) above Brussels(N 50.5deg, E 4.5 deg)
c) in the southern part of Europe(N 36 deg, E 5deg)
This top figure also shows (in grey) the normal ionospheric behaviour expected based on the median VTEC from the 15 previous days.
The time series below shows the VTEC difference (in green) and relative difference (in blue) with respect to the median of the last 15 days in the North, Mid (above Brussels) and South of Europe. It thus illustrates the VTEC deviation from normal quiet behaviour.
The VTEC is expressed in TECu (with TECu=10^16 electrons per square meter) and is directly related to the signal propagation delay due to the ionosphere (in figure: delay on GPS L1 frequency).
The Sun's radiation ionizes the Earth's upper atmosphere, the ionosphere, located from about 60km to 1000km above the Earth's surface.The ionization process in the ionosphere produces ions and free electrons. These electrons perturb the propagation of the GNSS (Global Navigation Satellite System) signals by inducing a so-called ionospheric delay.
See http://stce.be/newsletter/GNSS_final.pdf for some more explanations; for more information, see https://gnss.be/SpaceWeather
STCE calendar
Check out our calendar with activities and encounters with the Sun-Space-Earth system and Space Weather as the main theme. We provide occasions to get submerged in our world through educational, informative and instructive activities.
If you want your event in our calendar, contact us: stce_coordination at stce.be
* Jan 22-24, 2024, STCE Space Weather Introductory Course, Brussels, Belgium - Registrations are open
* Jan 25, 2024, post-Space Weather Introductory Course, by JMG and MeteoWing, place TBD - registration is included in the Jan SWIC
* Mar 4-5, 2024, STCE Space Weather Introductory Course, focus on aviation, online - Registrations are open
* Apr 22-24, 2024, STCE Space Weather Introductory Course, Brussels, Belgium - Registrations are open
More info needed? Contact us: stce_coordination at stce.be
Check: https://www.stce.be/calendar
