- Table of Content
- 1.Happy New Year...
- 2.X5 flare in im...
- 3.International ...
- 4.Review of Spac...
- 5.Noticeable Sol...
- 6.PROBA2 Observa...
- 7.Geomagnetic Ob...
- 8.The SIDC Space...
- 9.Review of Iono...
- 10.Review of Spac...
- 11.Noticeable Sol...
- 12.PROBA2 Observa...
- 13.Geomagnetic Ob...
- 14.The SIDC Space...
- 15.STCE calendar
2. X5 flare in images
3. International Sunspot Number by SILSO
4. Review of Space Weather (18 Dec 2023 - 24 Dec 2023)
5. Noticeable Solar Events
6. PROBA2 Observations (18 Dec 2023 - 24 Dec 2023)
7. Geomagnetic Observations in Belgium
8. The SIDC Space Weather Briefing (18 Dec 2023 - 24 Dec 2023)
9. Review of Ionospheric Activity
10. Review of Space Weather (25 Dec 2023 - 31 Dec 2023)
11. Noticeable Solar Events
12. PROBA2 Observations (25 Dec 2023 - 31 Dec 2023)
13. Geomagnetic Observations at Dourbes
14. The SIDC Space Weather Briefing (25 Dec 2023 - 31 Dec 2023)
15. STCE calendar
Happy New Year!
X5 flare in images
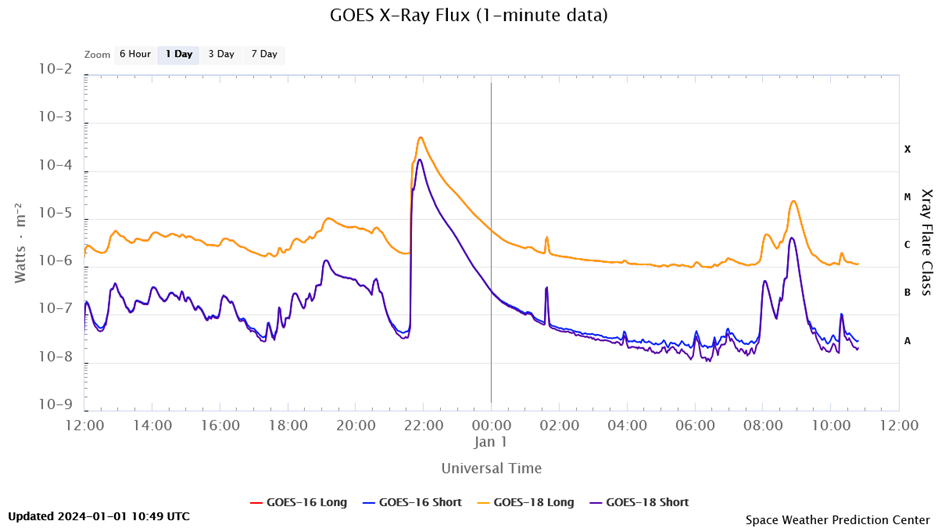
The X5 flare that took place on 31 December has been discussed earlier in this newsflash (https://www.sidc.be/article/fireworks ). The graph underneath shows the evolution in soft x-rays of the event. This is the strongest solar flare so far this solar cycle, and the strongest since the X8.2 event (rescaled X11) on 10 September 2017 and the X9.3 flare (rescaled: X13) from 6 September 2017.
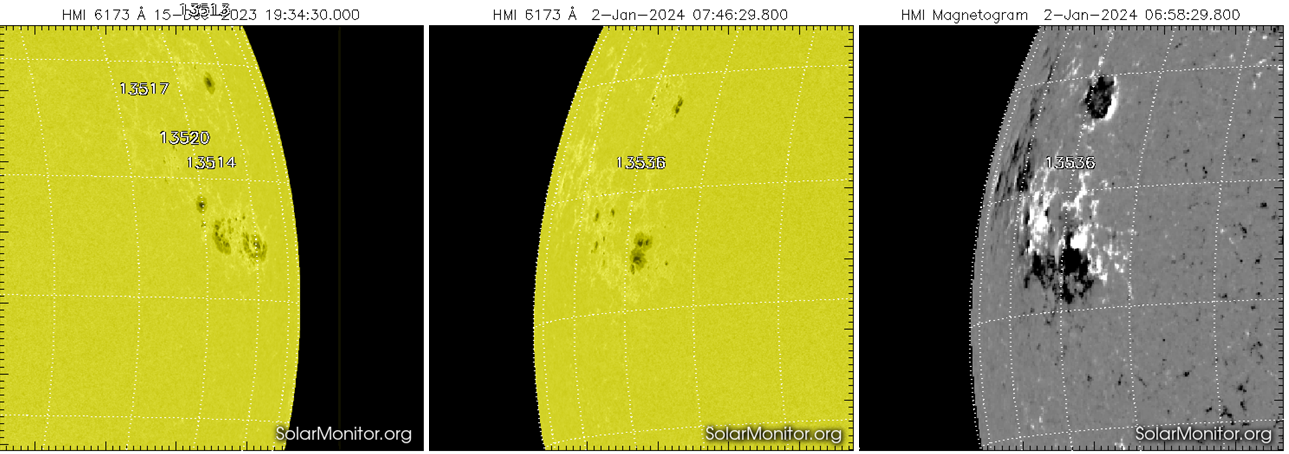
The source of the event was active region NOAA 3536, which is situated approximately at the same location as that of NOAA 3514, the sunspot group responsible for the previous record of strongest flares in this solar cycle (SC25), producing an X2.8 flare on 14 December (see this newsitem at https://www.sidc.be/article/x28-flare ). It is unclear if NOAA 3536 is the further development of old NOAA 3514, or a new region that has developed near the same location. H-alpha images indicate that the X5 flare was produced by the main leading spot of NOAA 3536. This sunspot contained a magnetic delta, i.e. sunspots of opposite magnetic polarity within the same penumbra. This delta structure now seems to be gradually dissolving, i.e. the sunspots of opposite polarity are now in separate penumbra, but they remain close enough to each other that there's still a chance on further significant flaring from this region. The SDO images (http://sdo.gsfc.nasa.gov/data/aiahmi/ ) underneath show the active regions on 15 December and 2 January in white light, with a magnetogram showing NOAA 3536's delta configuration early on 2 January to the right.
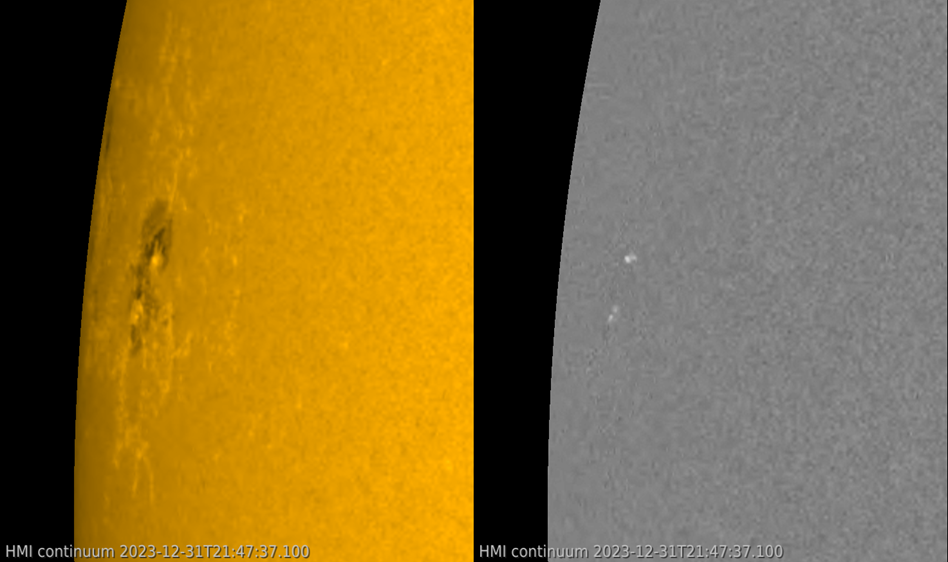
SDO white light imagery also shows that the flare was visible in white light. Such a "White Light Flare" (WLF) is a rare event indeed (discounting satellite observations), reserved only to very strong flares such as the Carrington event in 1859 or the Halloween flares in 2003. Compared to those events, the 31 December WLF was only a faint one. Also, satellites are located far above the Earth's atmosphere, and as such have of course a much crisper view than observers on the ground. Moreover, the flare occurred during daylight over the Pacific Ocean, where there are not many observers to watch the brief event. The SDO images underneath show the WLF in white light (left) and difference images -one image subtracted from the next- are on the right. Clips can be found in the online version of this newsitem at https://www.sidc.be/article/x5-flare-images
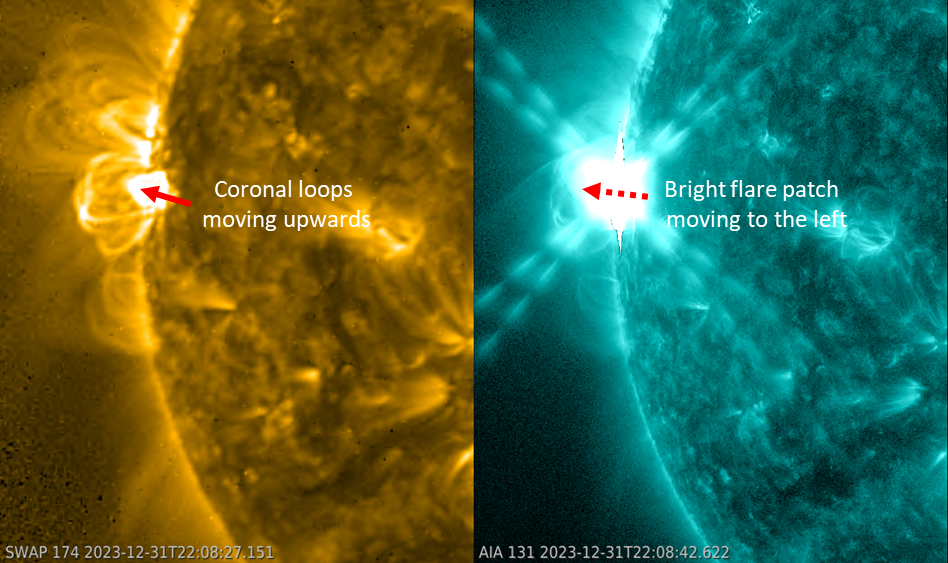
Many of the SDO images show "streaks" around the flaring site at the time of flare maximum brightness. These blooming and diffraction patterns are image (camera) artefacts, and are not related to the flare itself. One can also see the bright patch of the flare moving very gently to the left. This is mostly due to the oblique angle from which the flare is seen from Earth, and at the same time the expanding (both in altitude as away from the magnetic neutral line) post eruption coronal loops (PROBA2/SWAP image on the left - http://proba2.oma.be/ssa). The brightest/hottest portions of the flare are indeed at the top of these loops (closest to the point of magnetic reconnection which is moving upward) and at the footpoints of the coronal loops where the accelerated particles crash into the lower solar atmosphere (see e.g. Oka et al. 2018 - Figure 5 in https://link.springer.com/article/10.1007/s11214-018-0515-4 ). The latter phenomenon is actually responsible for the white light emission that could be seen during this flaring event.
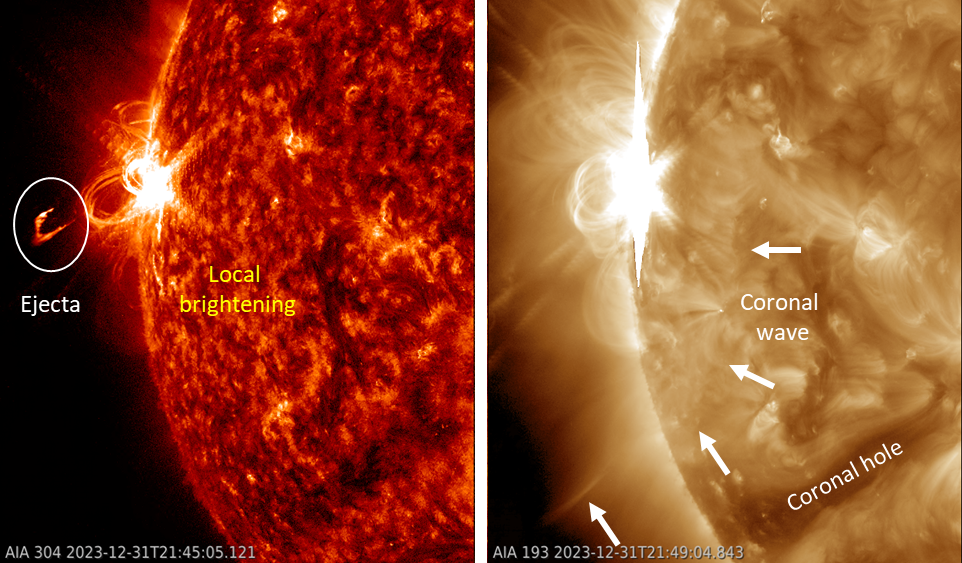
Images in extreme ultraviolet (EUV) show the ejection of material during the flare, as shown in the annotated image underneath. Other passbands show a disturbance moving away from the blast site. This is called a coronal wave (or EIT wave), and is associated with coronal mass ejections (CMEs). The images underneath are from AIA 304 (at temperatures of 80.000 degrees) on the left, and -4 minutes later- from AIA 193 (temperatures of around 1.25 million degrees) on the right. Note how some regions in the solar corona brighten as the coronal wave passes by (maybe a result from induced local magnetic reconnection), and its crashing into the magnetic wall formed by the open magnetic field lines from a coronal hole.
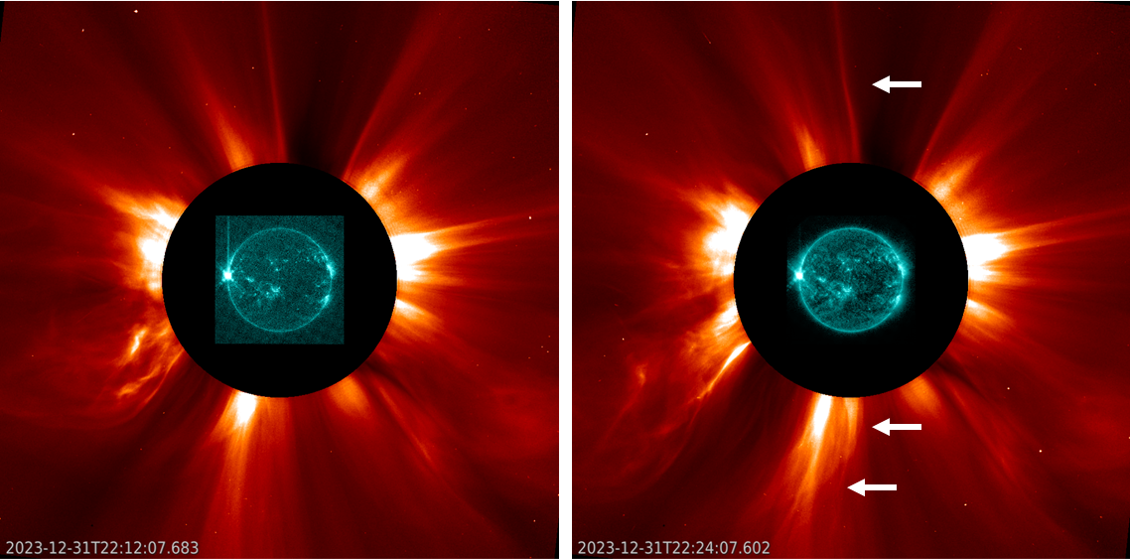
The associated CME was a partial halo CME with a width of around 200 degrees, affecting coronal streamers at both the Sun's north and south pole as indicated on the SOHO/LASCO C2 (https://soho.nascom.nasa.gov/ ) image underneath. Its speed was calculated to be around 2400 km/s. On the SCORE scale (Evans et al. - 2013 - https://doi.org/10.1002/swe.20058 ), this would classify as a "Rare" event, meaning CMEs with such a speed are seen on the average only once every year. Note that the "E" in SCORE stands for extremely rare, for CME speeds of 3000 or more km/s. Such CMEs are seen on average less than once in a solar cycle. The bulk of the CME was directed away from Earth, but the CME was thought to have an earth-directed component. A weak shock in the solar wind was observed on 3 January at 04:51UTC, with wind speed jumping from 410 to 450 km/s. This shock was most likely the expected glancing blow from the 31 December CME, though there are other CME candidates. If this is indeed the CME associated with the X5 event, its arrival was later than expected and probably due to a denser and more slowly moving solar wind than expected in front of it. Geomagnetic activity remained well below storm levels.
International Sunspot Number by SILSO
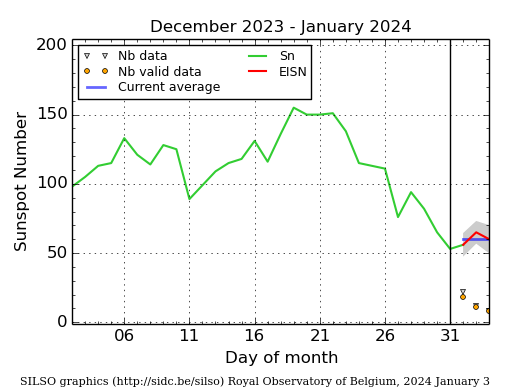
The daily Estimated International Sunspot Number (EISN, red curve with shaded error) derived by a simplified method from real-time data from the worldwide SILSO network. It extends the official Sunspot Number from the full processing of the preceding month (green line), a few days more than one solar rotation. The horizontal blue line shows the current monthly average. The yellow dots give the number of stations that provided valid data. Valid data are used to calculate the EISN. The triangle gives the number of stations providing data. When a triangle and a yellow dot coincide, it means that all the data is used to calculate the EISN of that day.
Review of Space Weather (18 Dec 2023 - 24 Dec 2023)
Solar Active Regions (ARs) and flares
The solar flaring activity was at low to moderate levels over the past week with background C-class flaring and several M-class flares. There were 20 numbered active regions on the visible solar disc, which produced 93 C-class flares and 6 M-class flares. The strongest flare was a GOES M4.2 flare from NOAA Active Regions (AR) 3519 (beta) which peaked at 05:38 UTC on December 21. NOAA AR 3520 and NOAA AR 3529 were the other ARs which produced the M-class flares during the past week. Other notable regions that contributed to the low levels of activity were NOAA AR 3526, NOAA AR 3528, and NOAA AR 3530.
Coronal mass ejections
A narrow coronal mass ejection (CME) was detected in LASCO C2 imagery at 04:00 UTC on December 21. It was associated with an eruption of a large prominence situated close to the western solar limb. No Earth-directed CMEs were detected in the available coronagraph observations during the past week.
Coronal holes
A negative polarity coronal hole (CH), possibly connected to the southern polar CH spanning from 30-55S, crossed the central meridian on December 20, but the corresponding high speed stream did not arrive to the Earth.
Proton flux levels
The 10 MeV proton flux remained below the 10 pfu threshold level over the past week.
Electron fluxes at GEO
The 2 MeV electron flux, as measured by the GOES-16 satellite, was below the threshold level at the start of the week. Around 12:00 UTC on December 20, it began to increase, probably due to the enhanced solar wind conditions, yet it remained below the 1000 pfu threshold level. Starting from 12:00 UTC on December 21, it fluctuated around the threshold level, exceeded the threshold level at 09:40 UTC on December 22 and dropped below it at 21:00 UTC on Dec 22. It remained below the threshold level till the end of the week. The 24h electron fluence was at normal to moderate level during the past week.
Solar wind
At the beginning of the week, solar wind parameters were disturbed, most likely under the influence of several interplanetary coronal mass ejections (ICMEs) that occurred on December 14-15. The solar wind speed increased to 560 km/s, the North-South component (Bz) decreased to -14 nT, and the interplanetary magnetic field (Bt) reached 17 nT. Solar wind parameters were then under the influence of high speed stream (HSS) from the positive polarity coronal hole spanning 10 S to 30 N, that crossed the central meridian on December 17. During the HSS, the solar wind speed increased to 760 km/s, Bz decreased to -10 nT, and the Bt reached 12 nT. Solar wind conditions transitioned from fast to a slow wind regime on December 21. By the end of the week, solar wind parameters were slightly disturbed, with a strong fluctuation of Bz ranging from -7 to 7 nT, Bt ranging from 1 nT to 9 nT, and the solar wind speed increasing from 330 km/s to 440 km/s.
Geomagnetism
At the start of the week, geomagnetic conditions globally reached moderate storm levels (Kp 6) and locally reached active condition levels (K_Bel 4) starting at 06 UTC on December 18. This was due to the continuous impact of the several interplanetary coronal mass ejections (ICMEs) that departed the Sun on December 14-15. Geomagnetic conditions were then temporarily reduced to unsettled conditions before increasing again to minor storm conditions (Kp 5) globally at 21:00 UTC on December 18. This increase was due to the impact of high speed streams from the positive polarity coronal hole (spanning 10S to 30N) that crossed the central meridian on December 17. Geomagnetic conditions decreased to quiet conditions both globally and locally (Kp and K_Bel 1 to 2) on December 21. However, at the end of the week, it increased to unsettled conditions (Kp and K_Bel 3) due to the slight disturbances in the solar wind parameters.
Noticeable Solar Events
| DAY | BEGIN | MAX | END | LOC | XRAY | OP | 10CM | TYPE | Cat | NOAA |
| 21 | 0519 | 0538 | 0549 | S12W61 | M4.2 | 1N | III/1 | 89 | 3519 | |
| 21 | 2342 | 0004 | 0019 | M3.3 | 89 | 3519 | ||||
| 24 | 1109 | 1118 | 1124 | S20W27 | M2.9 | 1N | III/2 | 1 | 3529 | |
| 24 | 1637 | 1649 | 1656 | S17W33 | M2.6 | 1F | CTM/1 | 1 | 3529 | |
| 24 | 1921 | 1951 | 2016 | M1.1 |
| LOC: approximate heliographic location | TYPE: radio burst type |
| XRAY: X-ray flare class | Cat: Catania sunspot group number |
| OP: optical flare class | NOAA: NOAA active region number |
| 10CM: peak 10 cm radio flux |
PROBA2 Observations (18 Dec 2023 - 24 Dec 2023)
Solar Activity
Solar flare activity fluctuated from low to moderate during the week.
In order to view the activity of this week in more detail, we suggest to go to the following website from which all the daily (normal and difference) movies can be accessed: https://proba2.oma.be/ssa
This page also lists the recorded flaring events.
A weekly overview movie can be found here (SWAP week 717).
https://proba2.sidc.be/swap/data/mpg/movies/weekly_movies/weekly_movie_2023_12_18.mp4
Details about some of this week's events can be found further below.
If any of the linked movies are unavailable they can be found in the P2SC movie repository here
https://proba2.oma.be/swap/data/mpg/movies/
Thursday Dec 21

The biggest flare of the week is a M4.2 flare. It has been produced around 5:39 UT by the NOAA active region 3519 located in the South West part of the solar disk close to the limb (S12W61).
Find a SWAP movie of the event here. https://proba2.sidc.be/swap/data/mpg/movies/20231221_swap_movie.mp4
Geomagnetic Observations in Belgium
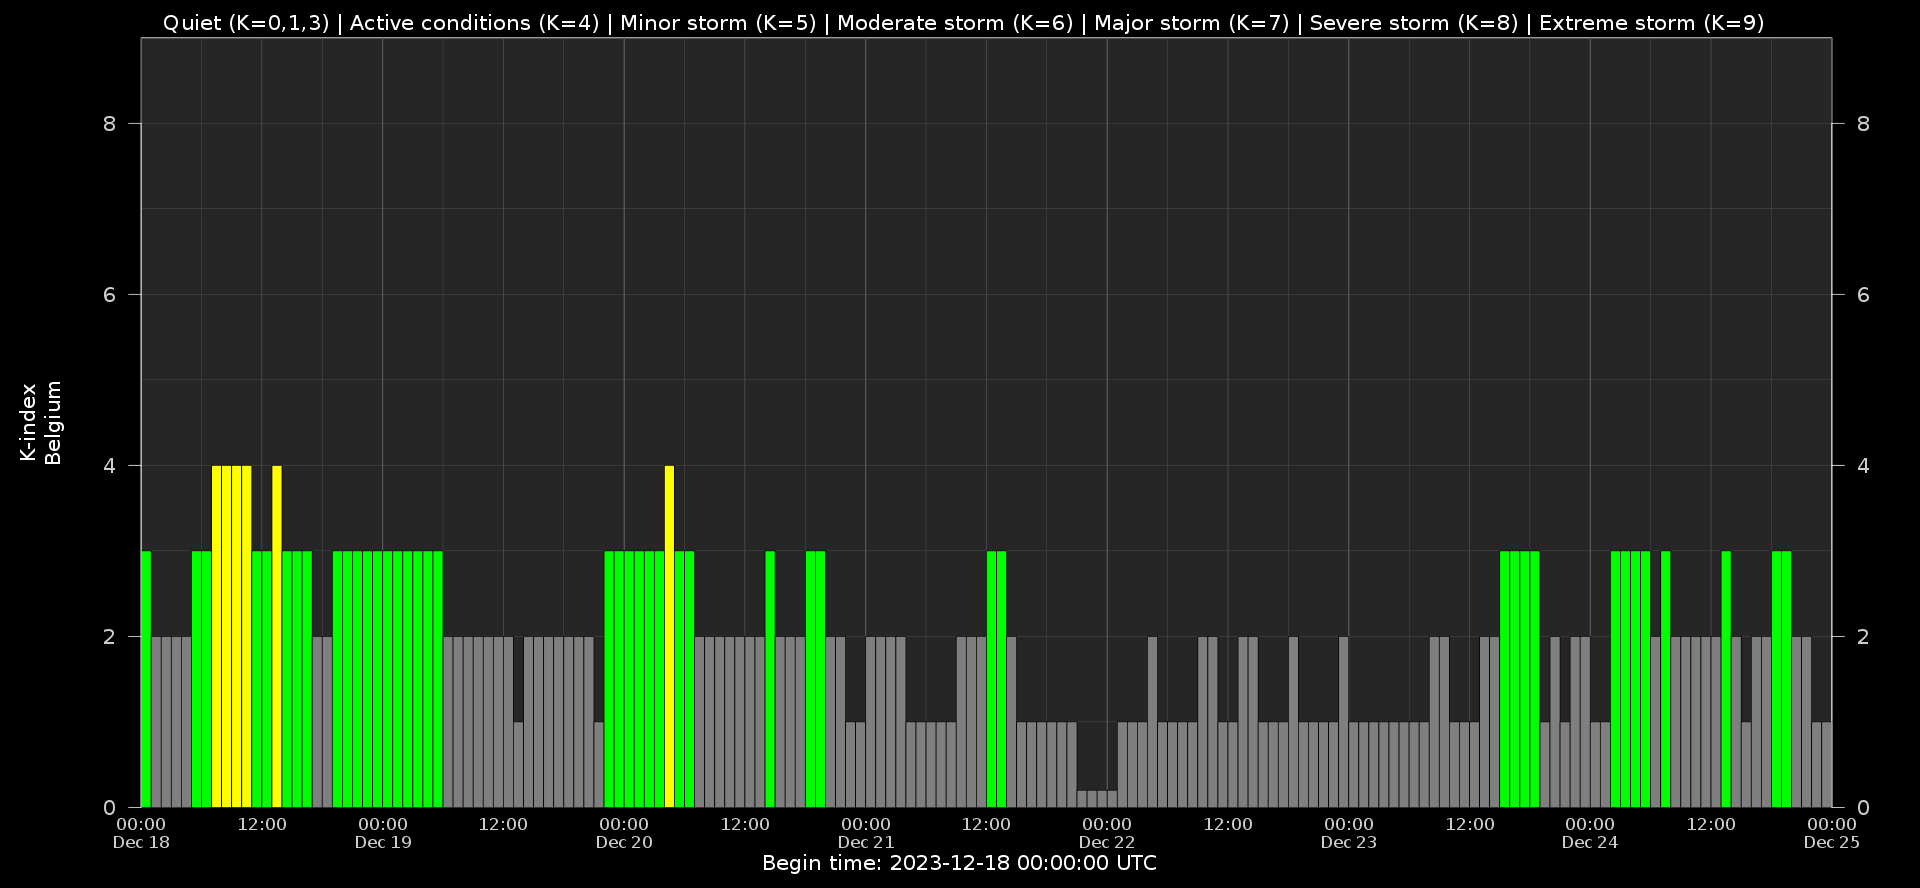
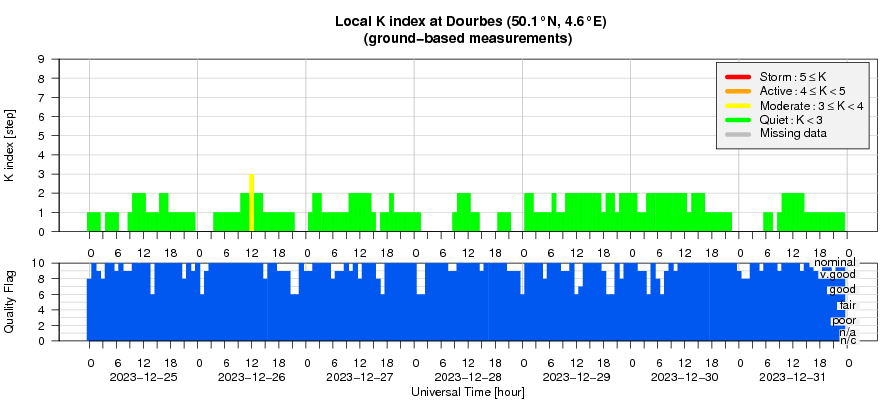
Local K-type magnetic activity index for Belgium based on data from Dourbes (DOU) and Manhay (MAB). Comparing the data from both measurement stations allows to reliably remove outliers from the magnetic data. At the same time the operational service availability is improved: whenever data from one observatory is not available, the single-station index obtained from the other can be used as a fallback system.
Both the two-station index and the single station indices are available here: http://ionosphere.meteo.be/geomagnetism/K_BEL/
The SIDC Space Weather Briefing (18 Dec 2023 - 24 Dec 2023)
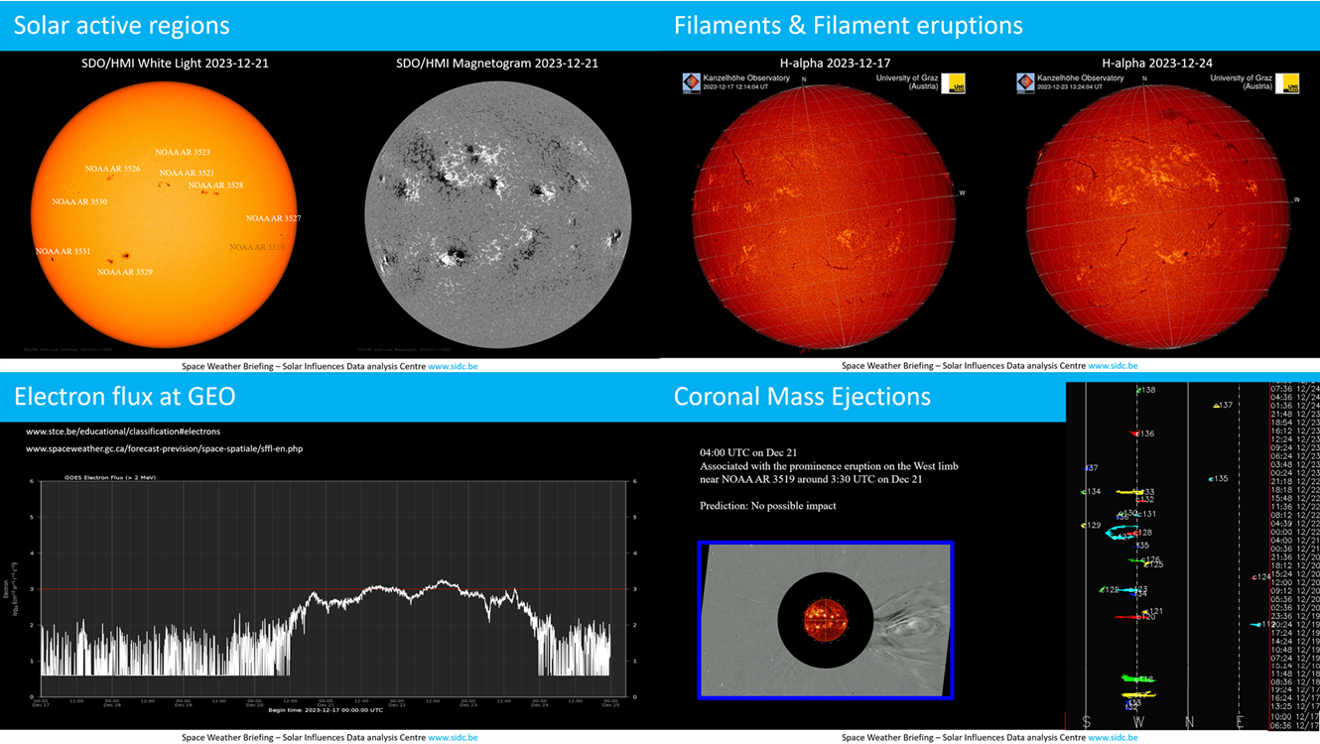
The Space Weather Briefing presented by the forecaster on duty from December 18 to 24. It reflects in images and graphs what is written in the space weather report: https://www.stce.be/briefings/20231225_SWbriefing.pdf
If you need to access the movies, contact us: stce_coordination at stce.be
Review of Ionospheric Activity
NEW! The time series below illustrates (in green) the VTEC deviation from normal quiet behaviour.
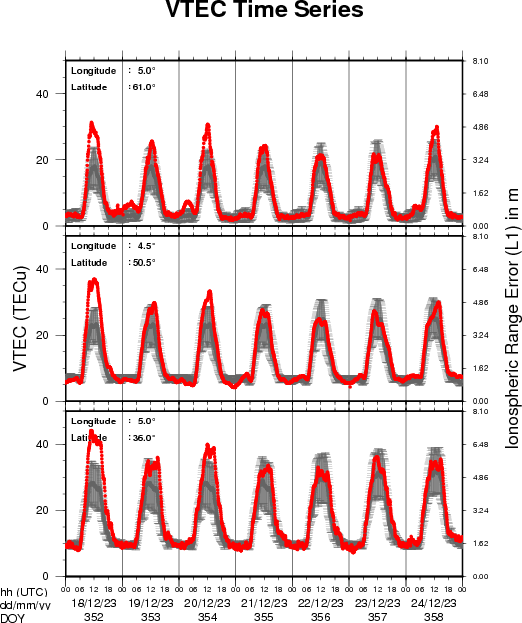

VTEC time series at 3 locations in Europe from 18 Dec 2023 till 24 Dec 2023
The top figure shows the time evolution of the Vertical Total Electron Content (VTEC) (in red) during the last week at three locations:
a) in the northern part of Europe(N 61deg E 5deg)
b) above Brussels(N 50.5deg, E 4.5 deg)
c) in the southern part of Europe(N 36 deg, E 5deg)
This top figure also shows (in grey) the normal ionospheric behaviour expected based on the median VTEC from the 15 previous days.
The time series below shows the VTEC difference (in green) and relative difference (in blue) with respect to the median of the last 15 days in the North, Mid (above Brussels) and South of Europe. It thus illustrates the VTEC deviation from normal quiet behaviour.
The VTEC is expressed in TECu (with TECu=10^16 electrons per square meter) and is directly related to the signal propagation delay due to the ionosphere (in figure: delay on GPS L1 frequency).
The Sun's radiation ionizes the Earth's upper atmosphere, the ionosphere, located from about 60km to 1000km above the Earth's surface.The ionization process in the ionosphere produces ions and free electrons. These electrons perturb the propagation of the GNSS (Global Navigation Satellite System) signals by inducing a so-called ionospheric delay.
See http://stce.be/newsletter/GNSS_final.pdf for some more explanations; for more information, see https://gnss.be/SpaceWeather
Review of Space Weather (25 Dec 2023 - 31 Dec 2023)
Solar Active Regions (ARs) and flares
The solar flaring activity over the past week was at low to moderate levels with background C-class flaring and 3 low M-class flares, the strongest being an M2.6 flare with peak time 16:49 UTC on December 24 produced by NOAA AR 3529 (beta-gamma). There were eleven active regions on the visible solar disc facing Earth, the most notable ones being NOAA AR 3529 and NOAA 3530, which produced the majority of the observed C-class flares. Other notable regions that contributed to the low levels of activity were NOAA AR 3528, NOAA AR 3533, and NOAA AR 3534. Towards the end of the week the flaring activity was dominated by a returning active region, NOAA AR 3536 (beta-delta), which later produced an impulsive X5-flare at the beginning of the next forecasting week with peak time 21:55 UTC on December 31.
Coronal mass ejections
The solar surface was streaked with filaments and three were multiple notable filament eruptions. Several of them had associated partial or full halo coronal mass ejections (CMEs) with prominent coronal dimming and an Earth-directed component.
- The first lift-off of a CME with a possible Earth-directed component was visible in the LASCO/C2 coronagraph images before UTC noon on December 24 with a second CME launching around 15:48 UTC on December 24. These CMEs were expected to show a combined mild glancing blow arrival on December 27.
- A faint and slow halo CME was visible in the LASCO C2 coronagraph images starting around 08:48 UTC on December 25. The CME had an estimated projected velocity below 300 km/s and appeared to be related to a long-duration filament eruption to the north-east from NOAA AR 3533. In view of the slow and weak CME signatures no notable effect on Earth was expected related to this CME arrival.
- A slow partial halo CME with projected velocity around 400 km/s was observed by the LASCO/C2 coronagraph around 03:24 UTC on December 27. A faster north-east partial halo CME was visible in the LASCO/C2 coronagraph imagery around 23:24 UTC on December 28. Both CMEs showed no clear on disc signatures and are deemed to be back-sided with no expected impact on Earth.
- Another partial halo CME was detected in the LASCO/C2 imagery first lifting off the solar surface around 07:48 UTC on December 30. The CME was associated with a small filament eruption in the south-east quadrant and related to a long-duration C2.6 flaring from NOAA AR 3534 (beta). A coronal dimming was observed in the SDO/AIA images after 08:00 UTC on December 30. The nature of the filament eruption and lack of STEREO coronagraph data made it difficult to accurately estimate the CME speed, but the average projected velocity was found to be around 400 km/s. Small chances for a minor glancing blow from this CME were given with a possible mild impact on Earth in the UTC night of January 2 or UTC morning of January 3.
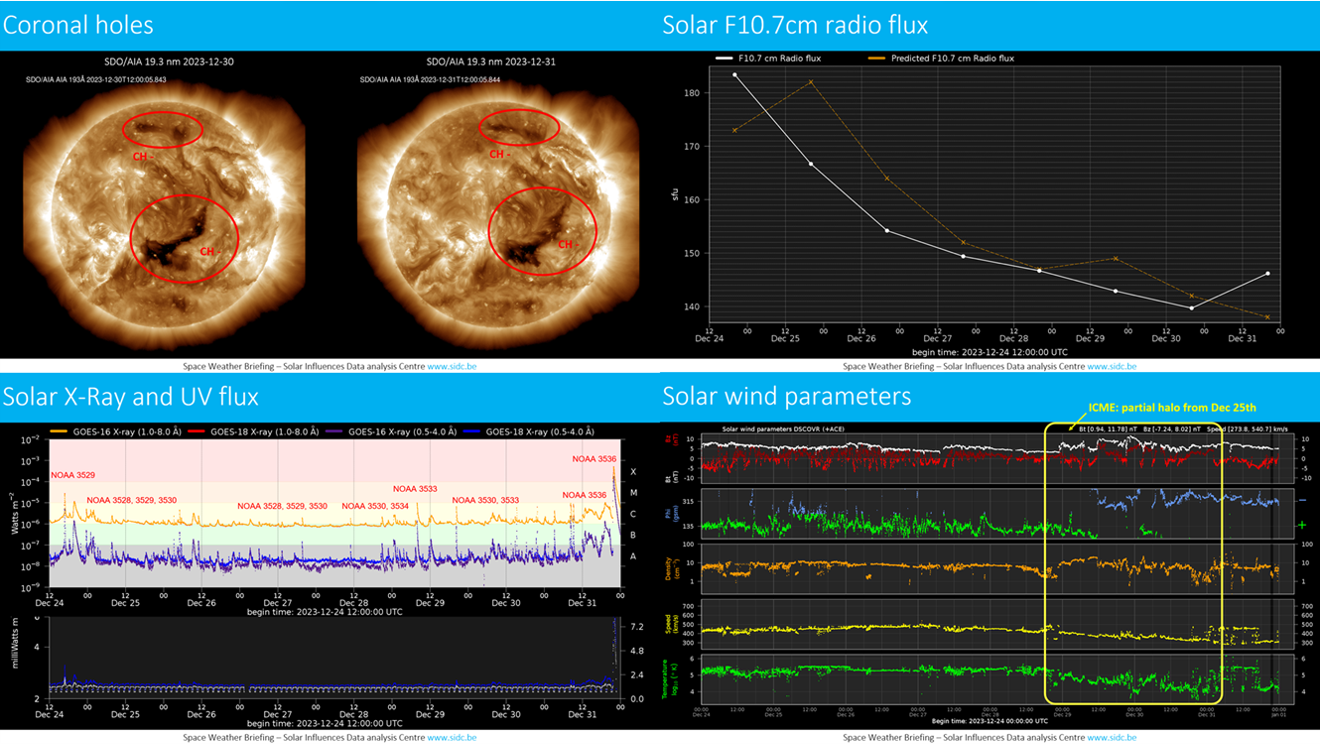
Coronal holes
A long negative polarity coronal hole spreading from the equatorial bands to mid-latitudes in the southern hemisphere and high latitudes in the northern hemisphere reached the central meridian on December 28. It resided on the central meridian for a few days. A related high speed stream was expected to arrive to Earth as early as December 31 and influence the near-Earth solar wind parameters for several days.
Proton flux levels
The greater than 10 MeV proton flux was below radiation storm levels (below 10 pfu) during the entire week.
Electron fluxes at GEO
The greater than 2 MeV electron flux was below the 1000 pfu threshold throughout the entire week. The corresponding electron fluence was at nominal levels.
Solar wind
The week started with a weakly disturbed nominal slow solar wind conditions and remained at slow solar conditions until a mild ICME arrival on late December 28-29. The solar wind velocity varied in the range of 274 km/s to 546 km/s. The interplanetary magnetic field (B) reached a maximum of 11 nT with a minimum Bz of -7 nT. The B field was predominantly in the positive sector (directed away from the Sun) throughout December 29 and switched to the negative sector (directed towards the Sun) thereafter.
Geomagnetism
The geomagnetic conditions throughout the week were mostly quiet with isolated unsettled periods due to slow solar wind structures and a very mild influence of the weak and faint halo CME from December 25, which arrived to Earth on December 29.
Noticeable Solar Events
| DAY | BEGIN | MAX | END | LOC | XRAY | OP | 10CM | TYPE | Cat | NOAA |
| 31 | 1844 | 1912 | 1940 | M1.0 | 3536 | |||||
| 31 | 2136 | 2155 | 2208 | X5.0 | I/1/2 | 3536 |
| LOC: approximate heliographic location | TYPE: radio burst type |
| XRAY: X-ray flare class | Cat: Catania sunspot group number |
| OP: optical flare class | NOAA: NOAA active region number |
| 10CM: peak 10 cm radio flux |
PROBA2 Observations (25 Dec 2023 - 31 Dec 2023)
Solar Activity
Solar flare activity fluctuated from low to high during the week.
In order to view the activity of this week in more detail, we suggest to go to the following website from which all the daily (normal and difference) movies can be accessed: https://proba2.oma.be/ssa
This page also lists the recorded flaring events.
A weekly overview movie can be found here (SWAP week 718). https://proba2.sidc.be/swap/data/mpg/movies/weekly_movies/weekly_movie_2023_12_25.mp4
Details about some of this week’s events can be found further below.
If any of the linked movies are unavailable they can be found in the P2SC movie repository here https://proba2.oma.be/swap/data/mpg/movies/
Sunday Dec 31
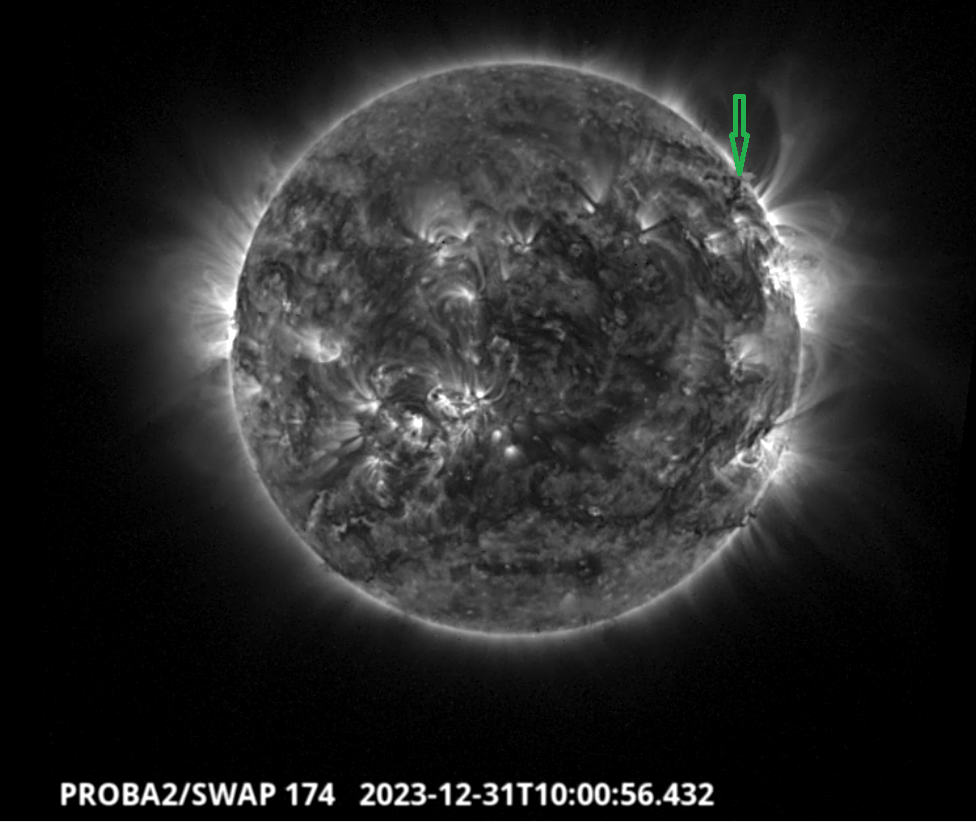
Around 10:00 UT, a filament erupted in the North West part of the solar disk close to the active region 3533. It gave rise to a significant reconfiguration of the local magnetic field topology. Find a SWAP movie of the event here. https://proba2.sidc.be/swap/data/mpg/movies/20231231_swap_movie.mp4
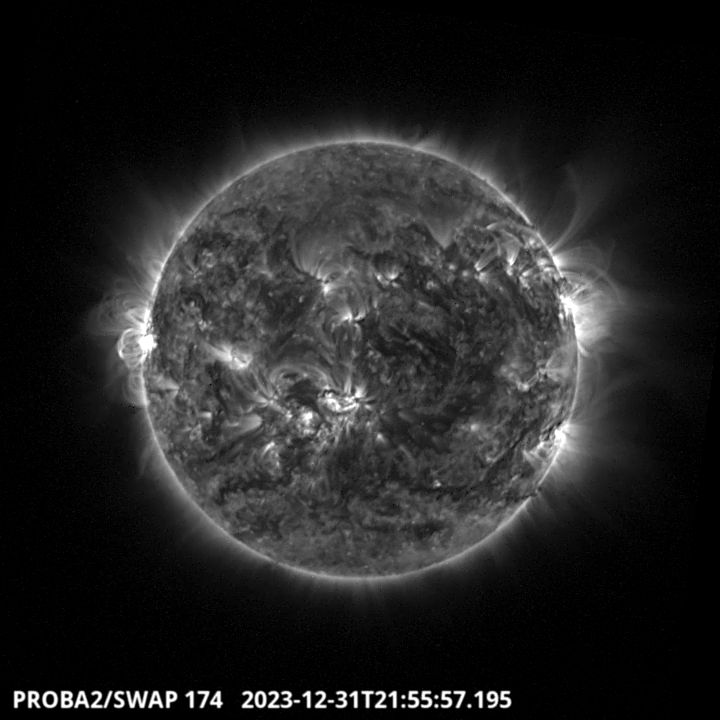
The strongest flare of this solar cycle, a X5.0 flare, was produced around 21:56 UT by the NOAA active region 3536, located on the East solar limb. It triggered a CME. Find a SWAP movie of the event here. https://proba2.sidc.be/swap/data/mpg/movies/20231231_swap_movie.mp4
Geomagnetic Observations at Dourbes
The SIDC Space Weather Briefing (25 Dec 2023 - 31 Dec 2023)
The Space Weather Briefing presented by the forecaster on duty from December 25 to 31. It reflects in images and graphs what is written in the space weather report: https://www.stce.be/briefings/20240101_SWbriefing.pdf
If you need to access the movies, contact us: stce_coordination at stce.be
STCE calendar
Check out our calendar with activities and encounters with the Sun-Space-Earth system and Space Weather as the main theme. We provide occasions to get submerged in our world through educational, informative and instructive activities. If you want your event in our calendar, contact us: stce_coordination at stce.be
* January 22-24, 2024, STCE Space Weather Introductory Course, Brussels, Belgium - Registrations are open
* January 25, 2024, post-Space Weather Introductory Course, by JMG and MeteoWing, place TBD - registration is included in the Jan SWIC
* March 4-5, 2024, STCE Space Weather Introductory Course, focus on aviation, online - Registrations are open
* April 22-24, 2024, STCE Space Weather Introductory Course, Brussels, Belgium - Registrations are open
More info needed? Contact us: stce_coordination at stce.be
Check: https://www.stce.be/calendar