- Table of Content
- 1.Getting ready ...
- 2.Topical Issue ...
- 3.Review of sola...
- 4.International ...
- 5.PROBA2 Observa...
- 6.Noticeable Sol...
- 7.Geomagnetic Ob...
- 8.Review of Iono...
- 9.The SIDC Space...
- 10.STCE Activitie...
2. Topical Issue on solar wind
3. Review of solar and geomagnetic activity
4. International Sunspot Number by SILSO
5. PROBA2 Observations
6. Noticeable Solar Events
7. Geomagnetic Observations in Belgium
8. Review of Ionospheric Activity
9. The SIDC Space Weather Briefing
10. STCE Activities
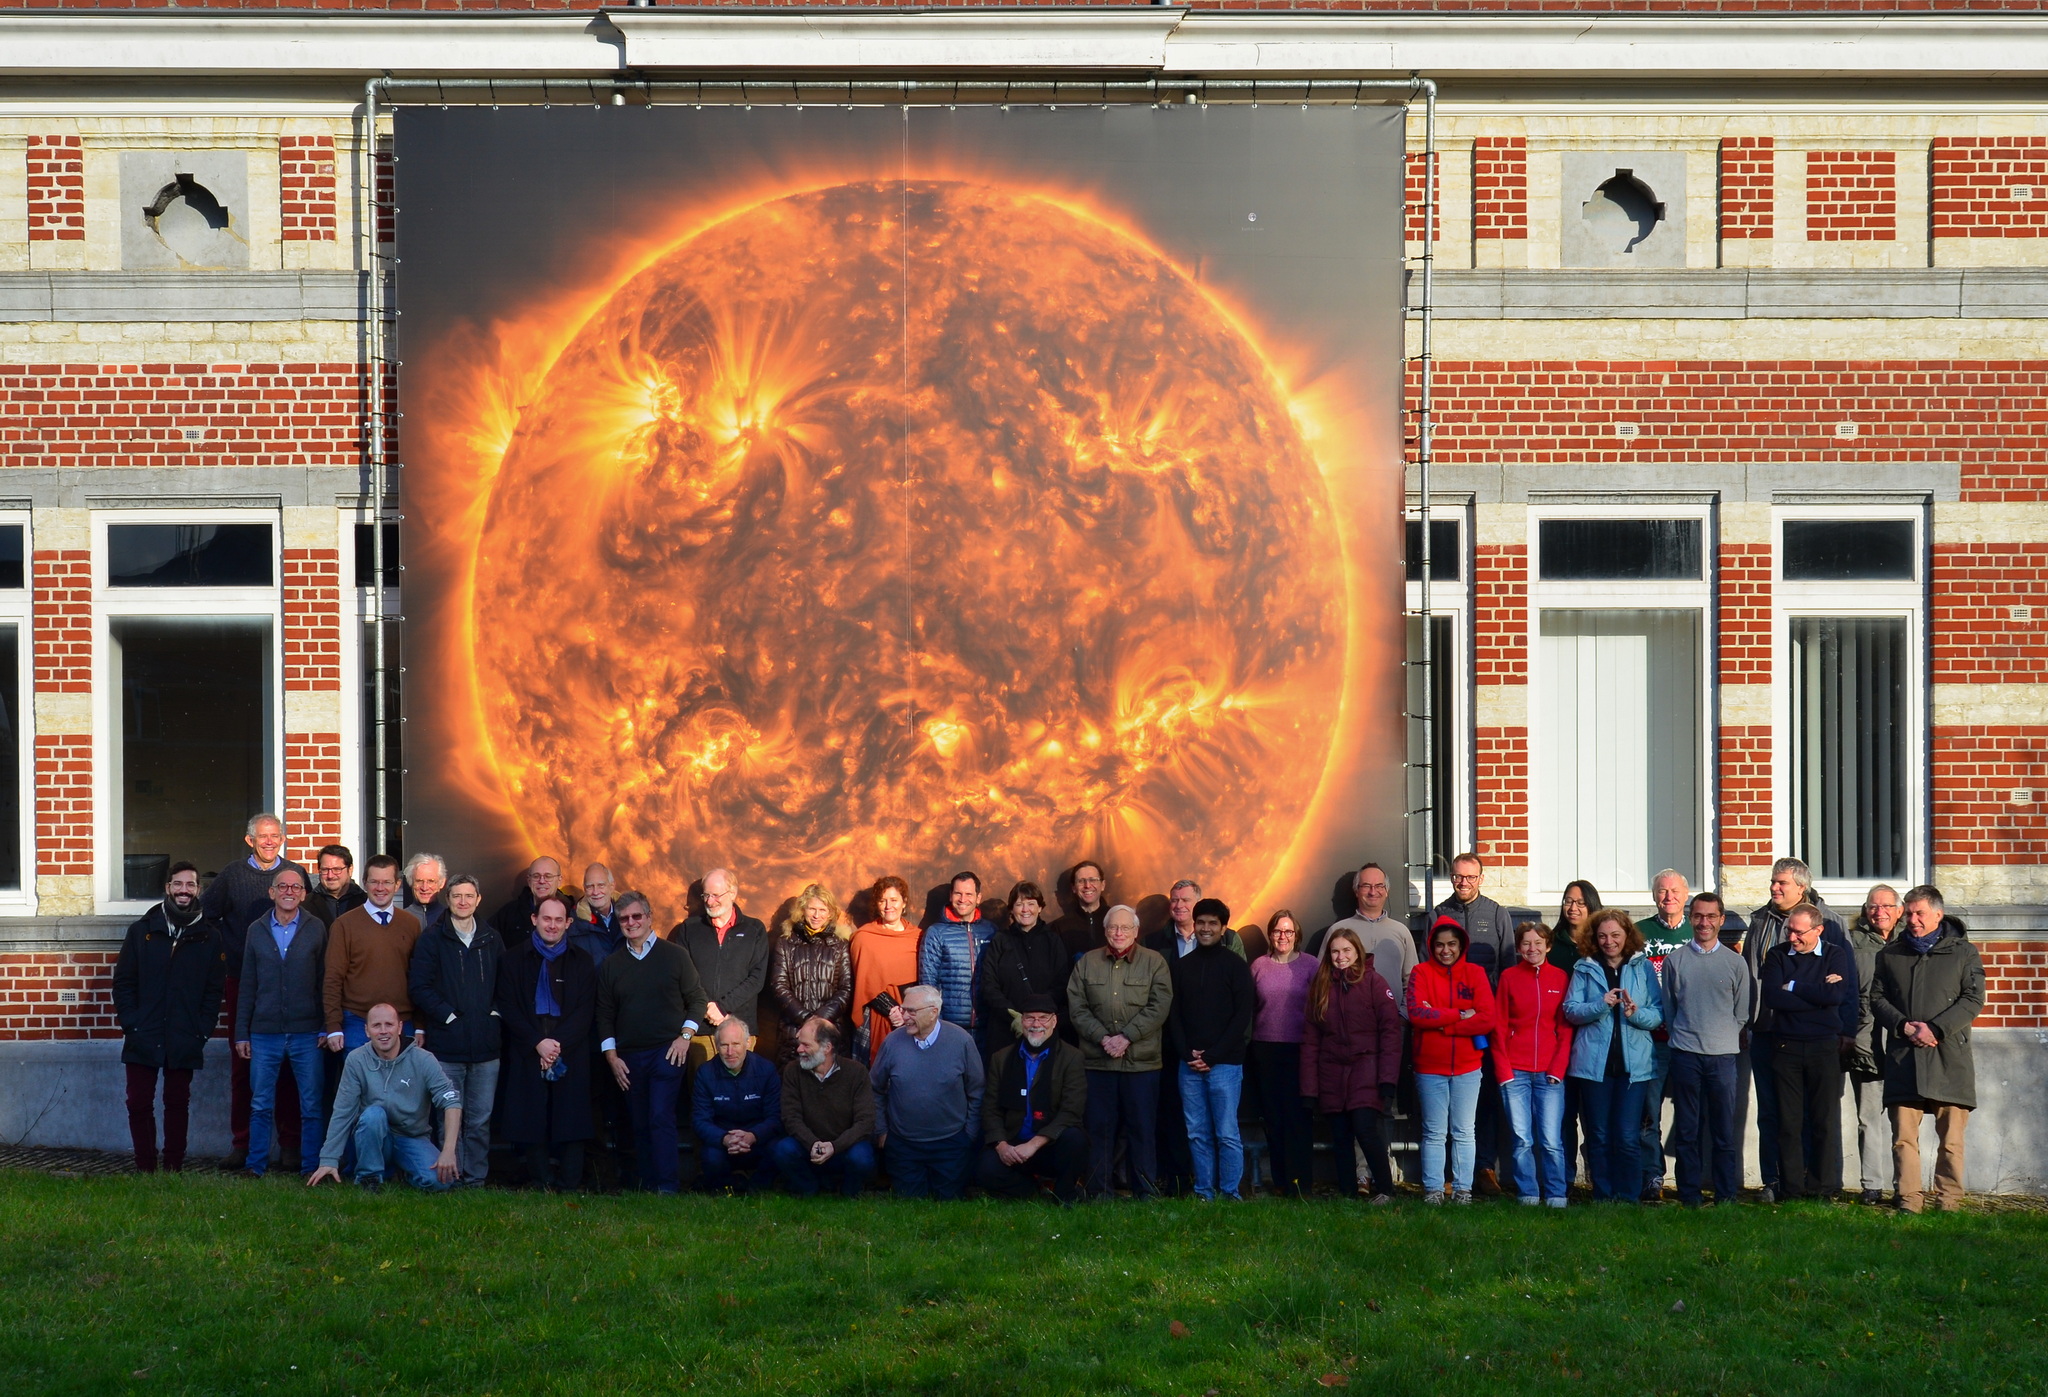
Getting ready for Proba-3
In November 2023, the Proba-3 Science Working Team (SWT) gathered at the STCE premises in Brussels.
Proba-3 is planned for launch next year and will be the first ever precision formation flying mission. It consists of two small satellites launched together that will fly in tandem to create a solar eclipse. The paired satellites will together form a 150-m long solar coronagraph to study the Sun’s faint corona closer to the solar rim than has ever before been achieved.
In the final stretch to launch, the satellites are undergoing integration at Redwire in Antwerp. The Proba-3 Science Working Team took this opportunity to see them with their own eyes one last time.
After the visit to Redwire, the scientists and engineers moved to the Royal Observatory of Belgium for a 3-day meeting filled with engaging discussions on future observations, data analysis and calibration, joined campaigns with other missions and science results.
More details from ESA on the visit to Redwire: https://www.esa.int/Enabling_Support/Space_Engineering_Technology/Proba_Missions/Face_to_face_with_Sun-eclipsing_Proba-3
Topical Issue on solar wind
The Journal of Space Weather and Space Climate (JSWSC - https://www.swsc-journal.org/) opens a Topical Issue on "Fast and slow solar winds: Origin, evolution and Space Weather effects" with a submission deadline of 31 October 2024.
The topical issue (TI) is dedicated to the nuanced exploration of Heliospheric Solar-Wind Dynamics and their implications for Space Weather. This issue seeks to bring together cutting-edge studies that shed light on the complex interplay between slow and fast solar winds, their effects on geomagnetic activity, and the propagation of solar transients.
The heliospheric solar-wind structure, arising from the intricate interplay between slow and fast winds, constitutes the primary instigator of minor to moderate geomagnetic activity. Furthermore, it serves as the medium for the propagation of other solar transients. Stream interaction and co-rotating interaction regions are prolific sources of shocks, compression, and rarefaction regions, well-established contributors to recurrent geomagnetic effects on Earth. In light of these dynamics, a comprehensive understanding of the heliospheric solar wind, ambient magnetic field, and their origins is indispensable for the validation and enhancement of Space Weather forecasting efforts. The objective of this TI is to collect and present new studies on the origin, evolution, and Space-Weather effects of both fast and slow solar winds using observational data and modeling approaches. Recent missions, such as the Parker Solar Probe and Solar Orbiter, in conjunction with established missions like the Solar Dynamics Observatory and the Solar Terrestrial Relations Observatories, offer a wealth of information. This data presents an invaluable opportunity to validate, refine, and augment existing knowledge in the solar wind domain.
This Topical Issue arises from the session CD-02 "All About the Solar Wind", held during the European Space Weather Week 2023 (ESWW2023) in Toulouse. However, contributions to this TI are not limited to participants of the ESWW2023. The TI will be open to all submissions that fit its scope. Submissions are encouraged, focusing on solar wind sources for both slow and fast winds, mechanisms of solar wind acceleration/outflow, dynamics of stream interaction, and the configuration of the magnetic field and plasma topology at the source surface and within the inner heliosphere. The integration of observations and models is particularly welcomed, fostering a deeper understanding of solar and heliospheric physics within the context of space weather.
Manuscripts must be submitted via the JSWSC online submission tool. Guidelines for submission of papers are found on the JSWSC website under the tab "Instruction for Authors" (https://www.swsc-journal.org/author-information/instructions-for-authors ).
Deadline: 31 October 2024
All manuscripts will be peer-reviewed according to the quality standards of international scientific journals. The type of contributions must fit the style of JSWSC. All manuscripts should contain enough new insight, present the results against a properly referenced background of existing work, and present adequate evidence that supports the conclusions. Accepted papers are published in electronic format only, and are freely available to everyone via the JSWSC website. JSWSC offers the possibility to include electronic material, such as animations, movies, codes and data.
Topical Editor in Chief (T-EiC):
Stephan G. Heinemann (stephan.heinemann(аt)helsinki.fi), University of Helsinki, Finland
Topical Editors:
Eleanna Asvestari (eleanna.asvestari(аt)helsinki.fi), University of Helsinki, Finland
Matt Owens (m.j.owens(аt)reading.ac.uk), University of Reading, UK
Krzysztof Barczynski (krzysztof.barczynski(аt)pmodwrc.ch), ETH Zurich and PMOD/WRC Davos, Switzerland
For questions regarding this Topical Issue, please, contact the T-EiC. For questions concerning the submission process, the Editorial Office (jswsc(аt)edpsciences.org) should be contacted.
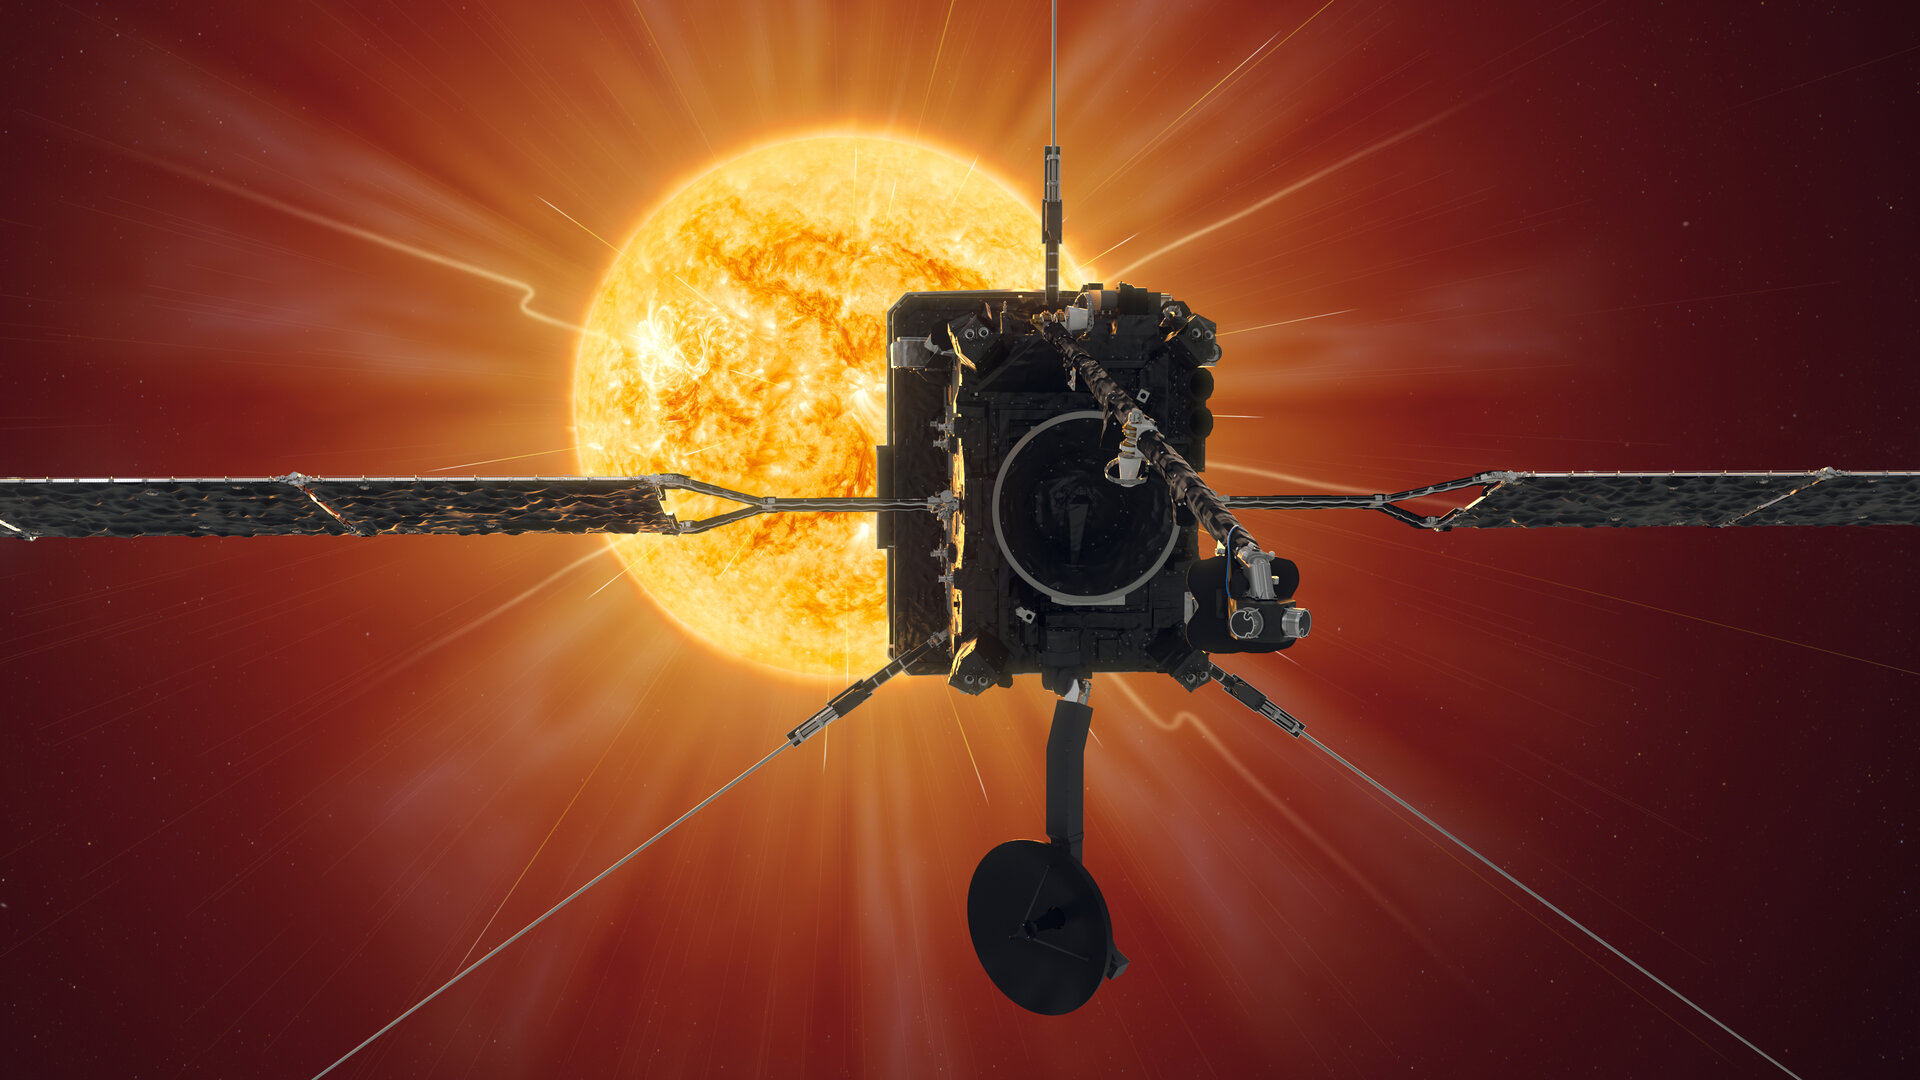
Credits: ESA - Work performed by ATG medialab under contract for ESA, CC BY-SA 3.0 IGO
Review of solar and geomagnetic activity
WEEK 1201 from 2024 Jan 01
Solar Active Regions (ARs) and flares
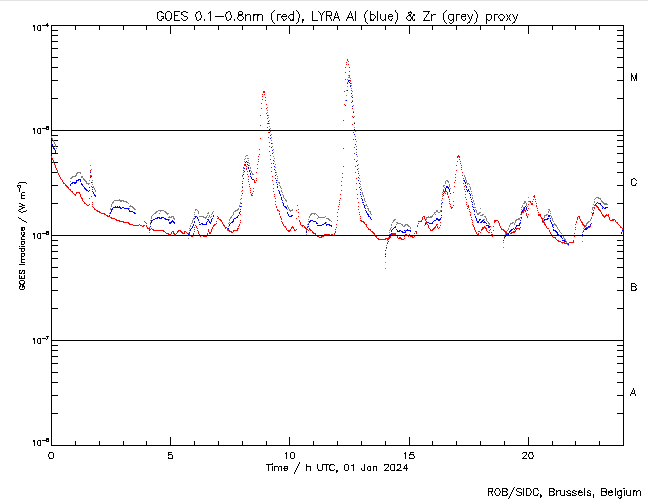
Solar flaring activity over the past week started at high to moderate levels on January 01 and then to low levels on January 04 until the end of the week. There were 12 active regions visible throughout the week. 49 C-class flares, 5 M-class flares and 1 X-class flare were recorded, the strongest being a X5.0-flare with peak time 21:55 UTC on December 31, associated with NOAA AR 3536.
From the start of the week until January 04 most of the flaring activity came from NOAA AR 3536. In the second part of the week most of the flaring activity came from NOAA AR 3536, NOAA AR 3538 and NOAA AR 3540. At the start of the week only 3 active regions were on the visible disk, yet at the end of the week the number had increased to 10 due to active regions emerging and rotating onto the visible disk.
Coronal mass ejections
There were multiple filament eruptions during the week and four Coronal Mass Ejections (CME)s, with a potential glancing blow impact at Earth.
The first CME was detected in LASCO C2 data at 09:48 UTC on December 31. This CME is associated with a filament eruption, observed at 09:38 UTC on December 31, in SDO/AIA 304 and 193 in the north-west quadrant of the visible solar disk.
A second CME was detected at 22:00 UTC on December 31, in LASCO C2 data. This CME is associated with an X5.0-flare, with peak time 21:55 UTC on December 31.
A third CME was detected in LASCO C2 data at 02:00 UTC on January 05 this CME was associated with an eruption, observed at 00:38 on January 05, in SDO/AIA 304 and 193.
A fourth CME, was detected at 15:12 UTC on January 06, in LASCO C2 data. This CME is associated with a filament eruption observed in SDO/AIA 304 and 193 in the north-east quadrant of the Sun at 14:50 UTC on January 06.
Coronal Holes
A large negative polarity coronal hole passed the central meridian in the beginning of the week and the Earth was under the influence of a high-speed stream from this coronal hole from January 02 until January 04.
A high latitude small negative polarity coronal hole passed the central meridian on January 01. On January 06, two high latitude small positive polarity coronal holes passed the central meridian as well as a large positive polarity coronal hole. No high-speed streams from these coronal holes impacted the Earth this week.
Proton flux levels
At the start of the week 10 MeV proton flux became enhanced and gradually increased until it crossed the 10 pfu threshold at 20:00 UTC on January 03. It peaked on January 04 and decreased below this threshold at 01:40 UTC on January 05. It continued to gradually decrease until the end of the week. This proton event is associated with NOAA AR 3536 and its activity.
Electron fluxes at GEO
The greater than 2 MeV electron flux measured by GOES-16 was at background levels throughout the week. The 24h electron fluence was at nominal levels throughout the week.
Solar wind
At the beginning of the week the solar wind parameters registered nominal slow solar wind conditions. On January 02 the Earth came under the influence a high-speed stream associated with a negative polarity coronal hole, which crossed the central meridian on January 01. The solar wind speed jumped from around 360 km/s to around 420 km/s at 01:24 UTC on January 02. The interplanetary magnetic field fluctuated between 5 nT to 12 nT, with a minimum Bz value of -11 nT.
On January 03, the solar wind parameters showed two shocks. On the first shock the solar wind speed jumped from 410 km/s to 460 km/s, and the interplanetary magnetic field jumped from 7nT to 12 nT at 04:50. On the second shock at 14:25 the magnetic field jumped from 5 to 10 nT, and the solar wind speed jumped from 420 to 450 km/s and then more gradually increased to 480 km/s. It’s likely that these shocks mark the arrival of ICMEs from the 30 and 31 of December.
On January 05, the solar wind parameters returned to slow solar wind conditions until the end of the week.
The phi-angle was mainly in the negative sector (directed towards the Sun) with periods in the positive sector throughout the week.
Geomagnetism
The geomagnetic conditions over the past week reached active conditions globally and locally (Kp 4 and K Bel 4) under the influence of a high-speed stream from January 01 until January 04. They were quiet for the rest of the week.
International Sunspot Number by SILSO
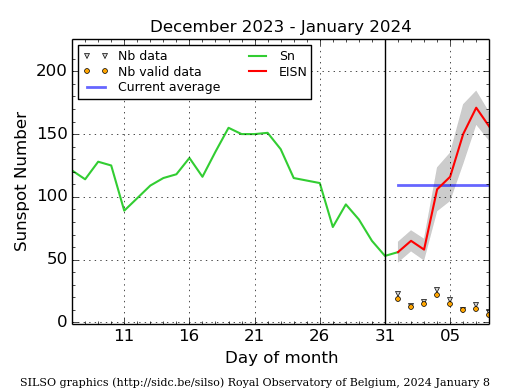
The daily Estimated International Sunspot Number (EISN, red curve with shaded error) derived by a simplified method from real-time data from the worldwide SILSO network. It extends the official Sunspot Number from the full processing of the preceding month (green line), a few days more than one solar rotation. The horizontal blue line shows the current monthly average. The yellow dots give the number of stations that provided valid data. Valid data are used to calculate the EISN. The triangle gives the number of stations providing data. When a triangle and a yellow dot coincide, it means that all the data is used to calculate the EISN of that day.
PROBA2 Observations
Solar Activity
Solar flare activity fluctuated from low to moderate during the week.
In order to view the activity of this week in more detail, we suggest to go to the following website from which all the daily (normal and difference) movies can be accessed: https://proba2.oma.be/ssa
This page also lists the recorded flaring events.
A weekly overview movie can be found here (SWAP week 719): https://proba2.sidc.be/swap/data/mpg/movies/weekly_movies/weekly_movie_2024_01_01.mp4
Details about some of this week's events can be found further below.
If any of the linked movies are unavailable they can be found in the P2SC movie repository here https://proba2.oma.be/swap/data/mpg/movies/
Monday Jan 01
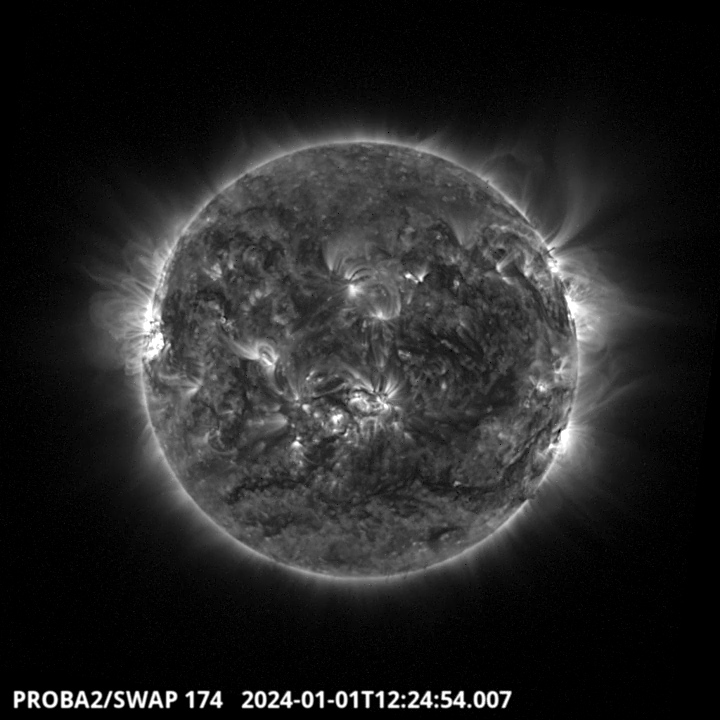
An M4.7 flare was observed around 12:25 UT from active region 3536. This AR was located on the East part of the solar disk. Find a SWAP movie of the event here: https://proba2.sidc.be/swap/data/mpg/movies/20240101_swap_movie.mp4
Noticeable Solar Events
| DAY | BEGIN | MAX | END | LOC | XRAY | OP | 10CM | TYPE | Cat | NOAA |
| 01 | 0833 | 0854 | 0904 | M2.3 | M/1 | 3536 | ||||
| 01 | 1154 | 1225 | 1235 | M4.7 | 3536 | |||||
| 02 | 1802 | 1830 | 1856 | M1.1 | 14 | 3536 | ||||
| 04 | 0108 | 0116 | 0122 | M1.1 | 14 | 3536 | ||||
| 04 | 0122 | 0155 | 0212 | M3.8 | N | 14 | 3536 |
| LOC: approximate heliographic location | TYPE: radio burst type |
| XRAY: X-ray flare class | Cat: Catania sunspot group number |
| OP: optical flare class | NOAA: NOAA active region number |
| 10CM: peak 10 cm radio flux |
Geomagnetic Observations in Belgium
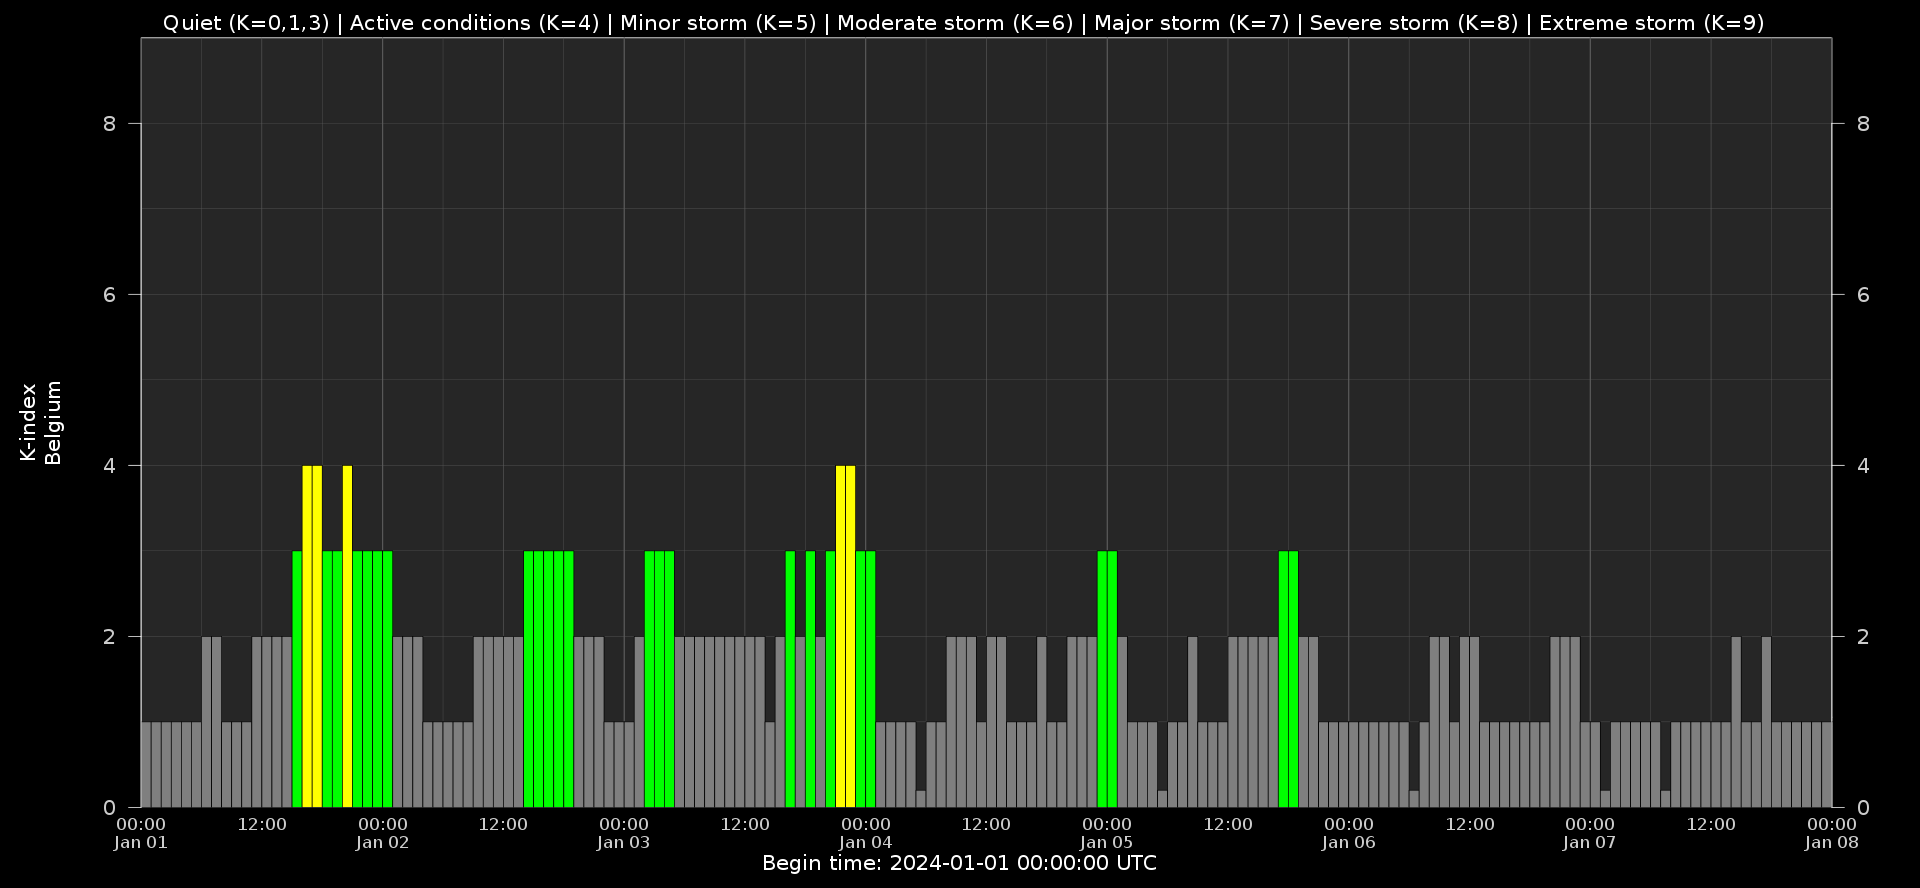
Local K-type magnetic activity index for Belgium based on data from Dourbes (DOU) and Manhay (MAB). Comparing the data from both measurement stations allows to reliably remove outliers from the magnetic data. At the same time the operational service availability is improved: whenever data from one observatory is not available, the single-station index obtained from the other can be used as a fallback system.
Both the two-station index and the single station indices are available here: http://ionosphere.meteo.be/geomagnetism/K_BEL/
Review of Ionospheric Activity
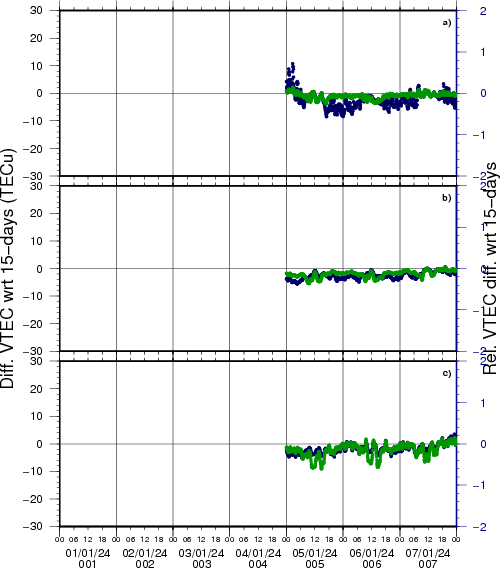
NEW! The time series below illustrates (in green) the VTEC deviation from normal quiet behaviour.
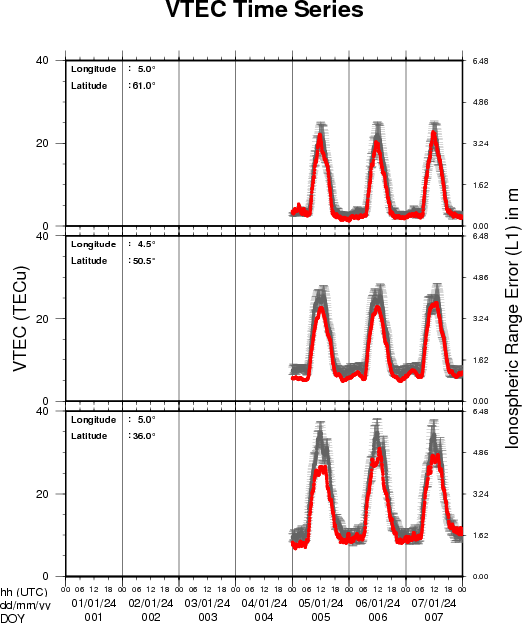
VTEC time series at 3 locations in Europe from 1 Jan 2024 till 7 Jan 2024
The top figure shows the time evolution of the Vertical Total Electron Content (VTEC) (in red) during the last week at three locations:
a) in the northern part of Europe(N 61deg E 5deg)
b) above Brussels(N 50.5deg, E 4.5 deg)
c) in the southern part of Europe(N 36 deg, E 5deg)
This top figure also shows (in grey) the normal ionospheric behaviour expected based on the median VTEC from the 15 previous days.
The time series below shows the VTEC difference (in green) and relative difference (in blue) with respect to the median of the last 15 days in the North, Mid (above Brussels) and South of Europe. It thus illustrates the VTEC deviation from normal quiet behaviour.
The VTEC is expressed in TECu (with TECu=10^16 electrons per square meter) and is directly related to the signal propagation delay due to the ionosphere (in figure: delay on GPS L1 frequency).
The Sun's radiation ionizes the Earth's upper atmosphere, the ionosphere, located from about 60km to 1000km above the Earth's surface.The ionization process in the ionosphere produces ions and free electrons. These electrons perturb the propagation of the GNSS (Global Navigation Satellite System) signals by inducing a so-called ionospheric delay.
See http://stce.be/newsletter/GNSS_final.pdf for some more explanations; for more information, see https://gnss.be/SpaceWeather
The SIDC Space Weather Briefing
The Space Weather Briefing presented by the forecaster on duty from Jan 1 to 7. It reflects in images and graphs what is written in the space weather report: https://www.stce.be/briefings/20240108_SWbriefing

If you need to access the movies, contact us: stce_coordination at stce.be
STCE Activities
Check out our activity calendar: activities and encounters with the Sun-Space-Earth system and Space Weather as the main theme. We provide occasions to get submerged in our world through educational, informative and instructive activities.
If you want your event in our calendar, contact us: stce_coordination at stce.be
* Jan 22-24, 2024, STCE Space Weather Introductory Course, Brussels, Belgium - Registrations are open on https://www.stce.be/
* Jan 25, 2024, post-Space Weather Introductory Course, by JMG and MeteoWing, Brussels, Belgium - registration is included in the Jan SWIC
* Jan 30, 2024, public lecture on solar observations from ground, Urania, Hove, Belgium
* Mar 4-5, 2024, STCE Space Weather Introductory Course, focus on aviation, online - Registrations are open on https://www.stce.be/
* Apr 22-24, 2024, STCE Space Weather Introductory Course, Brussels, Belgium - Registrations are open on https://www.stce.be/
More info needed? Contact us: stce_coordination at stce.be