- Table of Content
- 1.A stunning eru...
- 2.Venues selecte...
- 3.Review of sola...
- 4.International ...
- 5.PROBA2 Observa...
- 6.Noticeable Sol...
- 7.Geomagnetic Ob...
- 8.Review of Iono...
- 9.STCE Activitie...
2. Venues selected for European Space Weather Week 2025 and 2026
3. Review of solar and geomagnetic activity
4. International Sunspot Number by SILSO
5. PROBA2 Observations
6. Noticeable Solar Events
7. Geomagnetic Observations in Belgium
8. Review of Ionospheric Activity
9. STCE Activities
A stunning eruption
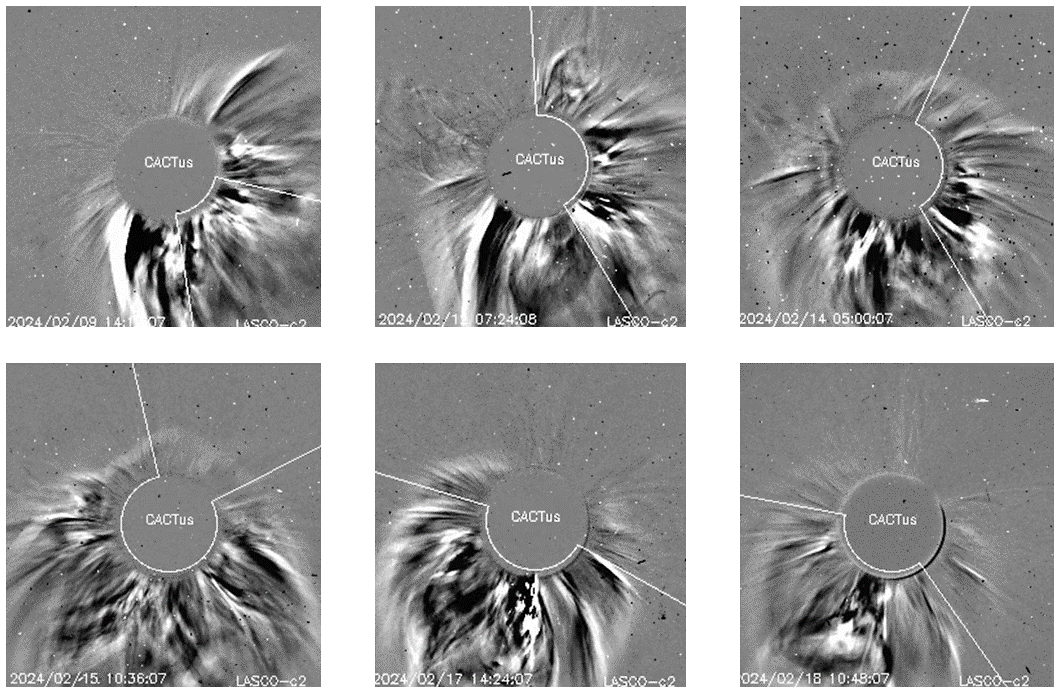
The Sun completed another week of enhanced solar activity with an X2 flare on 16 February (https://www.stce.be/news/685/welcome.html ) and several, mostly farside (partial) halo coronal mass ejections (CMEs - see CACTus at https://www.sidc.be/cactus/ ). A majority of these farside eruptions are thought to originate from NOAA 3575. This complex region rotated over the southwest limb on 8 February, and was the source of an X3 flare a day later (https://www.stce.be/news/683/welcome.html ). This region was located at a high latitude of -37 degrees, which may explain the asymmetry of the observed halo CMEs. The coronagraphic imagery underneath show the most prominent CMEs thought to be associated with eruptions from NOAA 3575 during its farside transit, starting with the CME related to the X3 flare on 9 February, and further eruptions on 12, 14, 15, 17 and 18 February. One can really "track" NOAA 3575 just from these eruptions, and the region is expected to round the southeast limb on 21 or 22 February.
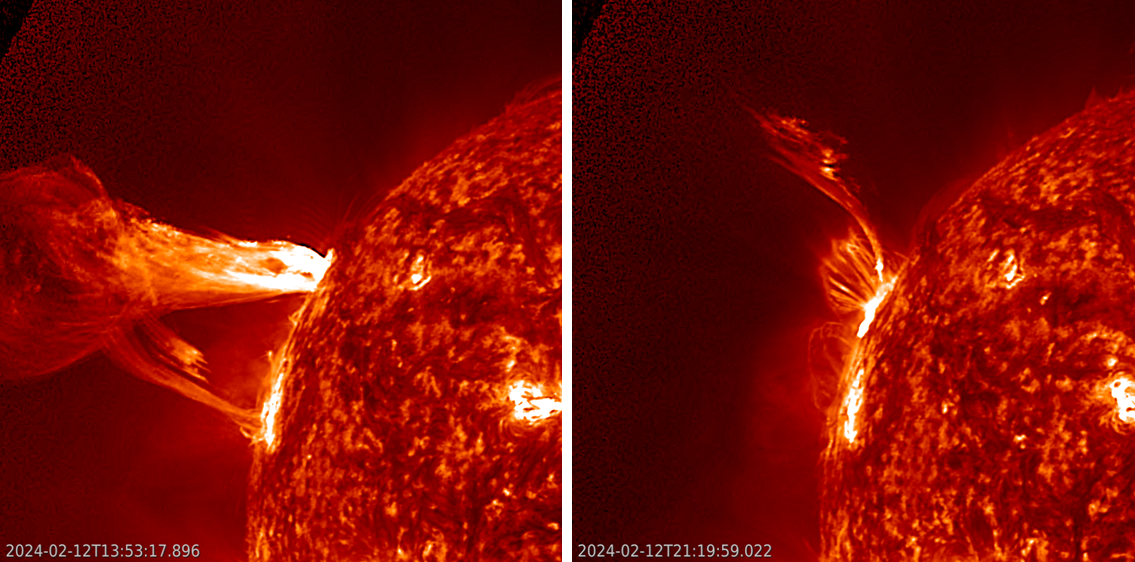
However, one of the most eye-pleasing eruptions took place on 12 February and was not related to NOAA 3575 activity. The event consisted of a prominence eruption near the northeast limb around noon on 12 February, followed by another eruption in a region a bit beyond the solar limb around 21:00 UTC on the same day. Solar prominences are clouds of charged particles ("plasma") above the solar surface squeezed between magnetic regions of opposite polarity. Being cooler and denser than the plasma underneath and their surroundings, they appear as bright blobs when seen near the solar limb and as dark lines when seen on the solar disk (then they are called "filaments"). Special filters are required to observe prominences. In extreme ultraviolet (EUV) passbands, they may appear as bright features in filters displaying "cold" temperatures such as GOES/SUVI 304 (around 80.000 degrees - https://www.swpc.noaa.gov/products/goes-solar-ultraviolet-imager-suvi ). In passbands displaying higher temperatures such as GOES/SUVI 171 (around 700.000 degrees), they appear as dark features. The images underneath show both eruptions in GOES/SUVI 304. The online version at https://www.stce.be/news/686/welcome.html has also clips in SUVI 171 and SUVI 094 (multi-million degrees), such as post-eruption coronal loops and supra-arcade downflows ("SADs" - https://www.stce.be/news/630/welcome.html ). The prominence eruption seems to have been triggered by a C3.8 flare in a small active region NOAA 3585, which may have destabilized the magnetic structure holding the nearby prominence. The second eruption was associated with a long-duration M2.6 flare.
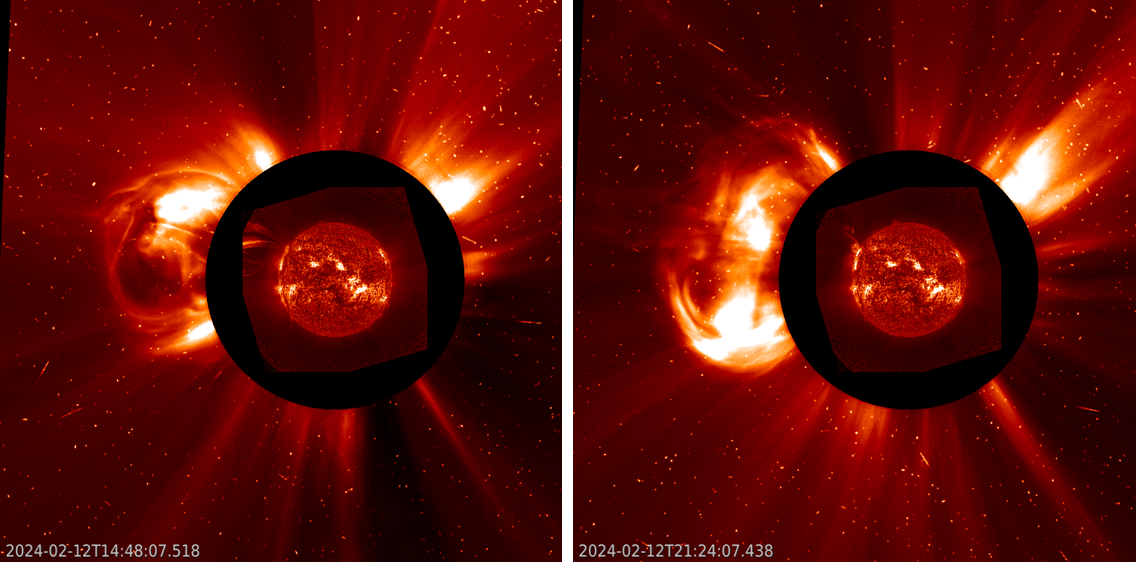
Both eruptions were associated with CMEs, shown in the SOHO/LASCO C2 images (http://sohowww.nascom.nasa.gov/data/realtime-images.html ) underneath. The CMEs had a plane-of-the-sky speed of resp. near 600 km/s and 1200 km/s, and no earth-directed component. The "noise" (white dots) in the images is due to energetic particles crashing onto the camera pixels. It is thought that these particles have their source in the strong farside event from NOAA 3575 earlier that day around 06:30 UTC, generating a moderate solar radiation storm.
Venues selected for European Space Weather Week 2025 and 2026
The European Space Weather Week (ESWW) Programme Committee (PC) is pleased to announce the selected host cities for ESWW in the years 2025 and 2026. The 2025 edition will take place in Umea, Sweden. The 2026 edition will take place in Firenze (Florence), Italy. These will be the first occasions when these two countries with prominent space weather communities host the event and each will add their own unique flavour to the conference.
The ESWW PC is hoping to make an announcement for the host city for 2027 soon.
ESWW 2024 will take place in Coimbra, Portugal from 4th to 8th November 2024. The community is encouraged to routinely check the website for updates: https://esww2024.org/
Kind Regards
Piers Jiggens - on behalf of the ESWW Programme Committee (PC)
Review of solar and geomagnetic activity
WEEK 1207 from 2024 Feb 12
Solar Active Regions and flares
Solar flaring activity over the past week started at moderate levels, reached high levels on February 16, and then returned to low levels for the rest of the week. Throughout the week, there was a total of 14 active regions (ARs) observed on the visible side of the solar disk. 75 C-class flares, 10 M-class flares and one X-class flare were recorded, with the strongest being an X2.5-flare peaking at 06:53 UTC on February 16, associated with NOAA AR 3576. This region was the most complex (beta-gamma-delta) AR on the visible solar disc and main driver of the flaring activity observed over the past week, along with NOAA AR 3583 (beta-gamma). NOAA AR 3576 also produced seven out of ten observed M-class flares. Moderate flaring activity was also produced by NOAA AR 3582 (beta) and by ARs behind the east limb.
Coronal mass ejections
There were multiple back-sided halo and partial halo coronal mass ejections (CMEs) detected throughout the week. Some were produced by regions behind the east limb, while other strong ones were associated with activity from NOAA AR 3575 on the far side of the Sun. Notably, on February 12, a halo CME directed primarily to the South-West from Earth's perspective was detected, originating from behind the West limb, which also caused a proton event. Additionally, two partial halo CMEs were observed later that day, associated with a prominence eruption behind the north-east limb.
On February 14, a halo CME was observed, primarily directed to the South-West from Earth's perspective, deemed to be back-sided with no clear on-disc signatures. Further halo CMEs were detected on February 15 and 16, primarily directed to the South from Earth's perspective, also determined to be back-sided with no expected impact on Earth.
A large filament eruption in the northern hemisphere resulted in a northward CME launched at around 03:12 UTC on Feb 16th. While most of the ejection is expected to miss Earth, a mild glancing blow arrival may occur late on February 19th or early on February 20th. Another wide CME was detected at 09:24 UTC on February 16, in LASCO C2 data. The CME was associated with an X2.5 flare, originating from NOAA AR 3576, along with a Type II and Type IV radio bursts. It was directed primarily to the South-West from the Earth's perspective and was estimated to likely miss Earth.
Finally, two halo CMEs were observed on February 17 and February 18, associated with eruptions from behind the south-east limb, with no anticipated impact on Earth.
Coronal Holes
No geo-effective coronal holes were observed throughout the week.
Proton flux levels
The greater than 10 MeV GOES proton flux exceeded the 10pfu threshold from 08:05 UTC on February 12 to 21:20 UTC on February 14, reaching a maximum value of 120 pfu at 06:15 UTC on February 13 as measured by GOES-18. This proton event was likely associated with back-sided halo CMEs observed in LASCO/C2 coronagraph data at 06:36 UTC on February 12th and at 04:12 UTC on February 14. The proton flux remained below the threshold for the rest of the week.
Electron fluxes at GEO
The greater than 2 MeV electron flux was below the 1000 pfu threshold throughout the entire week. The corresponding electron fluence was at nominal levels.
Solar wind
At the beginning of the week, the solar wind parameters (measured by ACE and DSCOVR) were reflecting the waning influence of an ICME from Feb 6. The solar wind speed decreased from values around 630 km/s to 440 km/s. The interplanetary magnetic field magnitude was below 8 nT. The southward component of the interplanetary magnetic field fluctuated between -4 nT and 5 nT. The magnetic field orientation was predominantly in the negative sector (field directed towards the Sun). A weak shock was detected in the solar wind data (ACE and DSCOVR) around 01:38 UTC on Feb 13th, accompanied by a minor increase in the interplanetary magnetic field, solar wind speed and temperature, that may be associated with the combined influences of the CMEs occurring at Feb 9, Feb 10th. For the remainder of the week, near slow solar wind conditions prevailed.
Geomagnetism
Geomagnetic conditions were mostly quiet to unsettled both globally and locally (NOAA-Kp and K-BEL: 1 to 3) during the last week, with short period of active conditions (NOAA Kp 4-, K-Bel 4) registered on Feb 13th.
International Sunspot Number by SILSO
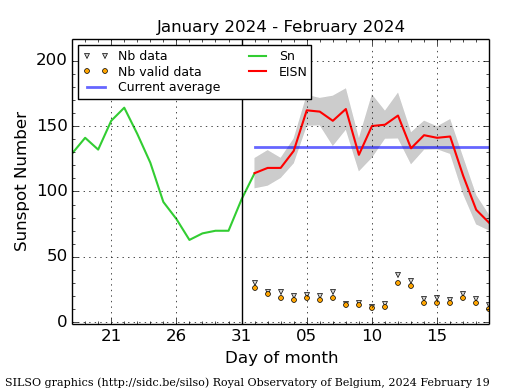
The daily Estimated International Sunspot Number (EISN, red curve with shaded error) derived by a simplified method from real-time data from the worldwide SILSO network. It extends the official Sunspot Number from the full processing of the preceding month (green line), a few days more than one solar rotation. The horizontal blue line shows the current monthly average. The yellow dots give the number of stations that provided valid data. Valid data are used to calculate the EISN. The triangle gives the number of stations providing data. When a triangle and a yellow dot coincide, it means that all the data is used to calculate the EISN of that day.
PROBA2 Observations
Solar Activity
Solar flare activity fluctuated from low to high during the week.
In order to view the activity of this week in more detail, we suggest to go to the following website from which all the daily (normal and difference) movies can be accessed: https://proba2.oma.be/ssa
This page also lists the recorded flaring events.
A weekly overview movie can be found here (SWAP week 725): https://proba2.sidc.be/swap/data/mpg/movies/weekly_movies/weekly_movie_2024_02_12.mp4
Details about some of this week's events can be found further below.
If any of the linked movies are unavailable they can be found in the P2SC movie repository here https://proba2.sidc.be/swap/data/mpg/movies/
Thursday Feb 15
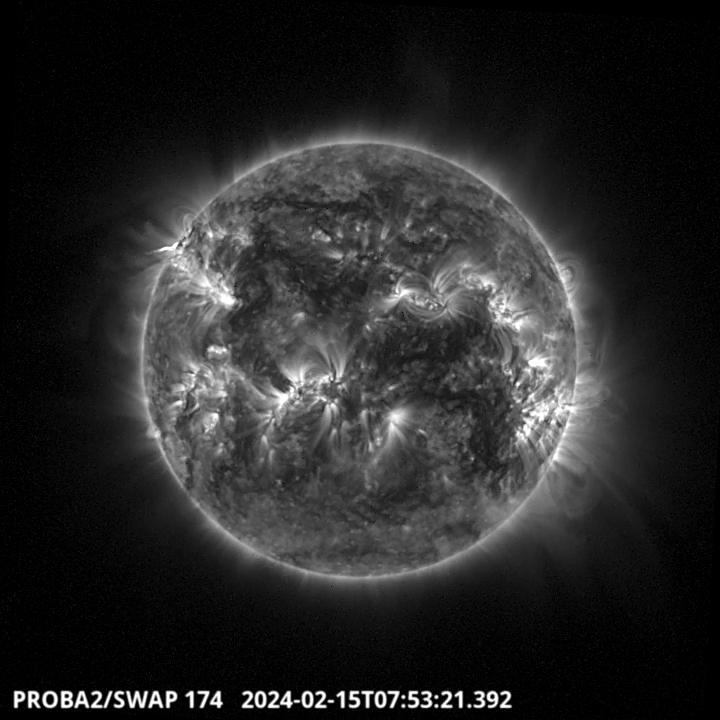
A prominence eruption has been produced around 7:53 UT on the North East limb of the solar
disk. It has been followed by a C5.1 flare (AR 3586).
Find a SWAP movie of the event here: https://proba2.sidc.be/swap/movies/20240215_swap_movie.mp4
Friday Feb 16
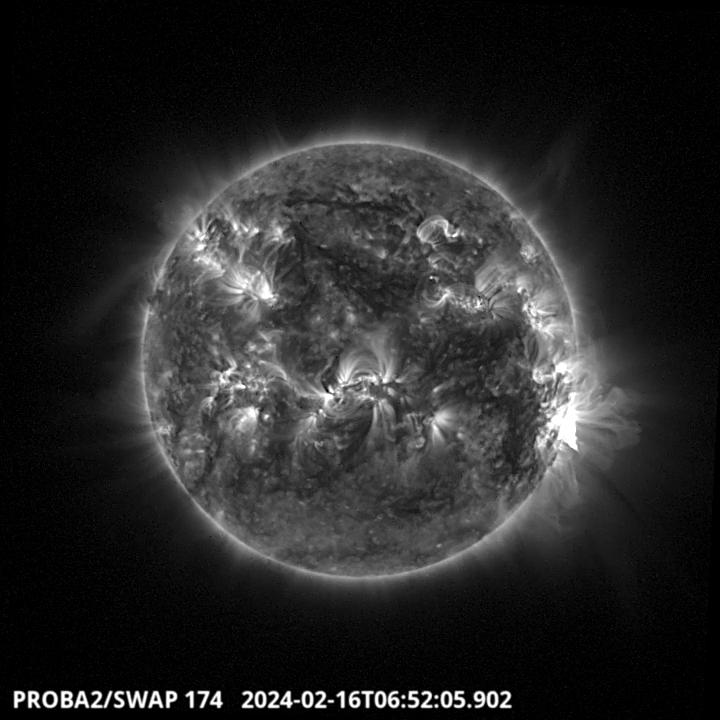
The strongest flare of this week is a X2.5, it is visible on the SWAP image above around 6:52 UT.
It has been produced by the AR NOAA 3576, located in the South West part of the solar disk.
Find a SWAP movie of the event here: https://proba2.sidc.be/swap/movies/20240216_swap_movie.mp4
Noticeable Solar Events
| DAY | BEGIN | MAX | END | LOC | XRAY | OP | 10CM | TYPE | Cat | NOAA |
| 12 | 0323 | 0348 | 0353 | S17W26 | M6.5 | 2B | 65 | 3576 | ||
| 12 | 1250 | 1308 | 1321 | M1.1 | 65 | 3576 | ||||
| 12 | 1531 | 1548 | 1603 | S12W34 | M1.4 | 1F | 65 | 3576 | ||
| 12 | 2035 | 2117 | 2151 | M2.6 | III/1 | |||||
| 14 | 0302 | 0310 | 0323 | M1.0 | 72 | 3582 | ||||
| 14 | 0726 | 0735 | 0742 | M1.0 | F | II/3/3 | 65 | 3576 | ||
| 15 | 1650 | 1707 | 1721 | M1.8 | 65 | 3576 | ||||
| 16 | 0239 | 0251 | 0257 | M1.5 | II/1 | 65 | 3576 | |||
| 16 | 0642 | 0653 | 0658 | X2.5 | N | /2I/3I/3 7V/2 | 65 | 3576 | ||
| 16 | 2157 | 2209 | 2216 | M3.0 | 65 | 3576 |
| LOC: approximate heliographic location | TYPE: radio burst type |
| XRAY: X-ray flare class | Cat: Catania sunspot group number |
| OP: optical flare class | NOAA: NOAA active region number |
| 10CM: peak 10 cm radio flux |
Geomagnetic Observations in Belgium
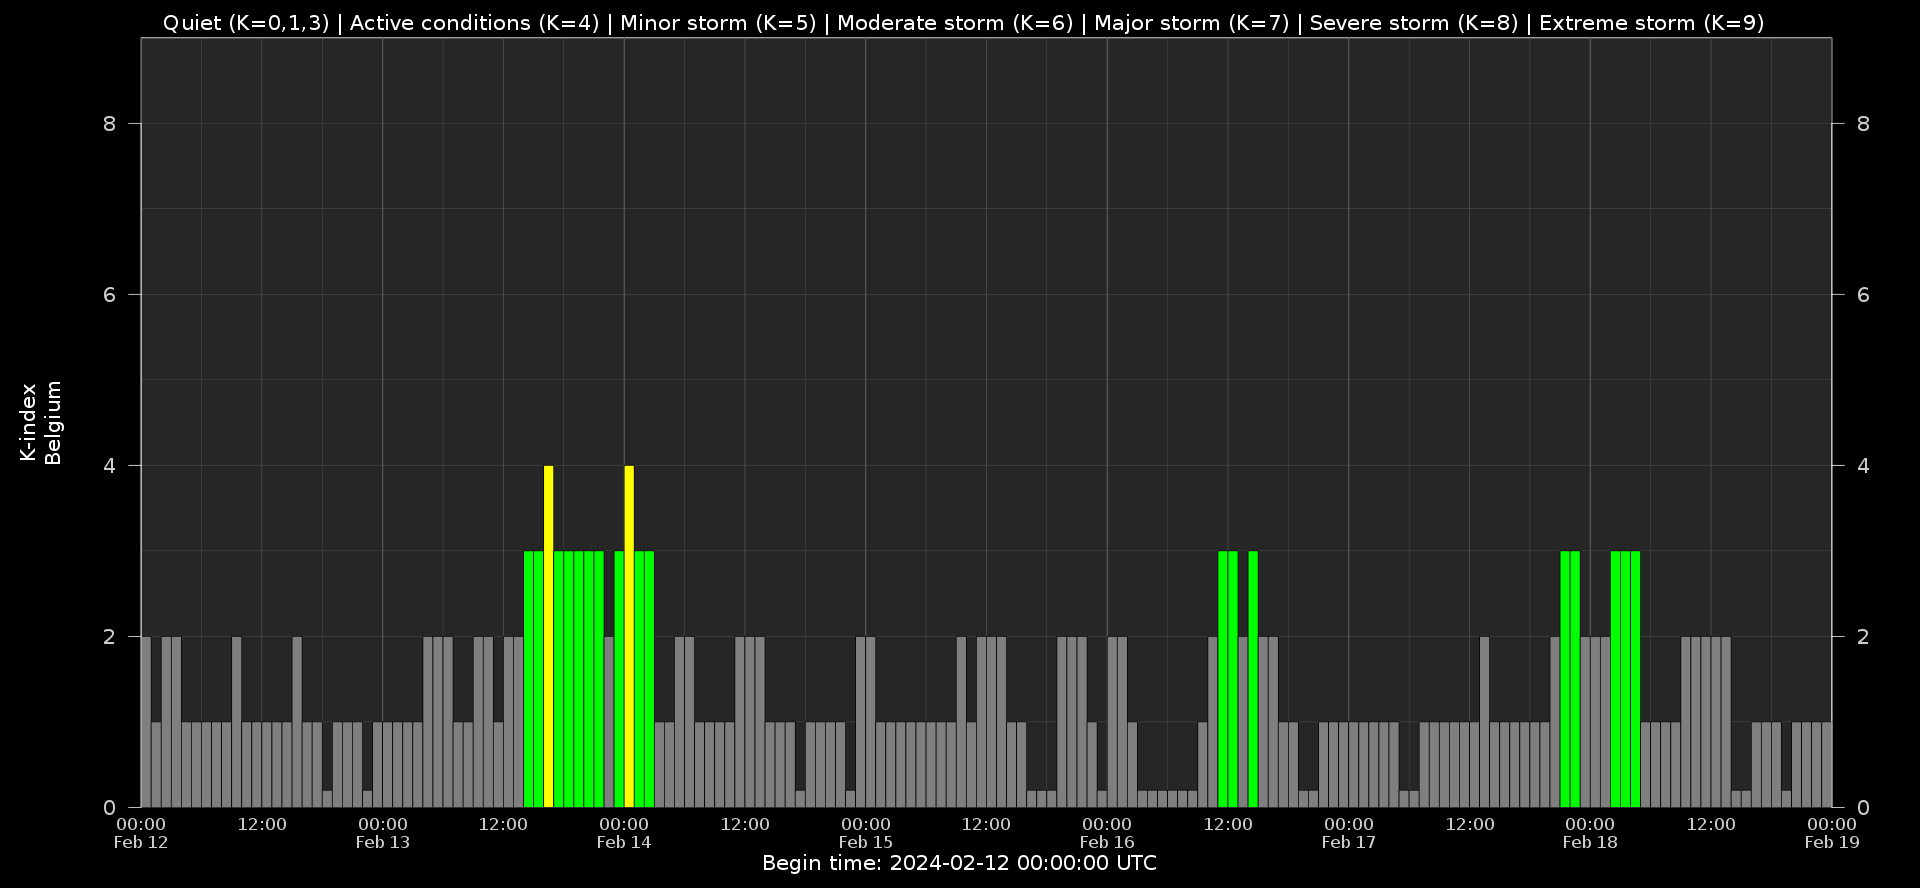
Local K-type magnetic activity index for Belgium based on data from Dourbes (DOU) and Manhay (MAB). Comparing the data from both measurement stations allows to reliably remove outliers from the magnetic data. At the same time the operational service availability is improved: whenever data from one observatory is not available, the single-station index obtained from the other can be used as a fallback system.
Both the two-station index and the single station indices are available here: http://ionosphere.meteo.be/geomagnetism/K_BEL/
Review of Ionospheric Activity
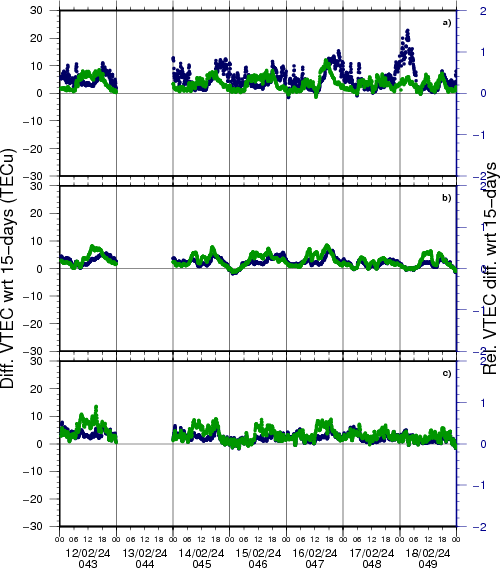
NEW! The time series below illustrates (in green) the VTEC deviation from normal quiet behaviour.
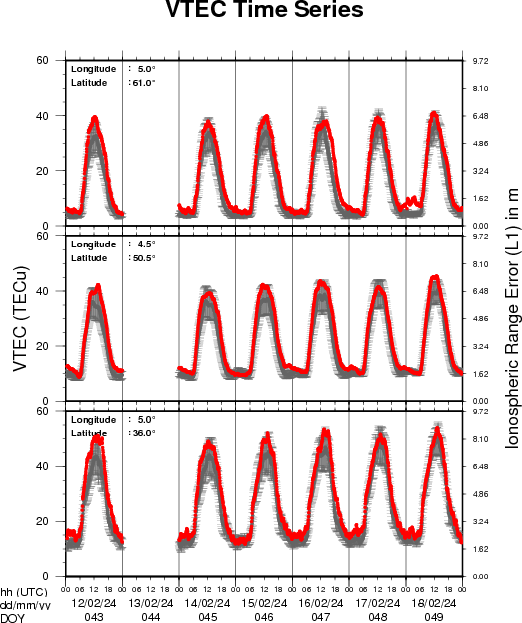
VTEC time series at 3 locations in Europe from 12 Feb 2024 till 18 Feb 2024
The top figure shows the time evolution of the Vertical Total Electron Content (VTEC) (in red) during the last week at three locations:
a) in the northern part of Europe(N 61deg E 5deg)
b) above Brussels(N 50.5deg, E 4.5 deg)
c) in the southern part of Europe(N 36 deg, E 5deg)
This top figure also shows (in grey) the normal ionospheric behaviour expected based on the median VTEC from the 15 previous days.
The time series below shows the VTEC difference (in green) and relative difference (in blue) with respect to the median of the last 15 days in the North, Mid (above Brussels) and South of Europe. It thus illustrates the VTEC deviation from normal quiet behaviour.
The VTEC is expressed in TECu (with TECu=10^16 electrons per square meter) and is directly related to the signal propagation delay due to the ionosphere (in figure: delay on GPS L1 frequency).
The Sun's radiation ionizes the Earth's upper atmosphere, the ionosphere, located from about 60km to 1000km above the Earth's surface.The ionization process in the ionosphere produces ions and free electrons. These electrons perturb the propagation of the GNSS (Global Navigation Satellite System) signals by inducing a so-called ionospheric delay.
See http://stce.be/newsletter/GNSS_final.pdf for some more explanations; for more information, see https://gnss.be/SpaceWeather
STCE Activities
Check out our activity calendar: activities and encounters with the Sun-Space-Earth system and Space Weather as the main theme. We provide occasions to get submerged in our world through educational, informative and instructive activities.
If you want your event in our calendar, contact us: stce_coordination at stce.be
* February 27, Solar physics and Space Weather: history and introduction, online course - Registrations are open
* March 4-5, 2024, STCE Space Weather Introductory Course, focus on aviation, online - fully booked
* March 26, Solar physics and Space Weather: Sunspots and Solar Radio Astronomy, online course - Registrations are open
* March 28-29, 2024, STCE Space Weather Introductory Course, focus on aviation, online - Registrations are open
* April 22-24, 2024, STCE Space Weather Introductory Course, Brussels, Belgium - Registrations are open
* April 26, Public presentation �Proba-3: a solar eclipse maker�, MIRA, Grimbergen
* April 30, Solar physics and Space Weather: Proba-2 and Proba-3, online course - Registrations are open
* May 13, lecture by the STCE, From physics to forecasting, ESA Space Weather Training Course 2024, Euro Space Center, Redu, Belgium
* May 13 - 17, lectures by the STCE, solar and heliospheric weather; magnetosphere, ionosphere, aviation, and ground based impact, Course Operational Space Weather Fundamentals, L'Aquila, Italy
* May 18, Public presentation, The PROBA-3 Mission: Artificial Total Solar Eclipse in Space, FotonFest, Urania, Hove, Belgium
* May 28, Solar physics and Space Weather: Solar Orbiter Spacecraft, online course - Registrations are open
* June 9, Public presentation �Total Solar Eclipse of the Sun�, Helios, Averbode, Belgium
* June 25, Solar physics and Space Weather: predictions and services, online course - Registrations are open
More info needed? Contact us: stce_coordination at stce.be
Check: https://www.stce.be/calendar
To register for a course, check the page of the STCE Space Weather Education Centre: https://www.stce.be/SWEC