- Table of Content
- 1.Wuthering Heig...
- 2.Review of spac...
- 3.PROBA2 Observa...
- 4.Noticeable Sol...
- 5.International ...
- 6.Geomagnetic Ob...
- 7.The SIDC space...
- 8.Review of Iono...
- 9.Courses, lectu...
2. Review of space weather
3. PROBA2 Observations (19 Feb 2024 - 25 Feb 2024)
4. Noticeable Solar Events
5. International Sunspot Number by SILSO
6. Geomagnetic Observations in Belgium
7. The SIDC space weather briefing
8. Review of Ionospheric Activity
9. Courses, lectures and presentations
Wuthering Heights
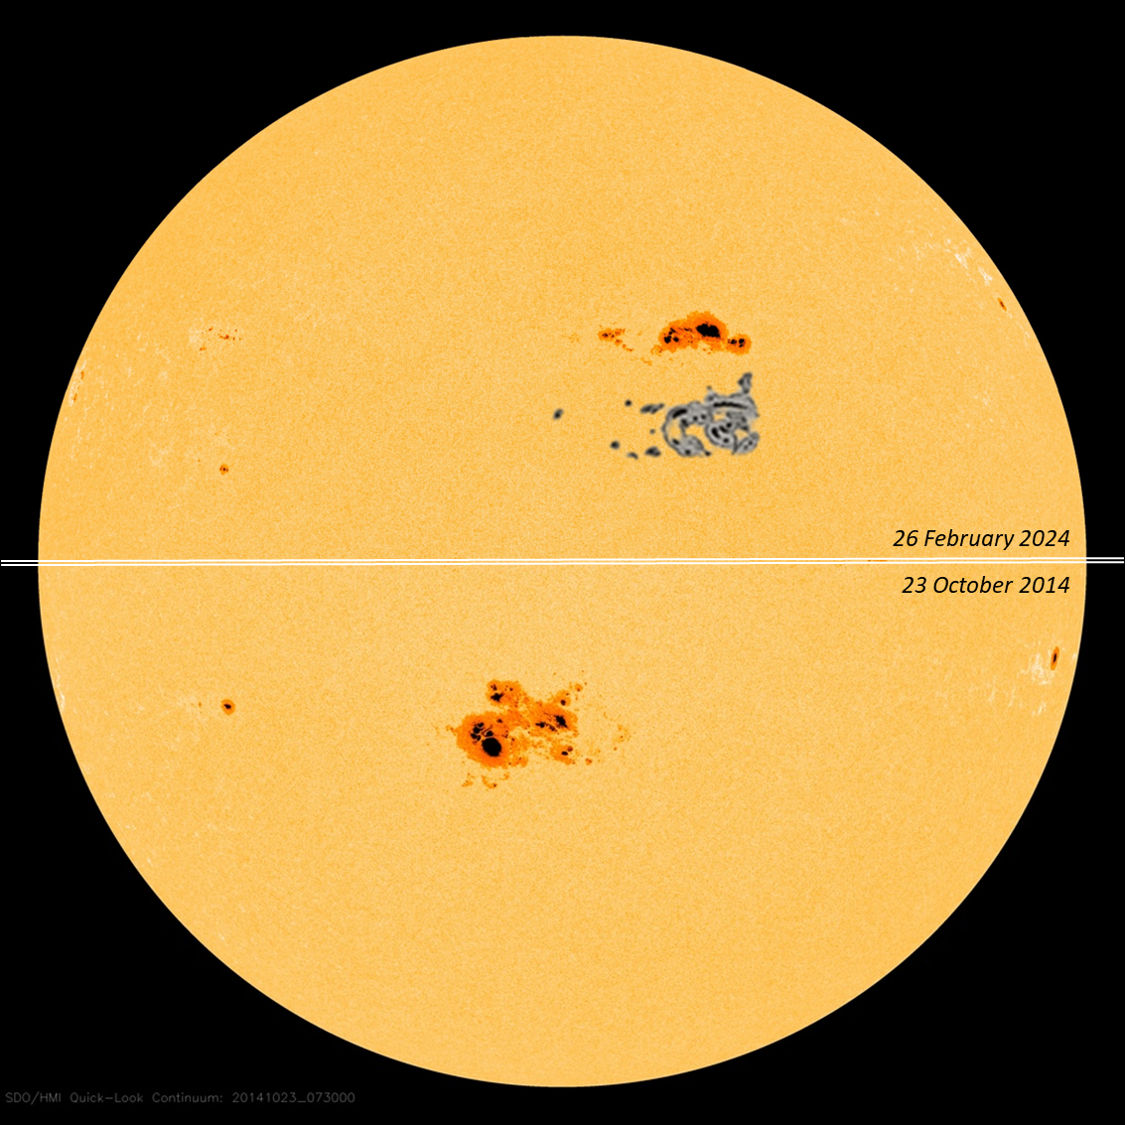
Active region NOAA 13590 has been the talk of the town this week. This region has a sunspot area of about 9 times the total surface area of the Earth and was -using eclipse glasses- an easy naked eye object. To put things in perspective, the compilation underneath was created using SDO/HMI white light images (http://sdo.gsfc.nasa.gov/data/aiahmi/ ). The top half of the figure shows a 26 February image of NOAA 13590 with a nearby overlay of the Carrington sunspot group from 1859 for comparison (same scale - Taken from Toriumi and Wang 2019 - https://link.springer.com/article/10.1007/s41116-019-0019-7 ; Hayakawa et al. 2018 - https://iopscience.iop.org/article/10.3847/1538-4357/aae47c ). Clearly, NOAA 13590 is still quite smaller than the Carrington sunspot group. The Carrington group itself was not the largest group ever observed, and is actually a bit smaller than NOAA 12192, the largest region from the previous solar cycle (SC24), as shown in the lower half of the figure. Though both sunspot groups were very large, there have been several sunspot regions larger than these two, with the sunspot group of April 1947 still the largest observed since systematic daily observations started in the mid-19th century (see the STCE newsitem at https://www.stce.be/news/280/welcome.html ). To put things in perspective, the reported or calculated USAF/NOAA sunspot areas for the mentioned active regions are 1450 MH (NOAA 13590), 2300 MH (Carrington group), 2610 MH (NOAA 10486), 2750 MH (NOAA 12192), and a whopping 4380 MH (April 1947 group). "MH" means "millionths of a solar hemisphere" (see https://www.stce.be/educational/acronym#M ), and for the corresponding Greenwich values, the USAF/NOAA areas have to be multiplied by 1.4.
The chart underneath shows the accumulated averaged number of big, super and giant sunspot groups that appear for each year of a standard 11-years solar cycle with a maximum smoothed sunspot number of 175.8 (vertical bars; the average of solar cycles 12 to 24). The green line shows the number of all such large sunspot groups per year that have been recorded so far this solar cycle, i.e. from 2020 to 2023. The USAF/NOAA data have been upscaled by a factor 1.4 (Solar Cycle Science - http://solarcyclescience.com/activeregions.html ) to make them comparable with the Greenwich data. The (Greenwich) thresholds are resp. 1000 MH (big; "B"), 1500 MH (super ; "S") and 2500 MH (giant; "G"). Clearly, SC25 is a well-below average solar cycle in terms of big groups, with only 4 super groups so far, and that includes super group NOAA 13590. Of course, this solar cycle is still young and many more large groups, including a giant group such as NOAA 12192, can be expected during the next few years.

NOAA 13590 has produced already 3 X-class solar flares, including an X6.3 which is the strongest flare so far this solar cycle. As already pointed out in the related newsflash (https://www.stce.be/news/687/welcome.html ), none of the 3 X-class flares seemed to be associated with an obvious coronal mass ejection (CME), which makes it very similar to the October 2014 active region NOAA 12192, that produced 8 X-class flares with no associated CME (STCE newsitem - https://www.stce.be/news/280/welcome.html ). Note the flare data have been corrected for NOAA's pre-GOES-16 rescaling of the flare intensity (NOAA/NGDC - https://www.ngdc.noaa.gov/stp/satellite/goes/index.html ). February 2024 also totals already 5 X-class flares, the most for any month so far this solar cycle. The graph underneath shows since 1975 the smoothed sunspot number with an indication for the months with X-class flares. Notorious absent during this and previous solar cycle are the red dots, i.e. months with 10 X-class flares or more. The last month with 10+ X-class flares dates back from September 2005, that's almost 20 years ago! Space weather forecasters on duty that month are still traumatized by the wrath of active region NOAA 10808...

Review of space weather
Solar Active Regions (ARs) and flares
Solar flaring activity was low at the start, went to high levels on February 21 and February 22 and decreased to moderate levels near the end of the week. There were nine (9) active regions visible throughout the week and 39 C-, 8 M- and 3 X-class flare were recorded. The strongest flare being an X6.3-flare with peak time 22:35 UTC on February 22; the second strongest was an X1.8-flare, with peak time 23:07 UTC on February 22 and the third strongest was X1.7-flare with peak time 06:32 UTC on February 22, all associated with NOAA AR 3590. NOAA AR 3590 was the largest and most magnetically complex (beta-gamma-delta) region on the disk. NOAA AR 3592 produced one out of the 8 M-class flares. All other M-class flares were produced by NOAA AR 3590.
Coronal mass ejections
Two partial halo Coronal Mass Ejections (CME)s were observed. The first halo CME, was south-east directed and detected in LASCO C2 data at 16:12 UTC on February 21. It was associated with an eruption behind the east limb and did not impact the Earth. The second partial halo CME, was detected in LASCO C2 data at 18:36 UTC on February 21 and was west-ward. It was associated with a filament eruption seen in SDO/AIA 304 and 193 at 17:37 on February 21 in the north-west quadrant of the visible solar disk. The CME had an estimate plane-of-sky speed of around 450 km/s and had a glancing blow at Earth on February 25.
Coronal Holes
Two negative polarity coronal holes crossed the central meridian on February 23. One in the in the northern half of the Sun at high latitudes and the other was a recurring coronal hole in the southern hemisphere of the Sun at low latitude. The Earth came under the influence of a high-speed-stream from the southern coronal hole on February 24.
Proton flux levels
At the start of the week the greater than 10 MeV GOES proton flux was enhanced but below the storm threshold. This increase was due to X2.5-flare on February 12. The flux continued to gradually decrease until reaching nominal levels on February 25.
Electron fluxes at GEO
The greater than 2 MeV electron flux measured by GOES-16 was at background levels. The 24h electron fluence was at nominal levels.
Solar wind
The solar wind at L1 was slow from early this week until February 24 when the solar wind became disturbed due to a high-speed-stream (HSS) from a negative polarity coronal hole and an ICME. A shock in the solar wind marked the arrival of the HSS. The solar wind speed jumped from around 309 km/s to around 380 km/s and the interplanetary magnetic field jumped from 5 nT to 10 nT at 16:20 UTC on February 24. Around 00:40 UTC on February 25, the Earth came under the influence of an ICME with a maximum speed of around 450 km/s and the interplanetary magnetic field of 11 nT, with a minimum Bz of -10 nT.
At the start of the week the phi-angle was mainly in the positive sector (directed away from the Sun) until February 23 when it switched to the negative sector.
Geomagnetism
The geomagnetic conditions were globally quiet with (Kp 1-2 and K Bel 1-2) with locally some unsettled periods (Kp 3).
PROBA2 Observations (19 Feb 2024 - 25 Feb 2024)
Solar Activity
Solar flare activity fluctuated from low to very high during the week.
In order to view the activity of this week in more detail, we suggest to go to the following website from which all the daily (normal and difference) movies can be accessed: https://proba2.oma.be/ssa
This page also lists the recorded flaring events.
A weekly overview movie (SWAP week 726) can be found here: https://proba2.sidc.be/swap/data/mpg/movies/weekly_movies/weekly_movie_2024_02_19.mp4.
Details about some of this week's events can be found further below.
If any of the linked movies are unavailable they can be found in the P2SC movie repository here: https://proba2.oma.be/swap/data/mpg/movies/.
Thursday February 22


The largest flare of this week was an X6.3, and it was observed by LYRA (top panel) and SWAP (bottom panel). The flare peaked on 2024-Feb-22 at 22:34 UT. It occurred on the north-eastern quadrant, and it originated from NOAA AR3590.
Find a SWAP movie of the event here: https://proba2.sidc.be/swap/movies/20240222_swap_movie.mp4.
Noticeable Solar Events
| DAY | BEGIN | MAX | END | LOC | XRAY | OP | 10CM | TYPE | Cat | NOAA |
| 21 | 2252 | 2307 | 2314 | X1.8 | 3590 | |||||
| 21 | 2358 | 0014 | 0031 | M1.5 | ||||||
| 22 | 0617 | 0632 | 0640 | N16E35 | X1.7 | 2B | 85 | 3590 | ||
| 22 | 2029 | 2046 | 2103 | N18E29 | M4.8 | 2B | 85 | 3590 | ||
| 22 | 2208 | 2234 | 2243 | X6.3 | III/1 | 85 | 3590 | |||
| 23 | 1312 | 1328 | 1354 | M1.0 | 85 | 3590 | ||||
| 23 | 1541 | 1553 | 1606 | N18E18 | M1.4 | 1N | 85 | 3590 | ||
| 23 | 1726 | 1747 | 1807 | N18E18 | M2.6 | 1N | III/2 | 85 | 3590 | |
| 24 | 0621 | 0634 | 0644 | M4.5 | 85 | 3590 | ||||
| 24 | 1032 | 1057 | 1103 | M2.2 | 85 | 3590 | ||||
| 24 | 1103 | 1118 | 1125 | M3.6 | 85 | 3590 | ||||
| 24 | 1154 | 1159 | 1204 | M1.0 | 85 | 3590 | ||||
| 25 | 1647 | 1722 | 1747 | N17W10 | M2.0 | 1N | CTM/1 | 85 | 3590 |
| LOC: approximate heliographic location | TYPE: radio burst type |
| XRAY: X-ray flare class | Cat: Catania sunspot group number |
| OP: optical flare class | NOAA: NOAA active region number |
| 10CM: peak 10 cm radio flux |
International Sunspot Number by SILSO
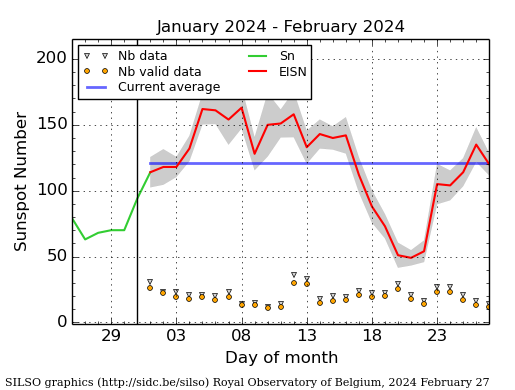
The daily Estimated International Sunspot Number (EISN, red curve with shaded error) derived by a simplified method from real-time data from the worldwide SILSO network. It extends the official Sunspot Number from the full processing of the preceding month (green line), a few days more than one solar rotation. The horizontal blue line shows the current monthly average. The yellow dots give the number of stations that provided valid data. Valid data are used to calculate the EISN. The triangle gives the number of stations providing data. When a triangle and a yellow dot coincide, it means that all the data is used to calculate the EISN of that day.
Geomagnetic Observations in Belgium

Local K-type magnetic activity index for Belgium based on data from Dourbes (DOU) and Manhay (MAB). Comparing the data from both measurement stations allows to reliably remove outliers from the magnetic data. At the same time the operational service availability is improved: whenever data from one observatory is not available, the single-station index obtained from the other can be used as a fallback system.
Both the two-station index and the single station indices are available here: http://ionosphere.meteo.be/geomagnetism/K_BEL/
The SIDC space weather briefing
of the past week presented by the forecaster on duty: https://www.stce.be/briefings/20240219_SWbriefing.pdf
Review of Ionospheric Activity
NEW! The time series below illustrates (in green) the VTEC deviation from normal quiet behaviour.
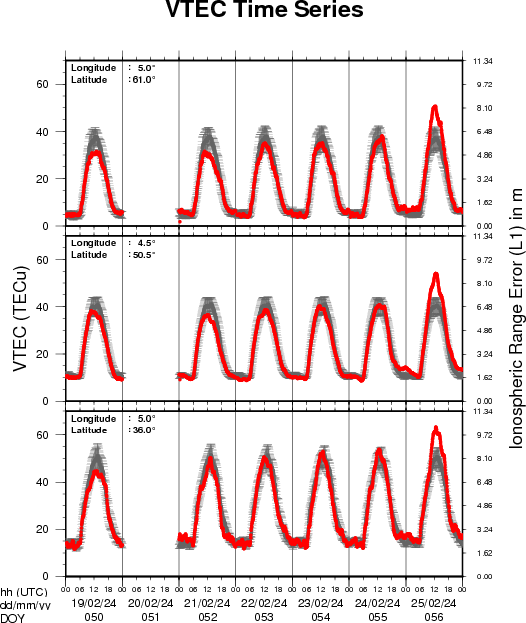
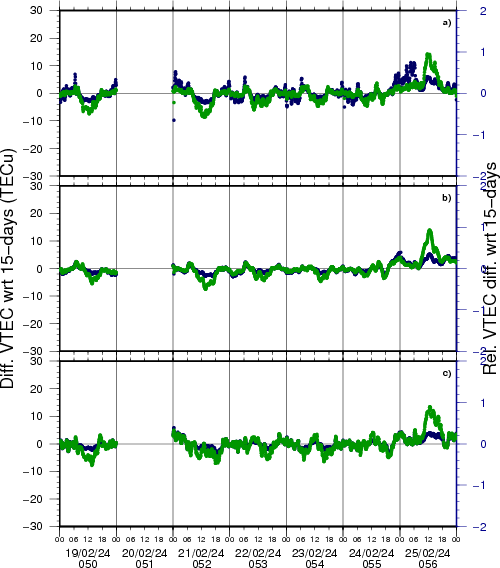
VTEC time series at 3 locations in Europe from 19 Feb 2024 till 25 Feb 2024
The top figure shows the time evolution of the Vertical Total Electron Content (VTEC) (in red) during the last week at three locations:
a) in the northern part of Europe(N 61deg E 5deg)
b) above Brussels(N 50.5deg, E 4.5 deg)
c) in the southern part of Europe(N 36 deg, E 5deg)
This top figure also shows (in grey) the normal ionospheric behaviour expected based on the median VTEC from the 15 previous days.
The time series below shows the VTEC difference (in green) and relative difference (in blue) with respect to the median of the last 15 days in the North, Mid (above Brussels) and South of Europe. It thus illustrates the VTEC deviation from normal quiet behaviour.
The VTEC is expressed in TECu (with TECu=10^16 electrons per square meter) and is directly related to the signal propagation delay due to the ionosphere (in figure: delay on GPS L1 frequency).
The Sun's radiation ionizes the Earth's upper atmosphere, the ionosphere, located from about 60km to 1000km above the Earth's surface.The ionization process in the ionosphere produces ions and free electrons. These electrons perturb the propagation of the GNSS (Global Navigation Satellite System) signals by inducing a so-called ionospheric delay.
See http://stce.be/newsletter/GNSS_final.pdf for some more explanations; for more information, see https://gnss.be/SpaceWeather
Courses, lectures and presentations
Courses and presentations with the Sun-Space-Earth system and Space Weather as the main theme. We provide occasions to get submerged in our world through educational, informative and instructive activities.
* March 4-5, 2024, STCE Space Weather Introductory Course, focus on aviation, online - fully booked
* March 26, Solar physics and Space Weather: Sunspots and Solar Radio Astronomy, online course - Registrations are open
* March 28-29, 2024, STCE Space Weather Introductory Course, focus on aviation, online - Registrations are open
* April 22-24, 2024, STCE Space Weather Introductory Course, Brussels, Belgium - Registrations are open
* April 26, Public presentation Proba-3: a solar eclipse maker, MIRA, Grimbergen
* April 30, Solar physics and Space Weather: Proba-2 and Proba-3, online course - Registrations are open
* May 3, STCE seminar An Echo of the Sun, Brussels, Belgium
* May 6, An Echo of the Sun, PhD defense Pepa Ivanova, Brussels, Belgium
* May 13, lecture by the STCE, From physics to forecasting, ESA Space Weather Training Course 2024, Euro Space Center, Redu, Belgium
* May 13 - 17, lectures by the STCE, solar and heliospheric weather; magnetosphere, ionosphere, aviation, and ground based impact, Course Operational Space Weather Fundamentals, L'Aquila, Italy
* May 18, Public presentation, The PROBA-3 Mission: Artificial Total Solar Eclipse in Space, FotonFest, Urania, Hove, Belgium
* May 28, Solar physics and Space Weather: Solar Orbiter Spacecraft, online course - Registrations are open
* June 9, Public presentation Total Eclipse of the Sun, Helios, Averbode, Belgium
* June 25, Solar physics and Space Weather: predictions and services, online course - Registrations are open
To register for a course or lecture, check the page of the STCE Space Weather Education Center: https://www.stce.be/SWEC
If you want your event in the STCE newsletter, contact us: stce_coordination at stce.be