- Table of Content
- 1.Colourful curt...
- 2.Review of spac...
- 3.International ...
- 4.Noticeable Sol...
- 5.PROBA2 Observa...
- 6.Geomagnetic Ob...
- 7.The SIDC space...
- 8.Review of Iono...
- 9.STCE courses a...
2. Review of space weather
3. International Sunspot Number by SILSO
4. Noticeable Solar Events
5. PROBA2 Observations (26 Feb 2024 - 3 Mar 2024)
6. Geomagnetic Observations in Belgium
7. The SIDC space weather briefing
8. Review of Ionospheric Activity
9. STCE courses and lectures
Colourful curtains
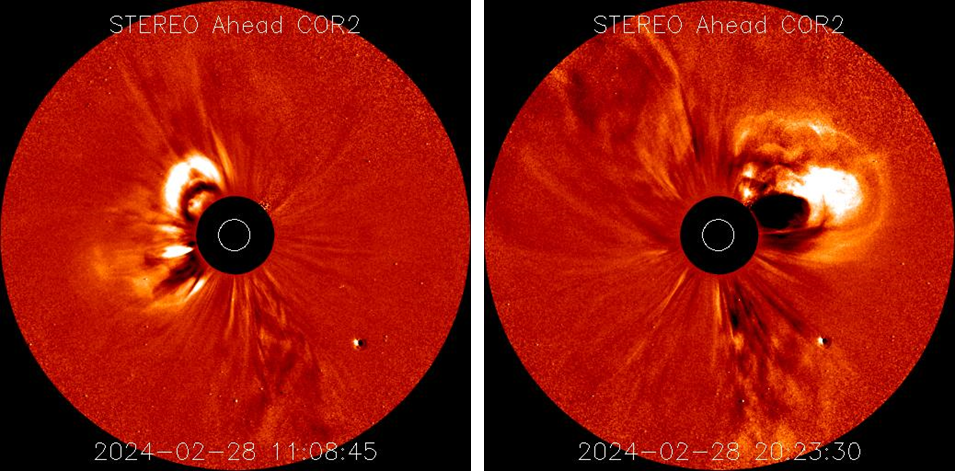
Despite the strong solar activity over the last few weeks, the geomagnetic activity did not follow suit. In contrast to all the X-class flaring and high sunspot numbers, the level of geomagnetic activity stayed at or below active conditions (Kp at or less than 4; see the STCE SWx classification page at https://www.stce.be/educational/classification ). This changed when some run-of-the-mill solar eruptions were observed on 28 February. The resulting coronal mass ejections (CMEs), one to the southeast and one to the northwest, are shown in the coronagraphic imagery underneath (STEREO-A ; http://stereo-ssc.nascom.nasa.gov/beacon/beacon_secchi.shtml ). With speeds of 500 to 700 km/s (CACTus - https://www.sidc.be/cactus/ ), they were certainly not excessively fast, but their location and associated width made forecasters (SIDC - https://www.sidc.be/ ) believe that one or maybe both had an earth-directed component, due to deliver a glancing blow to the earth environment around 3 March.
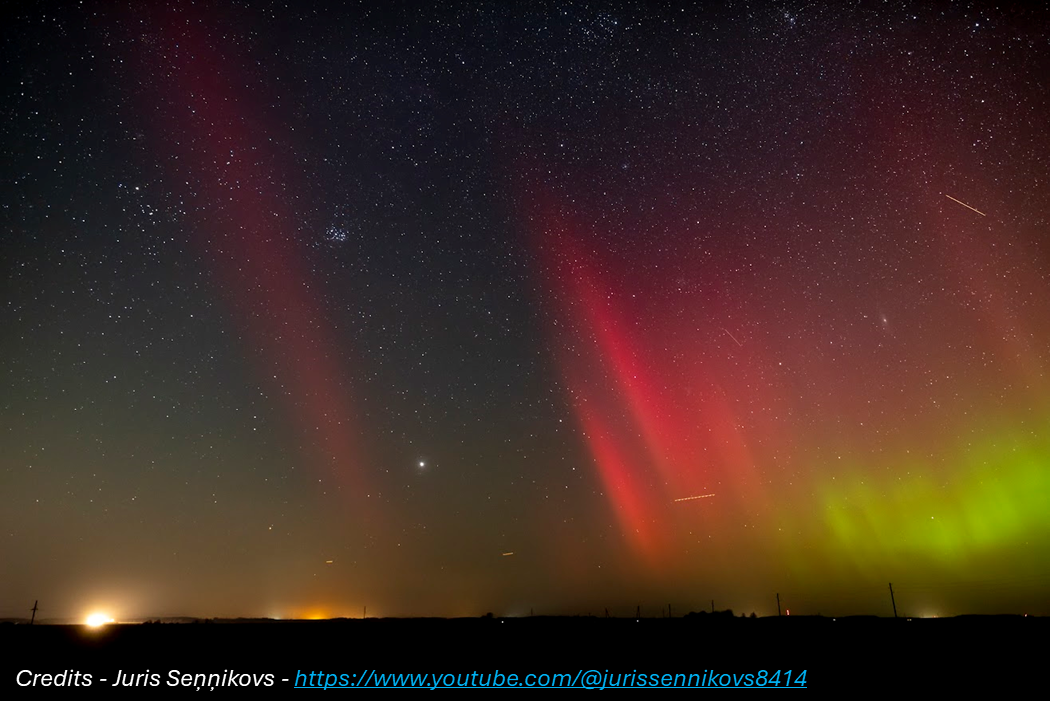
That forecast was spot on, with the arrival of the CME observed around 08:45 UTC on 3 March by DSCOVR (https://www.swpc.noaa.gov/products/real-time-solar-wind ). The resulting geomagnetic storm reached moderate levels (Kp = 6-) during the 18-21 UTC interval, and the preliminary Dst index (Disturbance storm-time) was at -115 nT. We have to go back all the way to early December last year to find a geomagnetic storm of comparable strength. Polar lights were photographed as far south as Buxton (Peak District, United Kingdom) and Lower Saxony in Germany (Spaceweather.com - https://spaceweathergallery2.com/index.php?title=aurora ). The amazing picture underneath was taken by Juris Seņņikovs from Latvia, showing a Stable Auroral Red arc (SAR arc - see the STCE Newsitem at https://www.stce.be/news/673/welcome.html ) and the polar lights in their full glory late on 3 March. There's also an associated clip (https://www.youtube.com/watch?v=yaJjm8BbYb4 ) on Juris' YouTube channel (https://www.youtube.com/@jurissennikovs8414 ) showing the spectacular evolution of the aurora.
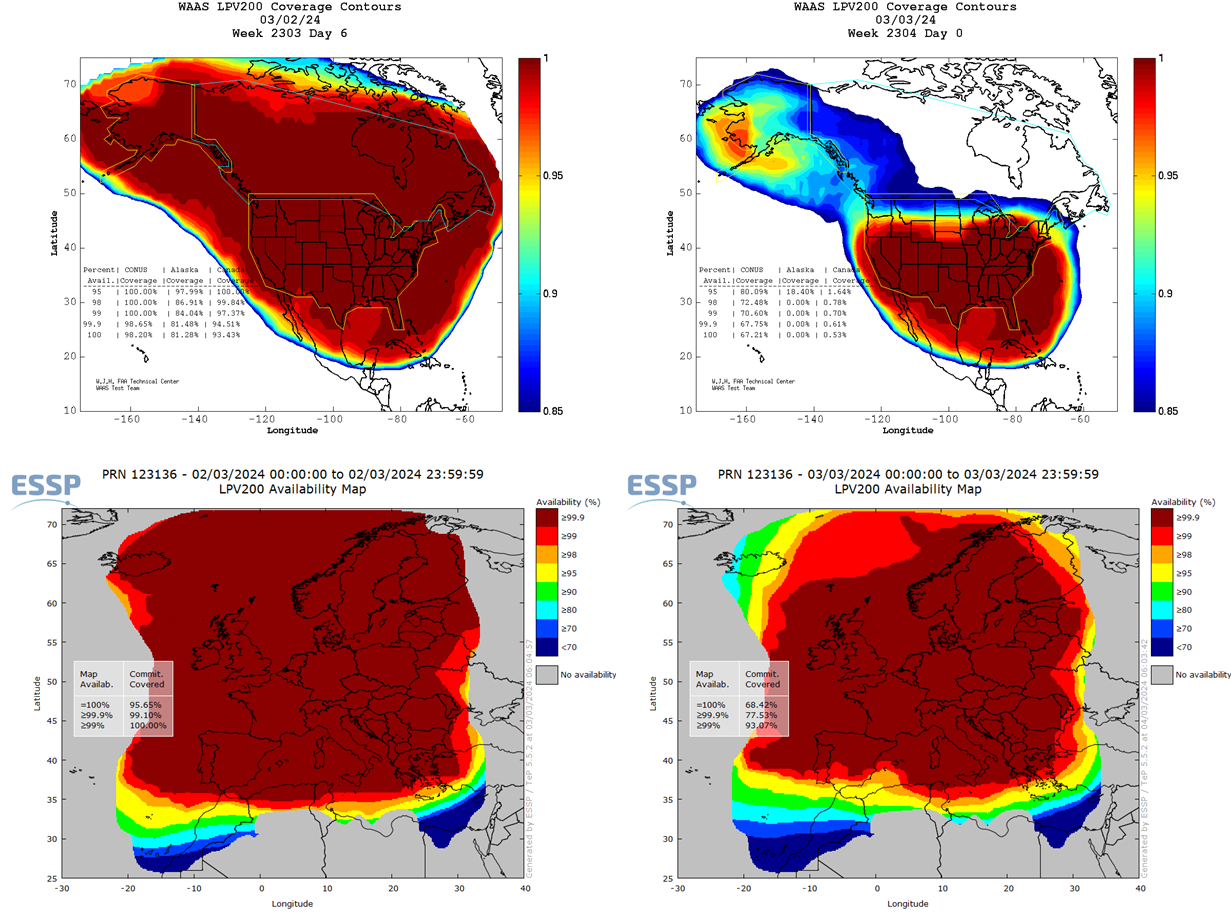
Other impacts from this moderate geomagnetic storm were limited. Geomagnetically induced currents (GICs) were recorded in e.g. Canada (NRCan - https://geomag.nrcan.gc.ca/plot-tracee/sdp-en.php ) and along the Finnish-Russian border (EURISGIC - http://eurisgic.org/ ). However, the recorded values were on the average a factor 5 to 10 smaller than those observed during the 23-24 April 2023 storm, which was the strongest so far this solar cycle. The geomagnetic storm disturbed the Earth's ionosphere and as such also affected High Frequency communications (HF Com ; 3-30 MHz) and satellite signals (PECASUS/Civil aviation - https://pecasus.eu/ ). There was a so-called "Post-Storm Depression" of the HF frequencies, meaning that the availability of the upper frequencies of the HF band were significantly reduced during the last few days. The disturbed ionosphere also affected Global Navigation Satellite Systems (GNSS) based applications for the civil aviation. As can be gauged from the imagery underneath covering 2 and 3 March, some of these applications did not reach their typical availability over Europe (EGNOS - https://egnos-user-support.essp-sas.eu/ ) and North-America (WAAS - http://www.nstb.tc.faa.gov/index.htm ) while the 3 March geomagnetic storm was ongoing. Red/brown colours mean good availability, blue means significantly degraded availability. LPV-200 (Localizer Performance with Vertical guidance) delivers accurate information on an aircraft's approach to a runway with the use of GNSS positioning technology. The result is lateral and angular vertical guidance without the need for visual contact with the ground until an aircraft is 200 feet (60 meters) above the runway (see EUSPA - https://www.euspa.europa.eu/news/egnos-lpv-200-enables-safer-aircraft-landings ). Clearly, this GNSS application was significantly reduced over Iceland, Canada and Alaska on 3 March.
Review of space weather
Solar Active Regions (ARs) and flares
Solar flaring activity was at moderate level on February 25 and 28. Eleven (11) active regions were visible. 26 C-class flares and 2 M-class flares were recorded, the strongest being an M2.1-flare with peak time at 17:22 UTC on February 25, associated with NOAA AR 3590. Most of the flaring activity came from NOAA AR 3590. Both at the start and end of the week, 6 active regions were on the visible disk.
Coronal mass ejections
Three notable coronal mass ejections (CMEs) were observed over the course of the week. The first two CMEs (first observed on February 28 at 08:24 UTC in SOHO/LASCO C2 coronagraph images as a single eastward structure) erupted from the eastern hemisphere of the visible disk. The first originated from the north-east solar quadrant (around N13E28), while the second originated from the south-east quadrant (around S17E32). Both CMEs were visible in SDO/AIA 193, 211, and 304 images and were associated with flare ribbons and a coronal dimming. The third CME (first observed on February 28 at 17:24 UTC) was a westward partial halo event associated with an eruption from NOAA AR 3590 and a long-duration M1.3 flare with peak time at 18:19 UTC.
Coronal Holes
A large elongated coronal hole of negative polarity was present in the south-west solar disk quadrant at the beginning of the week (finished to cross the central meridian on February 24). The associated high speed solar wind stream was observed at Earth on February 25-27. Additionally, a mid-latitude negative polarity coronal hole in the southern hemisphere crossed the solar central meridian at the beginning of the week, and the associated high speed solar wind stream was detected at Earth on February 28-29.
Proton flux levels
The 10 MeV proton flux was at nominal level throughout the week.
Electron fluxes at GEO
The greater than 2 MeV electron flux measured by GOES-16 was at background levels. The 24h electron fluence was at nominal level.
Solar wind
The solar wind was mainly characterised by slow solar wind conditions ranging between 255 km/s and 455 km/s. At the beginning of the week, the passage of a high speed stream induced perturbed solar wind conditions with the total magnetic field reaching 13 nT and the Bz (north-south) component reaching a minimum of -9 nT.
At the end of the week (08:47 UTC on March 3), the arrival of an interplanetary shock and interplanetary CME led to an increase in the solar wind speed from 280 km/s to about 350 km/s, while the magnetic field increased to 19 nT, with the magnetic field Bz component reaching a minimum of -18 nT.
Throughout the week, the phi-angle remained predominantly in the negative sector (directed towards the Sun) with isolated periods in the positive sector (away from the Sun).
Geomagnetism
The geomagnetic conditions over the past week were quiet to unsettled. Globally, minor storm conditions globally (Kp 5) and locally, unsettled conditions (K Bel 3) were reached on February 27 in response to the perturbed solar wind associated with the passage of a high speed stream. At the end of the week, globally moderate storm conditions (Kp 6) and locally minor storm conditions locally (K Bel 5) were reached following an interplanetary CME passage with prolonged and intense negative Bz.
International Sunspot Number by SILSO
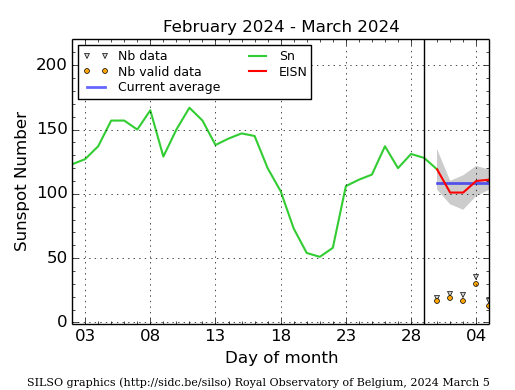
The daily Estimated International Sunspot Number (EISN, red curve with shaded error) derived by a simplified method from real-time data from the worldwide SILSO network. It extends the official Sunspot Number from the full processing of the preceding month (green line), a few days more than one solar rotation. The horizontal blue line shows the current monthly average. The yellow dots give the number of stations that provided valid data. Valid data are used to calculate the EISN. The triangle gives the number of stations providing data. When a triangle and a yellow dot coincide, it means that all the data is used to calculate the EISN of that day.
Noticeable Solar Events
| DAY | BEGIN | MAX | END | LOC | XRAY | OP | 10CM | TYPE | Cat | NOAA |
| 28 | 1624 | 1854 | 2115 | M1.5 | CTM/1 | 85 | 3590 |
| LOC: approximate heliographic location | TYPE: radio burst type |
| XRAY: X-ray flare class | Cat: Catania sunspot group number |
| OP: optical flare class | NOAA: NOAA active region number |
| 10CM: peak 10 cm radio flux |
PROBA2 Observations (26 Feb 2024 - 3 Mar 2024)
Solar Activity
Solar flare activity fluctuated from low to moderate during the week.
In order to view the activity of this week in more detail, we suggest to go to the following website from which all the daily (normal and difference) movies can be accessed: https://proba2.oma.be/ssa
This page also lists the recorded flaring events.
A weekly overview movie (SWAP week 727) can be found here: https://proba2.sidc.be/swap/data/mpg/movies/weekly_movies/weekly_movie_2024_02_26.mp4.
Details about some of this week's events can be found further below.
If any of the linked movies are unavailable they can be found in the P2SC movie repository here: https://proba2.oma.be/swap/data/mpg/movies/.
Wednesday February 28
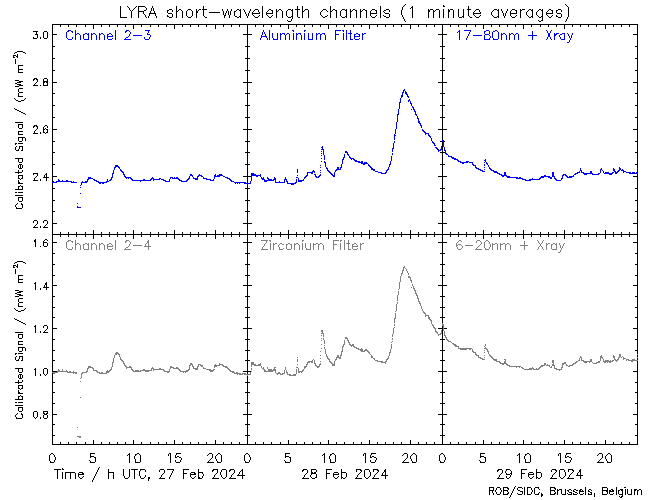
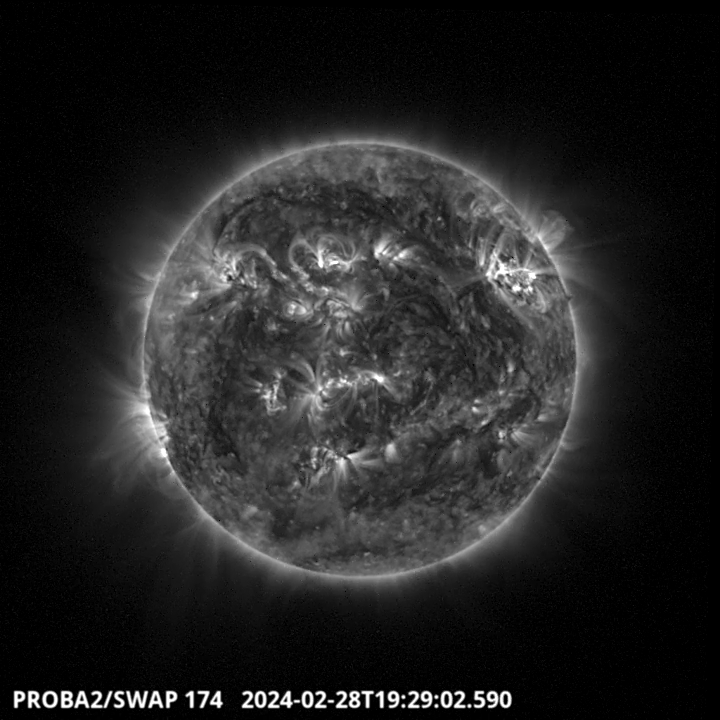
The largest flare of this week was a long duration M1.5, and it was observed by LYRA (top panel) and SWAP (bottom panel). The flare peaked on 2024-Feb-28 at 18:54 UT. It occurred on the north-western quadrant, and it originated from NOAA AR3590.
Find a SWAP movie of the event here: https://proba2.sidc.be/swap/movies/20240228_swap_movie.mp4.
Geomagnetic Observations in Belgium
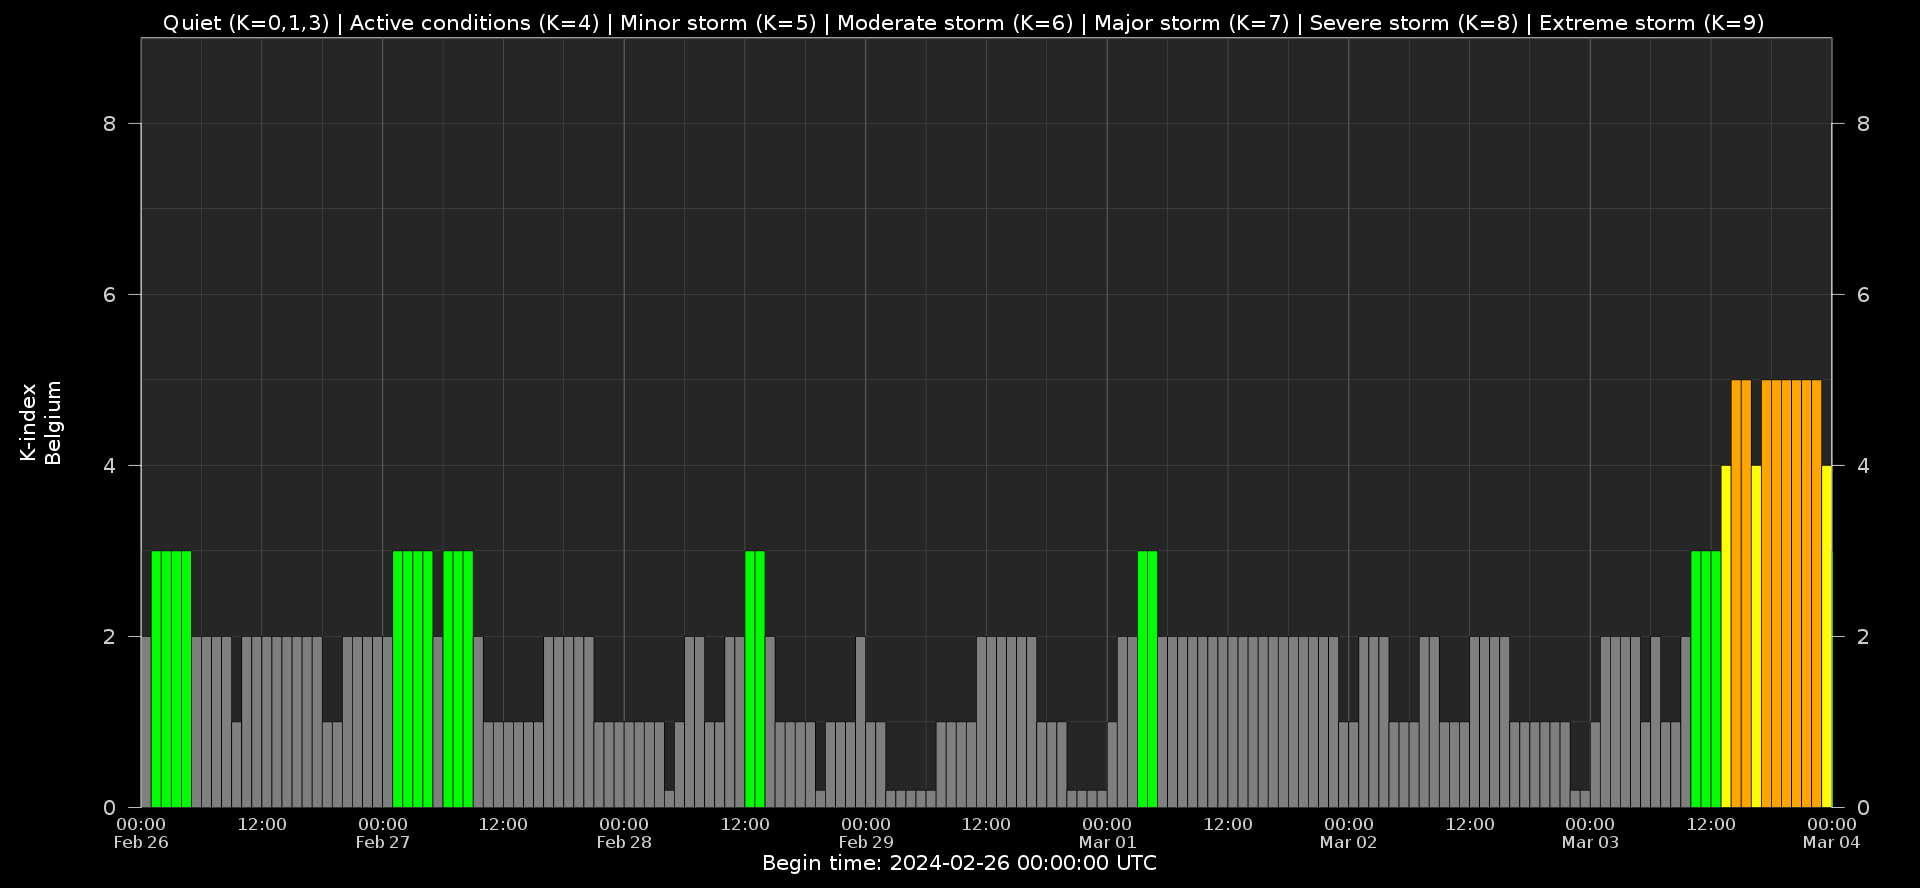
Local K-type magnetic activity index for Belgium based on data from Dourbes (DOU) and Manhay (MAB). Comparing the data from both measurement stations allows to reliably remove outliers from the magnetic data. At the same time the operational service availability is improved: whenever data from one observatory is not available, the single-station index obtained from the other can be used as a fallback system.
Both the two-station index and the single station indices are available here: http://ionosphere.meteo.be/geomagnetism/K_BEL/
The SIDC space weather briefing
The forecaster on duty presented the SIDC briefing that gives an overview of space weather from Feb 25 to Mar 3.
The pdf of the presentation can be found here: https://www.stce.be/briefings/20240304_SWbriefing.pdf
Review of Ionospheric Activity
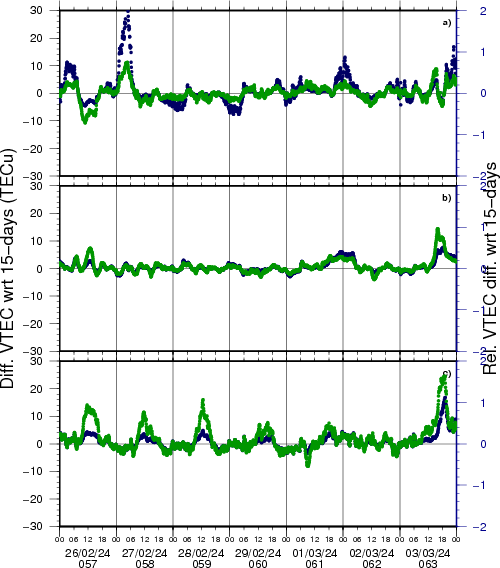
NEW! The time series below illustrates (in green) the VTEC deviation from normal quiet behaviour.
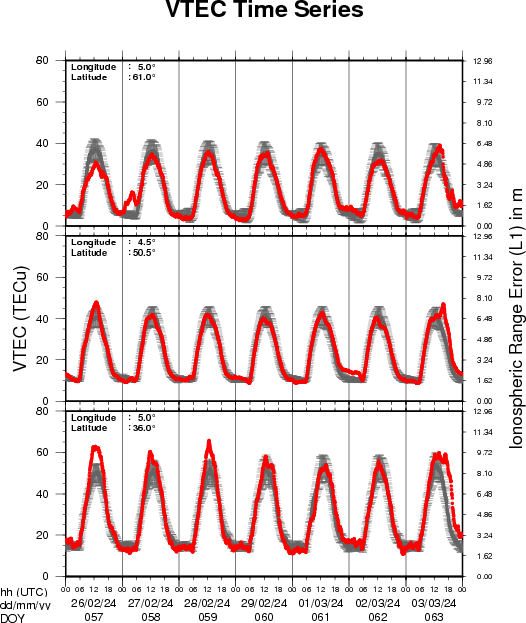
VTEC time series at 3 locations in Europe from 26 Feb 2024 till 3 Mar 2024
The top figure shows the time evolution of the Vertical Total Electron Content (VTEC) (in red) during the last week at three locations:
a) in the northern part of Europe(N 61deg E 5deg)
b) above Brussels(N 50.5deg, E 4.5 deg)
c) in the southern part of Europe(N 36 deg, E 5deg)
This top figure also shows (in grey) the normal ionospheric behaviour expected based on the median VTEC from the 15 previous days.
The time series below shows the VTEC difference (in green) and relative difference (in blue) with respect to the median of the last 15 days in the North, Mid (above Brussels) and South of Europe. It thus illustrates the VTEC deviation from normal quiet behaviour.
The VTEC is expressed in TECu (with TECu=10^16 electrons per square meter) and is directly related to the signal propagation delay due to the ionosphere (in figure: delay on GPS L1 frequency).
The Sun's radiation ionizes the Earth's upper atmosphere, the ionosphere, located from about 60km to 1000km above the Earth's surface.The ionization process in the ionosphere produces ions and free electrons. These electrons perturb the propagation of the GNSS (Global Navigation Satellite System) signals by inducing a so-called ionospheric delay.
See http://stce.be/newsletter/GNSS_final.pdf for some more explanations; for more information, see https://gnss.be/SpaceWeather
STCE courses and lectures
Courses and presentations with the Sun-Space-Earth system and Space Weather as the main theme. We provide occasions to get submerged in our world through educational, informative and instructive activities.
* March 26, Solar physics and Space Weather: Sunspots and Solar Radio Astronomy, online course - Registrations are open
* March 28-29, 2024, STCE Space Weather Introductory Course, focus on aviation, online - Registrations are open
* April 22-24, 2024, STCE Space Weather Introductory Course, Brussels, Belgium - Registrations are open
* April 26, Public presentation Proba-3: a solar eclipse maker, MIRA, Grimbergen
* April 30, Solar physics and Space Weather: Proba-2 and Proba-3, online course - Registrations are open
* May 3, STCE seminar An Echo of the Sun, Brussels, Belgium
* May 6, An Echo of the Sun, PhD defense Pepa Ivanova, Brussels, Belgium
* May 13, lecture by the STCE, From physics to forecasting, ESA Space Weather Training Course 2024, Euro Space Center, Redu, Belgium
* May 13 - 17, lectures by the STCE, solar and heliospheric weather; magnetosphere, ionosphere, aviation, and ground based impact, Course Operational Space Weather Fundamentals, L'Aquila, Italy
* May 18, Public presentation, The PROBA-3 Mission: Artificial Total Solar Eclipse in Space, FotonFest, Urania, Hove, Belgium
* May 28, Solar physics and Space Weather: Solar Orbiter Spacecraft, online course - Registrations are open
* June 9, Public presentation Total Eclipse of the Sun, Helios, Averbode, Belgium
* June 25, Solar physics and Space Weather: predictions and services, online course - Registrations are open
To register for a course or lecture, check the page of the STCE Space Weather Education Center: https://www.stce.be/SWEC
If you want your event in the STCE newsletter, contact us: stce_coordination at stce.be