- Table of Content
- 1.NOAA 13615
- 2.Preparing for ...
- 3.Review of sola...
- 4.International ...
- 5.PROBA2 Observa...
- 6.Noticeable Sol...
- 7.Geomagnetic Ob...
- 8.Review of Iono...
- 9.The SIDC Space...
- 10.STCE Activitie...
2. Preparing for the eclipse
3. Review of solar and geomagnetic activity
4. International Sunspot Number by SILSO
5. PROBA2 Observations
6. Noticeable Solar Events
7. Geomagnetic Observations in Belgium
8. Review of Ionospheric Activity
9. The SIDC Space Weather Briefing
10. STCE Activities
NOAA 13615
NOAA 13615 transited the solar disk from 17 March until early 31 March. It reached a maximum size of nearly 9 times the total surface area of the Earth. Its maximum length of nearly 20 degrees corresponded to 220.000 km, which is more than half the average Earth-Moon distance. With the emergence of magnetic flux starting around 20 March, several magnetic delta structures were created that further developed during the transit of the region. The SDO/HMI images (http://sdo.gsfc.nasa.gov/data/aiahmi/ ) underneath show the region in white light and the magnetogram. The latter shows in white positive polarity magnetic fields (field lines emerging from the solar interior) and in black negative polarity magnetic fields (field lines returning to the solar interior). The online version of this newsitem at https://www.stce.be/news/694/welcome.html has clips that cover the evolution of this active region from 19 March (12:00UTC) until 29 March (12:00UTC).

According to the preliminary NOAA reports (https://www.swpc.noaa.gov/products/solar-and-geophysical-event-reports ), NOAA 13615 was a very active flare producer, generating no less than 43 M-class flares and an X-class event (https://www.stce.be/news/693/welcome.html ). Such large numbers for M-class events are unusual, and we have to go back already all the way to October 2014 with NOAA 12192 for similar numbers. A table can be found underneath, with a correction for the rescaling applied (NOAA/SWPC - https://www.swpc.noaa.gov/products/goes-x-ray-flux ) ). In fact, there are only a dozen of sunspot groups that have produced around 40 M/X events, most of them appeared during SC21 and SC22. Usually, such prolific M-class factories also warrant an important number of X-class flares, in contrast to the single X-class event produced by NOAA 13615.

Six (6) M-class events produced by NOAA 13615 reached an intensity in the M5 to M9 range. In extreme ultraviolet (EUV), these flares had a similar outlook and very often resembled a "pillar of light". The imagery underneath shows the M9.4 flare produced on 30 March while the region was located very close to the southwest solar limb. On the left are images in H-alpha by the GONG network (https://gong2.nso.edu/products/tableView/table.php?configFile=configs/hAlpha.cfg ), showing the Sun's inner atmosphere ("chromosphere") at "cool" temperatures ranging from about 10.000 to 20.000 degrees. On the right are EUV images taken by GOES/SUVI 131 (https://www.swpc.noaa.gov/products/goes-solar-ultraviolet-imager-suvi ) showing the Sun's outer atmosphere ("corona") at temperatures of multi-million degrees. The online version has also clips of the M7 flare on 20 March, the M6 flare on 28 March, and the X1 flare.

Preparing for the eclipse
On 8 April 2024, a large part of the United States and Mexico will experience a total solar eclipse, with viewers getting the rare chance to see the Sun's stunning outer atmosphere from ground. Also at the STCE in Belgium, all eyes will be on the Sun. Three satellite instrument teams are preparing for unique, yet complementary, observations of this great eclipse.
Solar Orbiter and PROBA-2 have a front-row seat
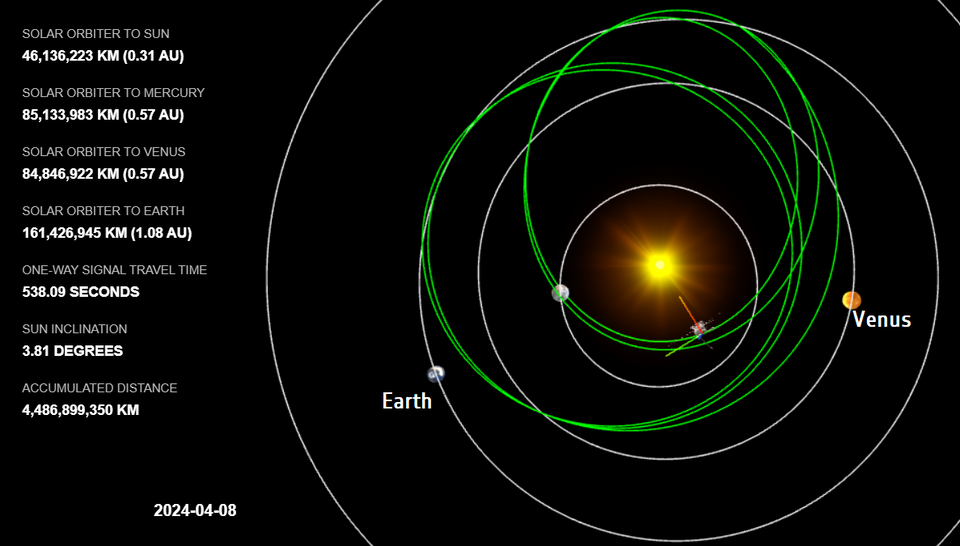
On the day of the eclipse, Solar Orbiter will be in a great location. 4 April 2024 marked the spacecraft's closest approach to the Sun in its egg-shaped orbit. These closest approaches happen roughly every six months. During the days before and after, all ten of the spacecraft's scientific instruments are on high alert.
What's more, Solar Orbiter will be observing the Sun side-on compared to our perspective on Earth. This means that the structures in the corona (the Sun's outer atmosphere) that we see at the right-hand side of the Sun from Earth will be seen directly face-on by the Solar Orbiter spacecraft.
PROBA-2, which is orbiting Earth at a fast pace, will provide observations of the eclipse from the Earth's perspective. Due to this fast orbit, the spacecraft will pass through the shadow of the Moon twice and the LYRA and SWAP instrument onboard will register two partial eclipses.
Together with the data from the Solar Orbiter instruments, these observations will form a unique dataset observing aan eclipse from complementary viewpoints.
Proba-3 as the ultimate eclipse chaser
An eclipse is a rare opportunity to see the solar corona, which though super-hot, is also very faint, and is therefore usually drowned out by the Sun's blindingly bright surface. The corona is fascinating for so many reasons, including because it is thought to be the origin of the solar wind.
To study the corona, scientists create their own artificial eclipse. The Metis instrument on board Solar Orbiter is an example of a coronagraph, a specialised instrument designed to block out the light of the Sun. The bigger the distance between the light-blocking disc and the camera photographing the corona, the less light spilt around the coronagraph and the better our view.
ESA's upcoming Proba-3 mission will be the ultimate coronagraph in space; two separate spacecraft will work together, one blocking the sunlight and the other observing the corona from 144 m away. This precision-flying experiment will let us observe closer to the solar rim than ever before.
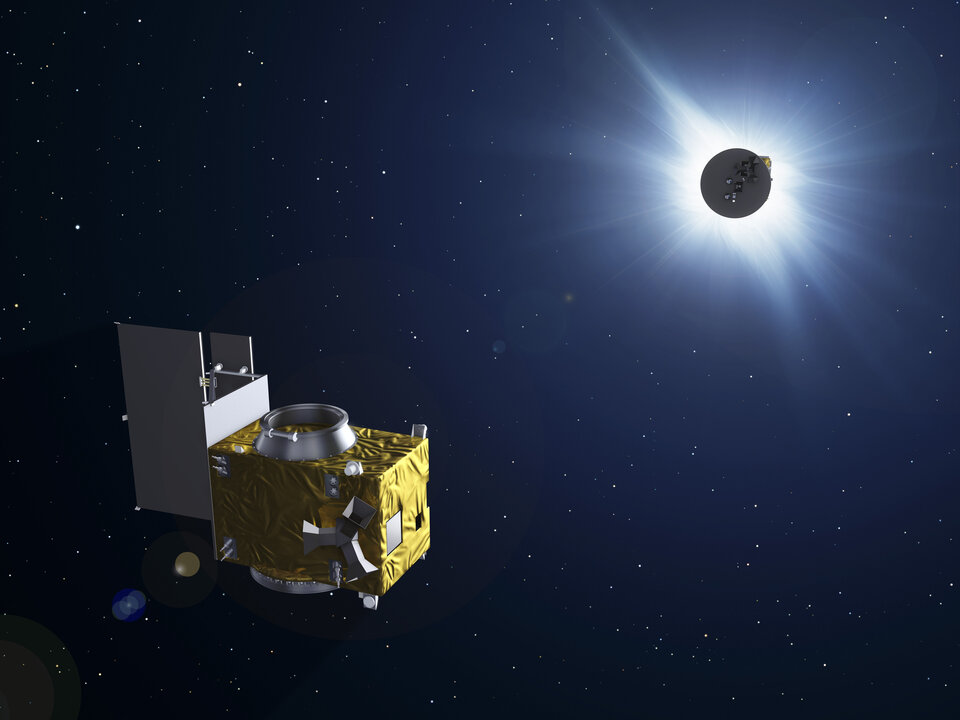
Proba-3's main goal is to test new technologies and techniques. But if it works, we can expect exciting discoveries about the Sun, which would complement the views from Solar Orbiter and PROBA-2.
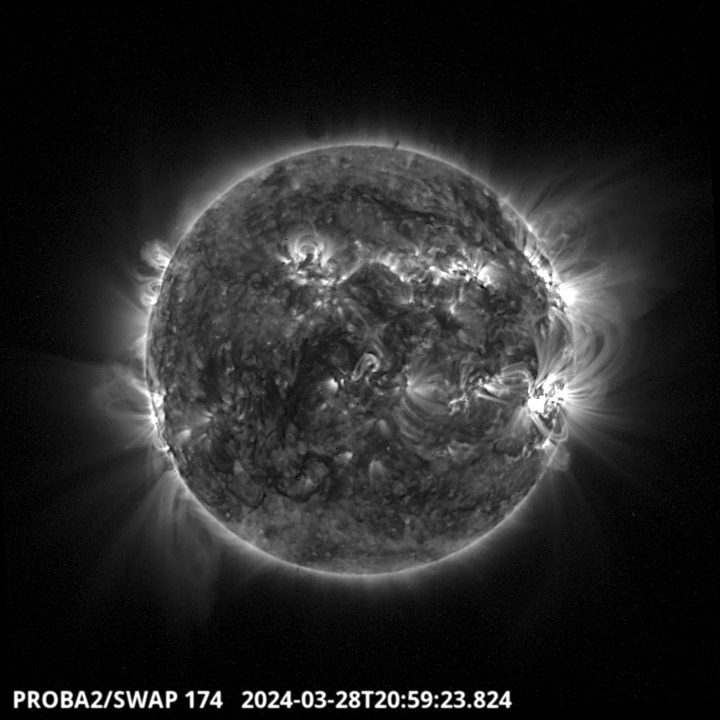
Proba-3 is due to launch later in 2024. To test out some of the science instruments the spacecraft will carry, a team of Proba-3 scientists and engineers are heading to Mexico during the total solar eclipse. There, they will try out the instruments on the real solar eclipse to ensure that they work in tip top condition in space. PROBA-2 will support this effort with SWAP mosaic observations taken close before the eclipse, to give the observers on ground an idea of what the extended corona will look like during the event.
More on PROBA-2 eclipse observations: https://proba2.sidc.be/Eclipse2024April8
Review of solar and geomagnetic activity
WEEK 1213 from 2024 Mar 25
Solar Active Regions (ARs) and flares
Solar flaring activity was at moderate to high levels. There was a total of 9 numbered active regions observed on the visible solar disk over the week. Catania region 22 (NOAA AR3615) was most the complex region (magnetic field configuration beta-gamma-delta) and dominated the flaring activity throughout the week producing multiple M-class flares each day and one X-class flare: an X1.1 flare with peak time 20:56 UTC on March 28. The region rotated off the disk on March 31, but continued to contribute to the flaring activity.
The remaining regions on disk were simple and mostly quiet with only a few additional C-class flares.
Coronal mass ejections
No Earth directed Coronal Mass Ejections (CMEs) have been detected in the available coronagraph imagery over the week.
Coronal Holes
Two small positive polarity coronal holes, one near the equator and one in the southern hemisphere, began to cross the central meridian on March 27. An extension of the northern polar coronal hole began to traverse the central meridian on March 31.
Proton flux levels
The greater than 10 MeV GOES proton flux was above the 10pfu threshold at the start of the week, due to the ongoing influence from a proton event associated with an X-flare from the previous week, on March 23. The proton flux was near values of 890 MeV, as measured by GOES-16 at the start of the week on March 24. The flux decreased over the week returning below this threshold value from 15:25 UTC March 25.
Electron fluxes at GEO
The greater than 2 MeV electron flux remained below the 1000 pfu threshold. The 24h electron fluence was at nominal levels.
Solar wind
At the start of the week, the solar wind conditions reflected an ICME arrival related to the halo CME first detected in LASCO/C2 data around 01:33 UTC on March 23. A fast forward shock was detected in the solar wind data (ACE) around 14:11 UTC on March 24. The solar wind speed jumped from 628 km/s to 821 km/s and the interplanetary magnetic field jumped from 11 nT to 17 nT. The total magnetic field and solar wind speeds both then increased further on March 24 to reach maximum values of 34 nT and 880 km/s, respectively. The Bz component was mostly negative with a minimum value of -27nT.
From March 25 the magnetic field decreased quickly to values around 5n T, while the solar wind speed remained elevated, decreasing slowly between March 25 and March 28.
Slow solar wind conditions dominated on March 29 and early on March 30. From around 12:00 UTC March 30, the interplanetary magnetic field and solar wind speed began to increase once again, due to the expected High Speed Stream (HSS) arrival from the positive polarity coronal holes, the total magnetic fields reached 14 nT and the solar wind speed reached 530 km/s on March 31.
Geomagnetism
The geomagnetic conditions reached major storm conditions (NOAA Kp 8 and Local K Bel 7) between 15:00 and 18:00 UTC March 24, coinciding with the arrival of the ICME. Conditions then reduced to moderate storm conditions (NOAA Kp 6 and Local K Bel 5) between 18:00 and 21:00 UT March 24. Active and minor storm conditions were reported on March 25 while the Earth was still under the influence of the ICME. The conditions then returned to quiet to unsettled levels between March 26 and March 30, increasing to active conditions on March 31 due to the HSS arrival.
International Sunspot Number by SILSO

The daily Estimated International Sunspot Number (EISN, red curve with shaded error) derived by a simplified method from real-time data from the worldwide SILSO network. It extends the official Sunspot Number from the full processing of the preceding month (green line), a few days more than one solar rotation. The horizontal blue line shows the current monthly average. The yellow dots give the number of stations that provided valid data. Valid data are used to calculate the EISN. The triangle gives the number of stations providing data. When a triangle and a yellow dot coincide, it means that all the data is used to calculate the EISN of that day.
PROBA2 Observations
Solar Activity
Solar flare activity fluctuated from low to high during the week.
In order to view the activity of this week in more detail, we suggest to go to the following website from which all the daily (normal and difference) movies can be accessed: https://proba2.oma.be/ssa
This page also lists the recorded flaring events.
A weekly overview movie (SWAP week 731) can be found here: https://proba2.sidc.be/swap/data/mpg/movies/weekly_movies/weekly_movie_2024_03_25.mp4.
Details about some of this week's events can be found further below.
If any of the linked movies are unavailable they can be found in the P2SC movie repository here: https://proba2.oma.be/swap/data/mpg/movies/.
Thursday March 28

The largest flare of this week was an X1.1, and it was observed by LYRA (top panel) and SWAP (bottom panel). The flare peaked on 2024-Mar-28 at 20:56 UT. It occurred on the western hemisphere close to the central meridian, and it originated from NOAA AR3615.
Find a SWAP movie of the event here: https://proba2.sidc.be/swap/movies/20240328_swap_movie.mp4.
Noticeable Solar Events
| DAY | BEGIN | MAX | END | LOC | XRAY | OP | 10CM | TYPE | Cat | NOAA |
| 25 | 0637 | 0644 | 0648 | S13W2 | M4.4 | SB | III/1V/3 | 22 | 3615 | |
| 26 | 0028 | 0036 | 0040 | S13W36 | M1.8 | SN | V/3III/3 | 22 | 3615 | |
| 26 | 1011 | 1017 | 1024 | M1.0 | 22 | 3615 | ||||
| 26 | 1036 | 1043 | 1052 | M1.3 | 22 | 3615 | ||||
| 26 | 1255 | 1330 | 1341 | M1.9 | 22 | 3615 | ||||
| 26 | 1341 | 1346 | 1350 | M1.7 | 22 | 3615 | ||||
| 26 | 2143 | 2158 | 2207 | M1.6 | ||||||
| 27 | 0137 | 0144 | 0152 | S13W37 | M1.1 | 1F | 22 | 3615 | ||
| 27 | 0633 | 0641 | 0650 | S11W48 | M1.1 | 1N | III/1 | 22 | 3615 | |
| 28 | 0616 | 0629 | 0636 | S16W55 | M7.1 | 1N | 22 | 3615 | ||
| 28 | 1540 | 1556 | 1603 | S13W58 | M6.1 | 1N | 22 | 3615 | ||
| 28 | 1921 | 1931 | 1938 | S13W59 | M1.1 | 1F | 22 | 3615 | ||
| 28 | 2050 | 2056 | 2101 | X1.1 | 22 | 3615 | ||||
| 28 | 2029 | 2056 | 2101 | S14W61 | X1.1 | 3B | III/1 | 22 | 3615 | |
| 29 | 0217 | 0230 | 0242 | S15W63 | M3.2 | SF | III/3 | 22 | 3615 | |
| 29 | 1919 | 1934 | 1956 | S12W78 | M1.2 | SF | 22 | 3615 | ||
| 30 | 2101 | 2116 | 2215 | M9.4 | I/2 | 3515 |
| LOC: approximate heliographic location | TYPE: radio burst type |
| XRAY: X-ray flare class | Cat: Catania sunspot group number |
| OP: optical flare class | NOAA: NOAA active region number |
| 10CM: peak 10 cm radio flux |
Geomagnetic Observations in Belgium

Local K-type magnetic activity index for Belgium based on data from Dourbes (DOU) and Manhay (MAB). Comparing the data from both measurement stations allows to reliably remove outliers from the magnetic data. At the same time the operational service availability is improved: whenever data from one observatory is not available, the single-station index obtained from the other can be used as a fallback system.
Both the two-station index and the single station indices are available here: http://ionosphere.meteo.be/geomagnetism/K_BEL/
Review of Ionospheric Activity
NEW! The time series below illustrates (in green) the VTEC deviation from normal quiet behaviour.


VTEC time series at 3 locations in Europe from 25 Mar 2024 till 31 Mar 2024
The top figure shows the time evolution of the Vertical Total Electron Content (VTEC) (in red) during the last week at three locations:
a) in the northern part of Europe(N 61deg E 5deg)
b) above Brussels(N 50.5deg, E 4.5 deg)
c) in the southern part of Europe(N 36 deg, E 5deg)
This top figure also shows (in grey) the normal ionospheric behaviour expected based on the median VTEC from the 15 previous days.
The time series below shows the VTEC difference (in green) and relative difference (in blue) with respect to the median of the last 15 days in the North, Mid (above Brussels) and South of Europe. It thus illustrates the VTEC deviation from normal quiet behaviour.
The VTEC is expressed in TECu (with TECu=10^16 electrons per square meter) and is directly related to the signal propagation delay due to the ionosphere (in figure: delay on GPS L1 frequency).
The Sun's radiation ionizes the Earth's upper atmosphere, the ionosphere, located from about 60km to 1000km above the Earth's surface.The ionization process in the ionosphere produces ions and free electrons. These electrons perturb the propagation of the GNSS (Global Navigation Satellite System) signals by inducing a so-called ionospheric delay.
See http://stce.be/newsletter/GNSS_final.pdf for some more explanations; for more information, see https://gnss.be/SpaceWeather
The SIDC Space Weather Briefing
The forecaster on duty presented the SIDC briefing that gives an overview of space weather from March 25 to 31.
The pdf of the presentation can be found here: https://www.stce.be/briefings/20240401_SWbriefing.pdf

STCE Activities
Courses and presentations with the Sun-Space-Earth system and Space Weather as the main theme. We provide occasions to get submerged in our world through educational, informative and instructive activities.
* April 22-24, STCE Space Weather Introductory Course, Brussels, Belgium - Registrations are open
* April 26, Public presentation Proba-3: a solar eclipse maker, MIRA, Grimbergen
* April 30, Solar physics and Space Weather: Proba-2 and Proba-3, online course - Registrations are open
* May 3, STCE seminar, An Echo of the Sun, Brussels, Belgium
* May 6, An Echo of the Sun, PhD defense Pepa Ivanova, Brussels, Belgium
* May 13, lecture by the STCE, From physics to forecasting, ESA Space Weather Training Course 2024, Euro Space Center, Redu, Belgium
* May 14, STCE Seminar, Segmentation, grouping and classification of sunspots from ground-based observations using deep learning methods, Brussels, Belgium
* May 13 - 17, lectures by the STCE, solar and heliospheric weather; magnetosphere, ionosphere, aviation, and ground based impact, Course Operational Space Weather Fundamentals, L'Aquila, Italy
* May 18, Public presentation, The PROBA-3 Mission: Artificial Total Solar Eclipse in Space, FotonFest, Urania, Hove, Belgium
* May 28, Solar physics and Space Weather: Solar Orbiter Spacecraft, online course - Registrations are open
* June 9, Public presentation Total Eclipse of the Sun, Helios, Averbode, Belgium
* June 25, Solar physics and Space Weather: predictions and services, online course - Registrations are open
* June 27, STCE annual meeting, Brussels, Belgium
* June 28, public presentation Help! Het stormt in de ruimte!?, Wetenschappelijke middagen, Brussels, Belgium
To register for a course or lecture, check the page of the STCE Space Weather Education Center: https://www.stce.be/SWEC
If you want your event in the STCE newsletter, contact us: stce_coordination at stce.be
