- Table of Content
- 1.Intense geomag...
- 2.Spot the moss,...
- 3.Review of sola...
- 4.International ...
- 5.PROBA2 Observa...
- 6.Noticeable Sol...
- 7.Geomagnetic Ob...
- 8.Review of Iono...
- 9.The SIDC Space...
- 10.STCE Activitie...
2. Spot the moss, spicules, and coronal rain
3. Review of solar and geomagnetic activity
4. International Sunspot Number by SILSO
5. PROBA2 Observations
6. Noticeable Solar Events
7. Geomagnetic Observations in Belgium
8. Review of Ionospheric Activity
9. The SIDC Space Weather Briefing
10. STCE Activities
Intense geomagnetic storms during SC25
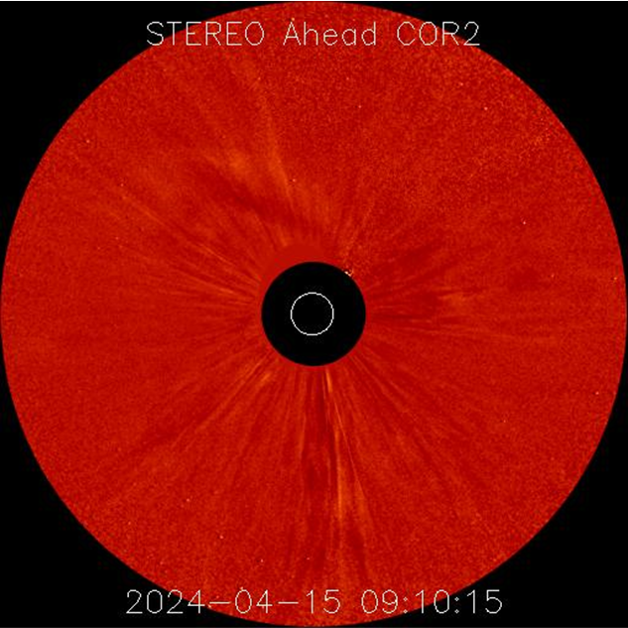
Despite the high sunspot numbers and numerous M-class flares of the last few weeks, only few coronal mass ejections (CMEs) had an earth-directed component and even less created a decent geomagnetic storm. The sole strong geomagnetic storm (Kp=7) during the month of April occurred on the 19th. The source CME was faint and slow. The coronagraph on board of STEREO-A (http://stereo-ssc.nascom.nasa.gov/beacon/beacon_secchi.shtml ) captured it while it was moving to the north and northeast on 15 April.
The table underneath provides the Top 10 of most significant geomagnetic events so far this solar cycle (SC25). It contains mostly events for which the Disturbance storm-time index (Dst - see the STCE Space Weather classification page at https://www.stce.be/educational/classification for more info) reaches -100 nT or less. The table contains the date of the storm, the Dst (provisional values; Kyoto WDC - https://wdc.kugi.kyoto-u.ac.jp/ ), the final Kp (from Potsdam GFZ - https://kp.gfz-potsdam.de/en/ ), and the K BEL index as recorded in Dourbes, Belgium (http://ionosphere.meteo.be/geomagnetism/K_BEL/ ). The last column gives the source of the disturbance, but in this case, all the geomagnetic storms had an interplanetary CME (ICME) as their source. It is expected that starting during the upcoming solar cycle maximum and subsequent declining phase of SC25, there's a good chance that the co-rotating interaction region preceding the high speed stream from a coronal hole (CH CIR; see this STCE newsitem at http://www.stce.be/news/269/welcome.html for more info on CIRs) will cause some noteworthy events that will stir intense geomagnetic storms (Dst lower than -100 nT). It is well-known that ICMEs can produce much stronger geomagnetic storms than CH wind streams and CH CIRs.
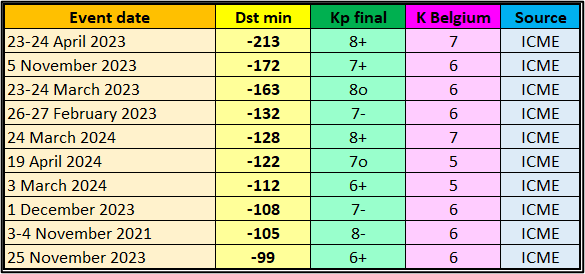
As can be seen, and ranked according to the provisional values of the Dst index, the severe geomagnetic storm from 23-24 April 2023 remains the strongest event so far this solar cycle. With -213 nT, it nests itself between the Top 2 of the previous solar cycle, the famous events of 17-18 March 2015 ("St-Patrick Day's storm" - https://www.stce.be/news/301/welcome.html ) and 22-23 June 2015 ("Solstice storm" - https://www.stce.be/news/313/welcome.html ) which had final Dst values of respectively -234 nT and -198 nT. The table also shows that there's some difference between the individual parameters, i.e. the highest Kp or K_BEL values do not necessarily connect to the storm with the lowest Dst values. This is of course because they are different geomagnetic parameters, with different groups of stations measuring different aspects of geomagnetic activity. Also, the geomagnetic conditions preceding the main storm plays a factor in this. The picture underneath shows polar lights over Lofoten in northern Norway, and was taken by Johny Goerend during the previous solar cycle minimum in 2020.

Spot the moss, spicules, and coronal rain
(Find the full video here: https://www.stce.be/movies/orig-2404_033_AR_EN.mp4)
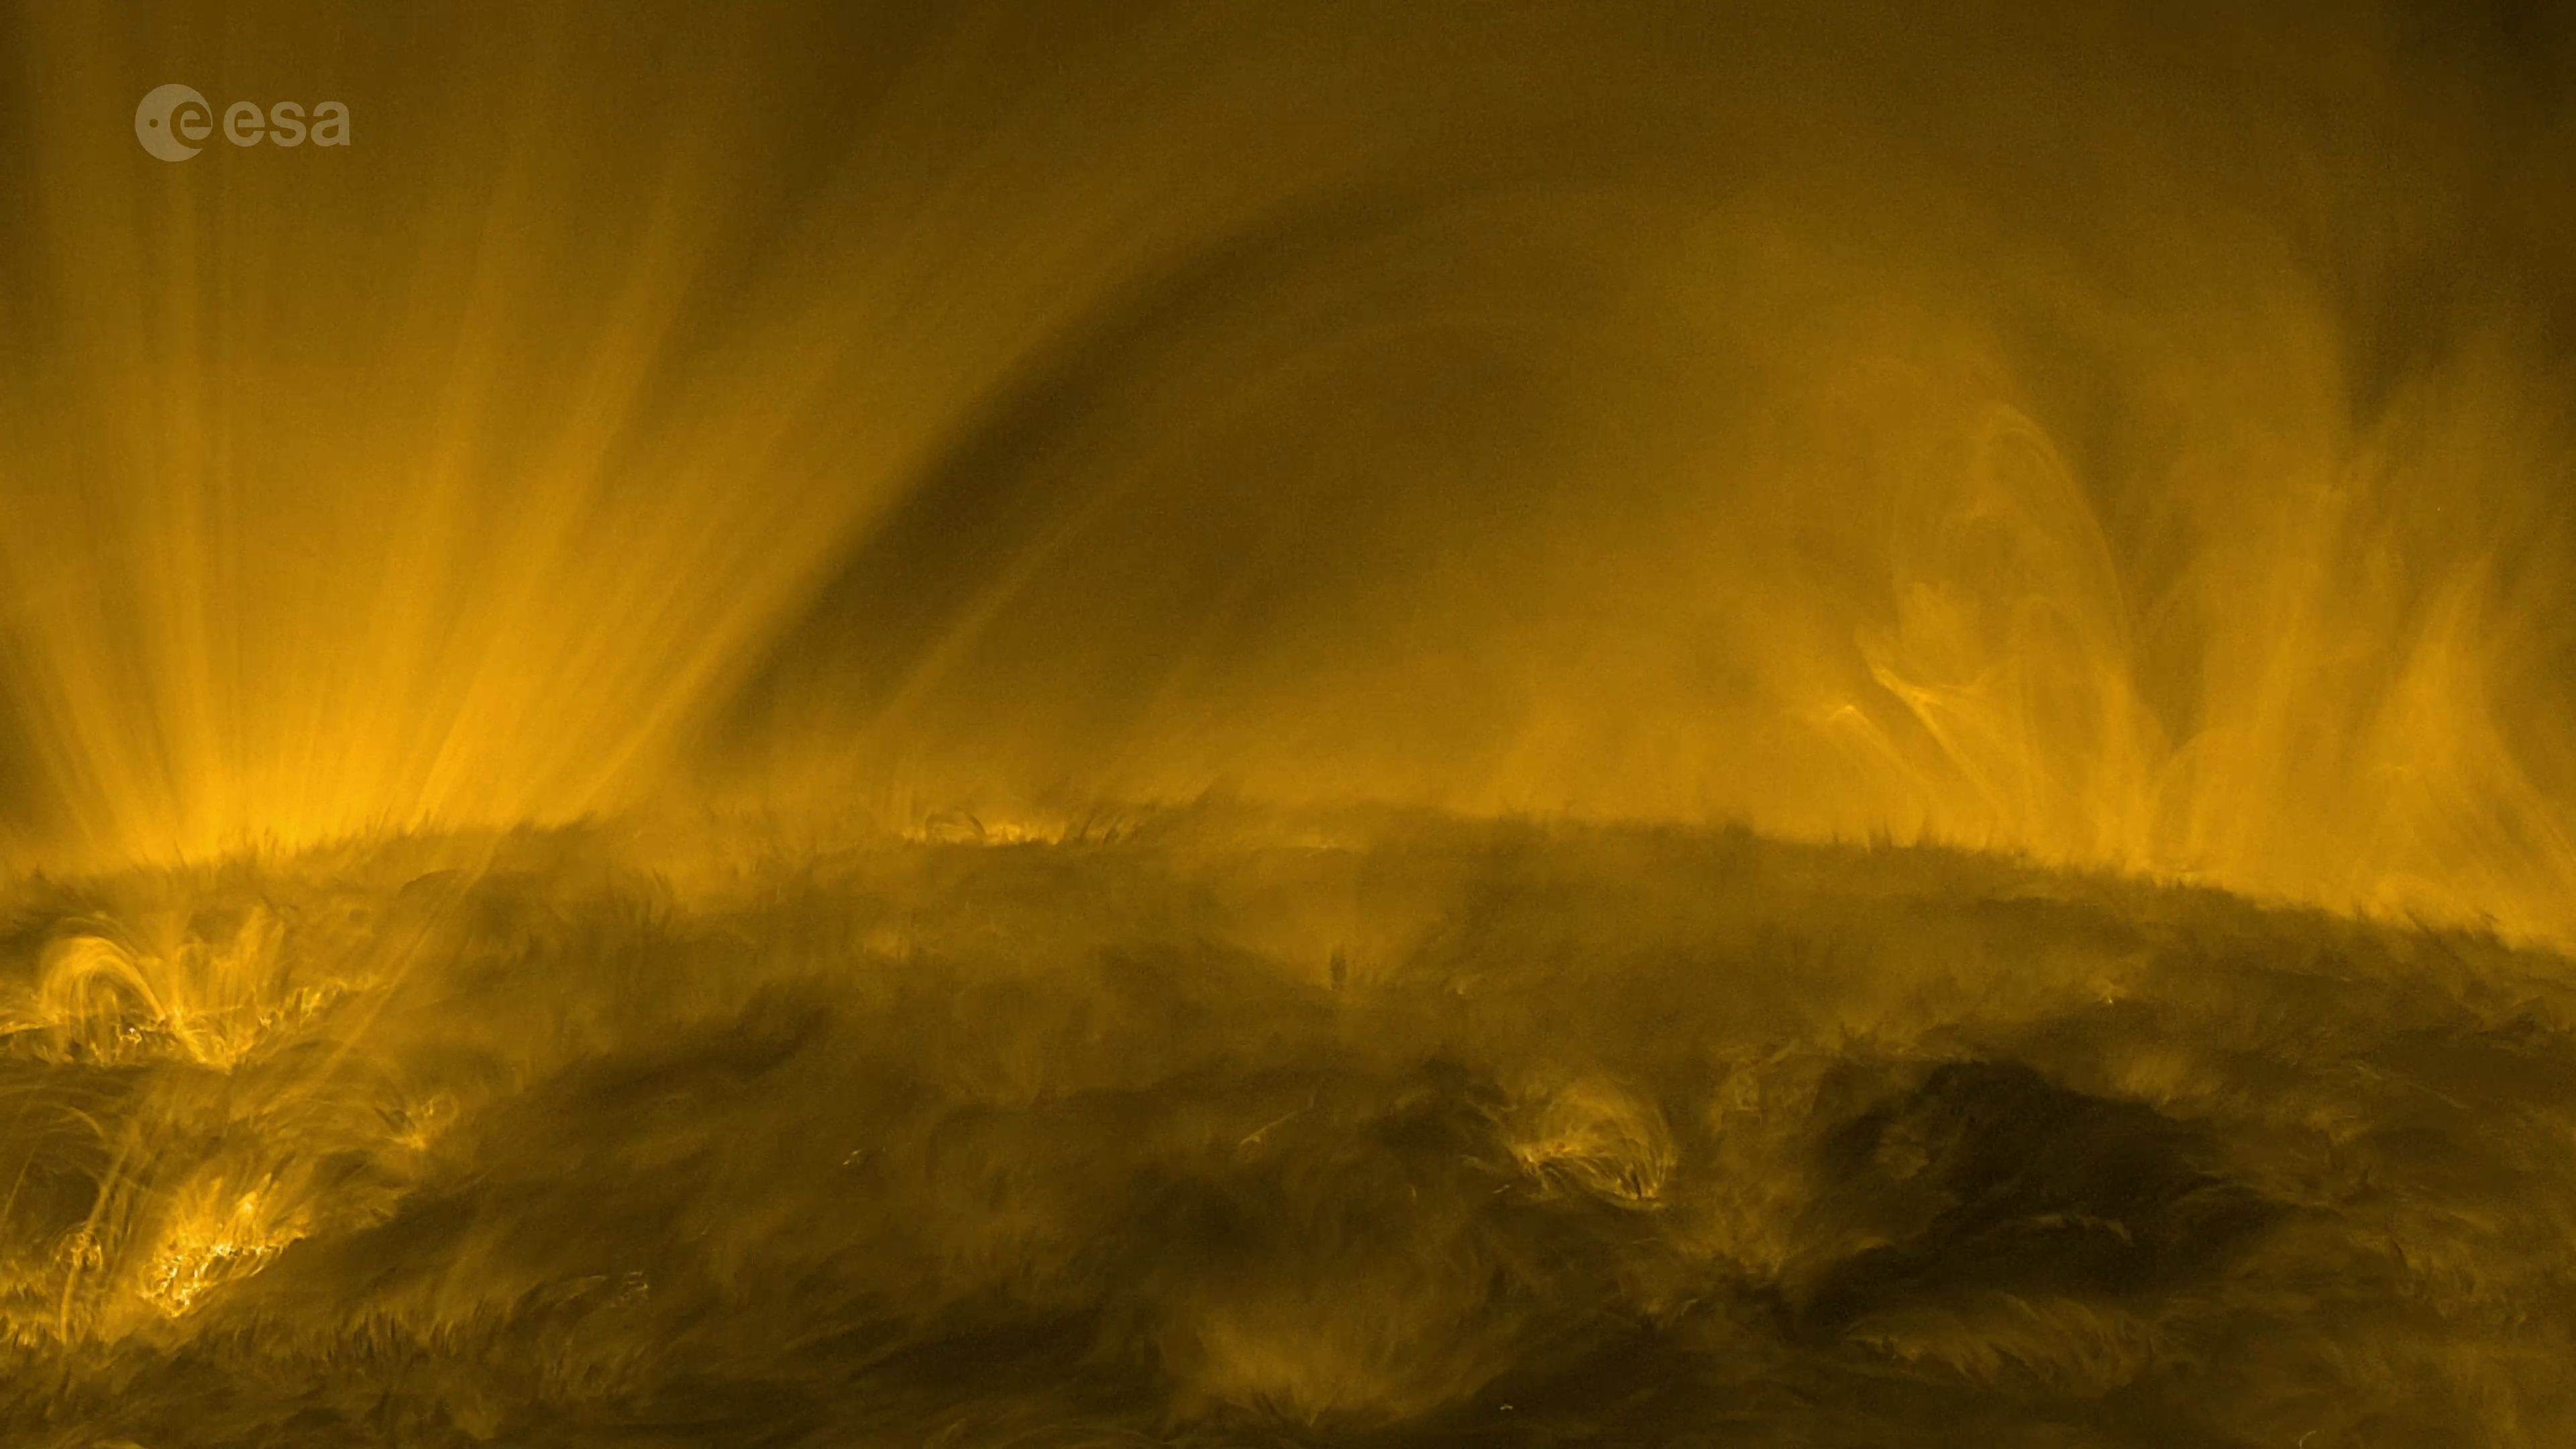
This video was recorded on 27 September 2023 by the Extreme Ultraviolet Imager (EUI) instrument on Solar Orbiter. At the time, the spacecraft was at roughly a third of the Earth’s distance from the Sun, heading for a closest approach of 43 million km on 7 October.
This otherworldly, ever-changing landscape is what the Sun looks like up close. ESA's Solar Orbiter filmed the transition from the Sun's lower atmosphere to the much hotter outer corona. The hair-like structures are made of charged gas (plasma), following magnetic field lines emerging from the Sun's interior.
Spot the moss, spicules, eruption and rain
Lower left corner: An intriguing feature visible throughout this movie is the bright gas that makes delicate, lace-like patterns across the Sun. This is called coronal ‘moss’. It usually appears around the base of large coronal loops that are too hot or too tenuous to be seen with the chosen instrument settings.
On the solar horizon: Spires of gas, known as spicules, reach up from the Sun’s chromosphere. These can reach up to a height of 10 000 km.
Centre around 0:22: A small eruption in the centre of the field of view, with cooler material being lifted upwards before mostly falling back down. Don’t be fooled by the use of ‘small’ here: this eruption is bigger than Earth!
Centre-left around 0:30: ‘Cool’ coronal rain (probably less than 10 000 °C) looks dark against the bright background of large coronal loops (around one million degrees). The rain is made of higher-density clumps of plasma that fall back towards the Sun under the influence of gravity.
The full resolution movie with and without annotations can also be found on the ESA webpage: https://www.esa.int/ESA_Multimedia/Videos/2024/04/The_Sun_s_fluffy_corona_in_exquisite_detail
Review of solar and geomagnetic activity
WEEK 1217 from 2024 Apr 22
Solar Active Regions and flares
The solar flaring activity over the past week was predominantly at moderate levels with daily M-class flaring. There were over twenty numbered and several unnumbered active regions (ARs) on the visible solar disk. The most notable ones in the first half of the week were NOAA AR 3639, NOAA AR 3643, NOAA AR 3645 and NOAA AR 3647, which reached high magnetic complexity with beta-gamma, beta-delta or beta-gamma-delta magnetic type classification. Towards the end of the week NOAA 3654 (beta-gamma) became the largest and most complex region triggering most of the solar flaring activity. The strongest activity was an M3.6 flare, start time 03:06 UTC, end time 03:37 UTC, peak time 03:19 UTC on April 23rd, produced by NOAA AR 3654 (beta).
Coronal mass ejections
There were multiple filament eruptions on disk throughout the week, some related to coronal mass ejections (CMEs) with possible minor Earth-directed component. A slow partial halo CME was observed in the LASCO/C2 coronagraph imagery starting at 18:00 UTC on April 23rd. The CME propagated to the south-west with an estimated projected velocity below 380 km/s. The eruption appeared related to an M2.9 flare, peak time 17:44 UTC on April 23rd, produced by NOAA AR 3638 (beta). An associated type II radio emission was observed starting at 17:10 UTC on April 23rd with estimated velocity of 358 km/s. Analysis of this event suggested no to possibly minor glancing blow impact on Earth late on April 27th.
Coronal Holes
Multiple positive polarity coronal holes and one long and patchy negative polarity coronal hole (stretching from high northern to equatorial latitudes) have crossed the central meridian throughout the week.
Proton flux levels
The greater than 10 MeV proton flux was at nominal levels throughout the entire week.
Electron fluxes at GEO
The greater than 2 MeV electron flux as measured by GOES 16 was below the 1000 pfu threshold throughout most of the week, except on April 25th. The greater than 2 MeV electron flux as measured by GOES 18 was partially exceeding the 1000 pfu threshold in the period April 21st-April 25th. The electron fluence was at nominal levels throughout the entire week.
Solar wind
The week started with a slightly enhanced solar wind conditions due to a mixed influence of connection to a high speed stream from a negative polarity coronal hole and the waning influence of a mild ICME arrival. Pristine slow solar wind conditions were observed in the middle of the week, followed by a mild ICME arrival on April 26th mixed with the influence of a connection to a high speed stream from a positive polarity coronal hole. The solar wind speed throughout the week was mostly below 500 km/s. The interplanetary magnetic field reached a maximum of 16.85 nT on April 27th with a minimum Bz of -11.6 nT. The interplanetary magnetic field was switching orientation between negative and positive sectors.
Geomagnetism
The geomagnetic conditions were at quiet to active levels in the beginning of the week. Mostly quiet conditions were observed in the period of April 22nd throughout April 25th. Isolated minor storm levels were registered late on April 26th, followed by quiet to active conditions throughout the end of the week.
International Sunspot Number by SILSO
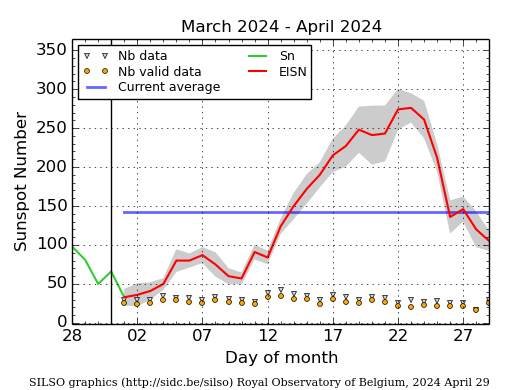
The daily Estimated International Sunspot Number (EISN, red curve with shaded error) derived by a simplified method from real-time data from the worldwide SILSO network. It extends the official Sunspot Number from the full processing of the preceding month (green line), a few days more than one solar rotation. The horizontal blue line shows the current monthly average. The yellow dots give the number of stations that provided valid data. Valid data are used to calculate the EISN. The triangle gives the number of stations providing data. When a triangle and a yellow dot coincide, it means that all the data is used to calculate the EISN of that day.
PROBA2 Observations
Solar Activity
Solar flare activity fluctuated from low to moderate during the week. In order to view the activity of this week in more detail, we suggest to go to the following website from which all the daily (normal and difference) movies can be accessed: https://proba2.oma.be/ssa
This page also lists the recorded flaring events. A weekly overview movie can be found here(SWAP week 735). https://proba2.sidc.be/swap/data/mpg/movies/weekly_movies/weekly_movie_2024_04_22.mp4
Details about some of this week's events can be found further below.
If any of the linked movies are unavailable they can be found in the P2SC movie repository here: https://proba2.sidc.be/swap/data/mpg/movies/
Monday Apr 22
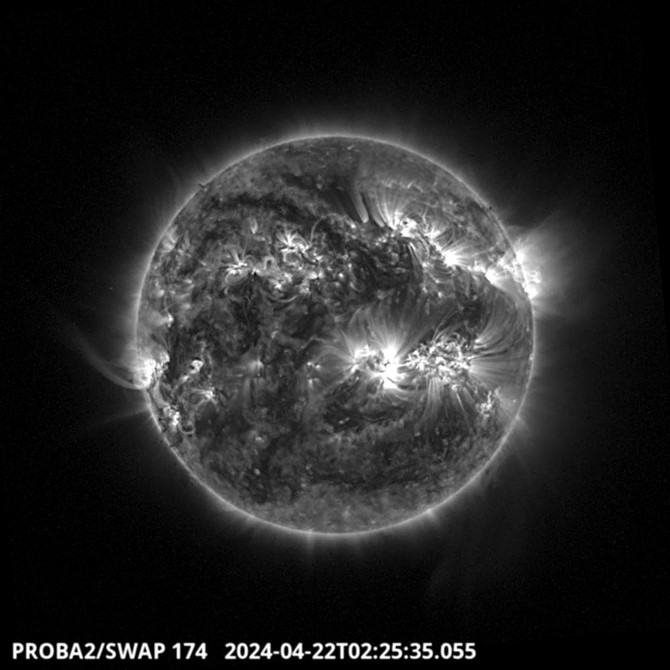
Several jets of plasma have been ejected from the active and complex NOAA region 3638 located on the South-West region of the solar disk. Find a SWAP movie of the event here: https://proba2.sidc.be/swap/movies/20240422_swap_movie.mp4
Wednesday 24
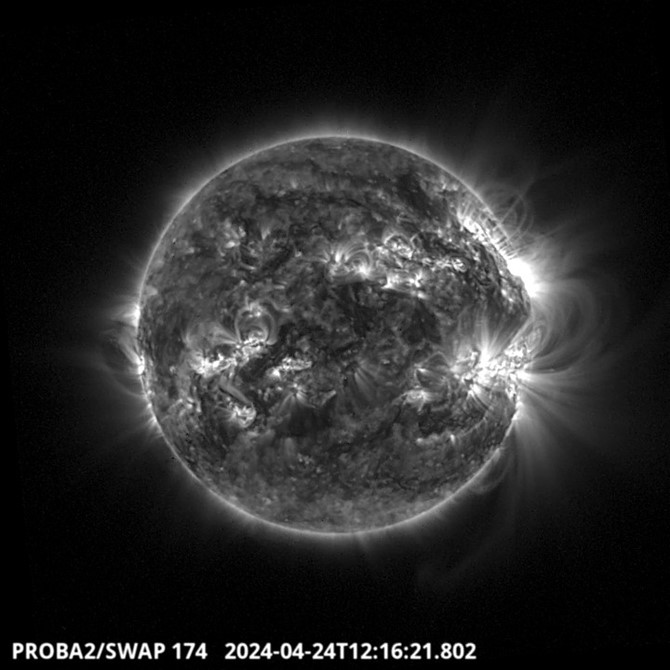
Numerous M flares occurred during this week. One of them, a M1.4, was produced around 12:16 UT on April 24 by the largest beta-gamma NOAA active region 3645. Find a SWAP movie of the event here: https://proba2.sidc.be/swap/movies/20240424_swap_movie.mp4
Friday Apr 26
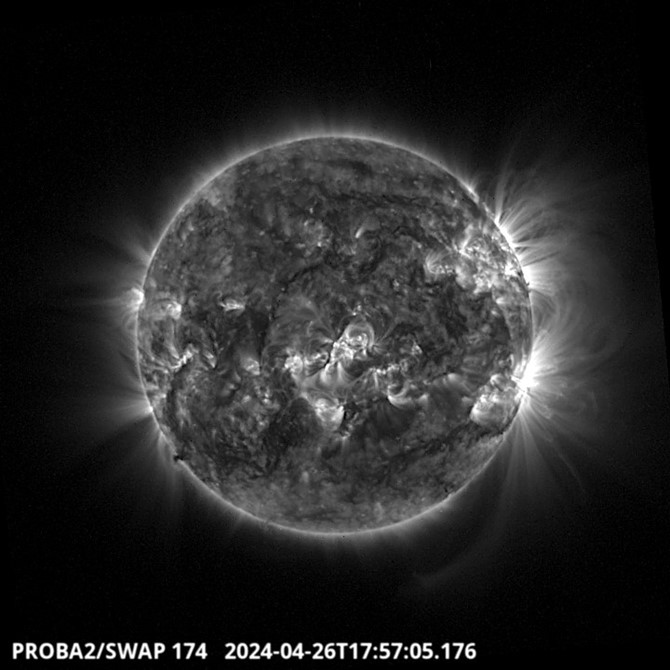
A large filament eruption was observed in the south-east part of the solar disk around 18:00 UTC. A coronal mass ejection (CME) resulted from this eruption. Find a SWAP movie of the event here: https://proba2.sidc.be/swap/movies/20240426_swap_movie.mp4
Noticeable Solar Events
| DAY | BEGIN | MAX | END | LOC | XRAY | OP | 10CM | TYPE | Cat | NOAA |
| 22 | 0758 | 0813 | 0830 | S7W36 | M1.0 | SF | VI/2 | 60 | 3645 | |
| 22 | 1313 | 1335 | 1417 | S10W39 | M1.6 | 1N | VI/2 | 60 | 3645 | |
| 22 | 1446 | 1455 | 1508 | N23E7 | M1.1 | 1F | 60 | 3645 | ||
| 22 | 1508 | 1519 | 1532 | N23E7 | M1.6 | 1F | 64 | 3646 | ||
| 22 | 1541 | 1550 | 1558 | S11E67 | M2.8 | SN | III/3 | 3656 | ||
| 22 | 1626 | 1630 | 1636 | M1.0 | III/2 | 3656 | ||||
| 22 | 2105 | 2116 | 2124 | S17W48 | M1.5 | 1N | VI/1III/3II/3 | 59 | 3638 | |
| 23 | 0306 | 0319 | 0335 | M3.6 | III/1 | 3654 | ||||
| 23 | 0807 | 0821 | 0829 | S5E41 | M3.0 | 1B | VI/3 | 3654 | ||
| 23 | 1733 | 1744 | 1752 | S8W59 | M2.9 | SF | III/3II/2 | 59 | 3638 | |
| 24 | 0013 | 0029 | 0038 | S20W62 | M1.7 | SF | 59 | 3638 | ||
| 24 | 0230 | 0239 | 0244 | M1.8 | V/2 | 59 | 3638 | |||
| 24 | 1207 | 1214 | 1239 | M1.4 | 60 | 3645 | ||||
| 24 | 2227 | 2250 | 2254 | M1.1 | III/1VI/1 | 62 | 3647 | |||
| 24 | 2254 | 2259 | 2305 | M2.0 | 59 | 3638 | ||||
| 25 | 0140 | 0149 | 0201 | M1.0 | 60 | 3645 | ||||
| 25 | 1311 | 1321 | 1327 | M1.0 | V/3III/1 | 59 | 3638 | |||
| 25 | 1703 | 1712 | 1716 | M1.3 | III/2 | 59 | 3638 | |||
| 27 | 1223 | 1235 | 1244 | S7W15 | M2.1 | SN | CTM/1 | 74 | 3654 | |
| 27 | 2129 | 2140 | 2149 | M3.0 | III/2 | 74 | 3654 |
| LOC: approximate heliographic location | TYPE: radio burst type |
| XRAY: X-ray flare class | Cat: Catania sunspot group number |
| OP: optical flare class | NOAA: NOAA active region number |
| 10CM: peak 10 cm radio flux |
Geomagnetic Observations in Belgium
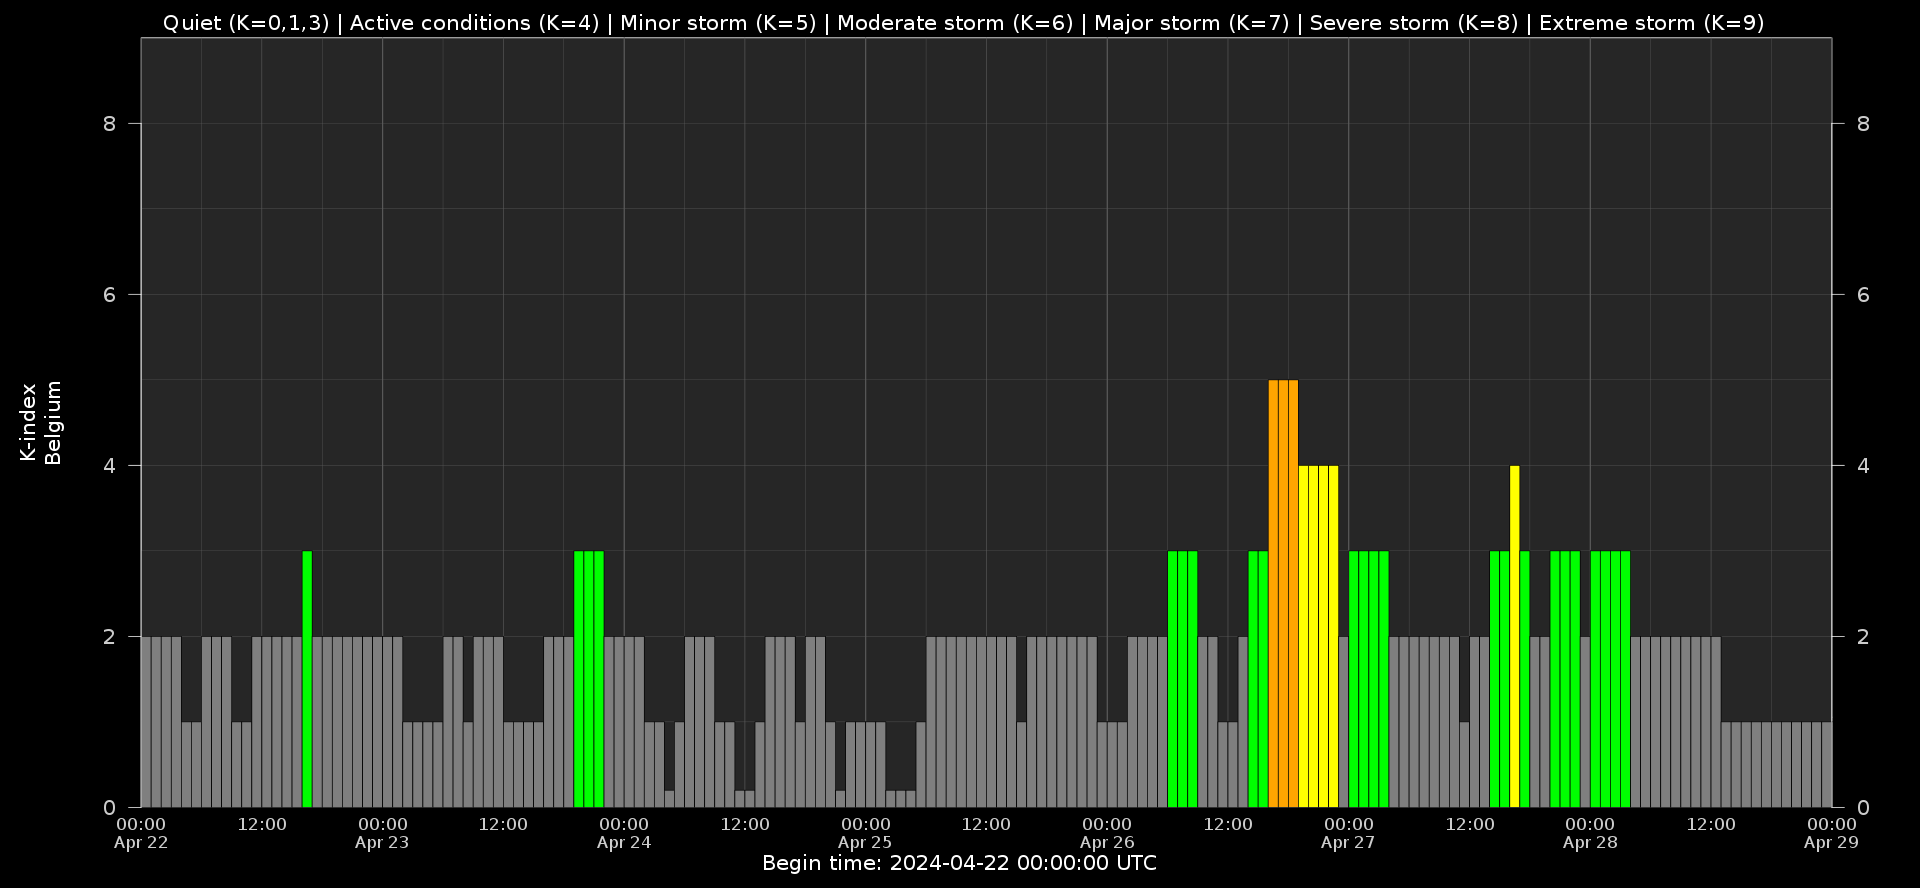
Local K-type magnetic activity index for Belgium based on data from Dourbes (DOU) and Manhay (MAB). Comparing the data from both measurement stations allows to reliably remove outliers from the magnetic data. At the same time the operational service availability is improved: whenever data from one observatory is not available, the single-station index obtained from the other can be used as a fallback system.
Both the two-station index and the single station indices are available here: http://ionosphere.meteo.be/geomagnetism/K_BEL/
Review of Ionospheric Activity
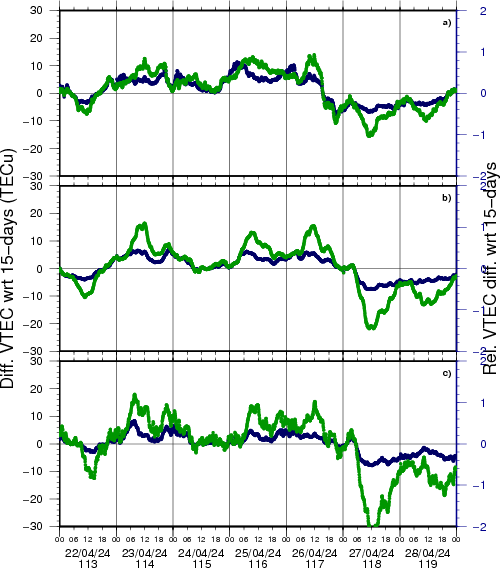
NEW! The time series below illustrates (in green) the VTEC deviation from normal quiet behaviour.
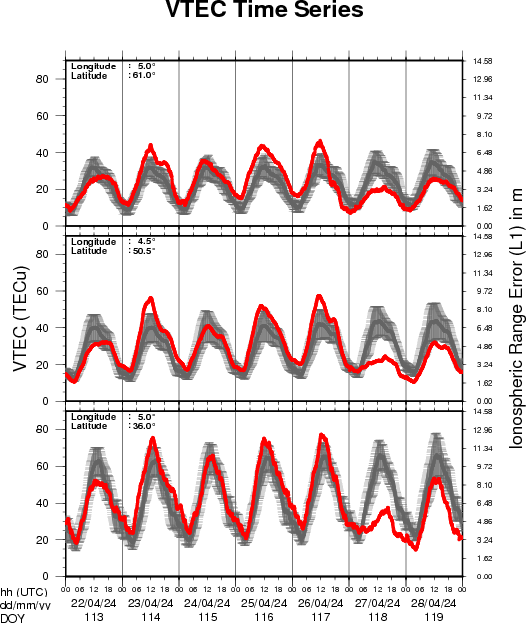
VTEC time series at 3 locations in Europe from 22 Apr 2024 till 28 Apr 2024
The top figure shows the time evolution of the Vertical Total Electron Content (VTEC) (in red) during the last week at three locations:
a) in the northern part of Europe(N 61deg E 5deg)
b) above Brussels(N 50.5deg, E 4.5 deg)
c) in the southern part of Europe(N 36 deg, E 5deg)
This top figure also shows (in grey) the normal ionospheric behaviour expected based on the median VTEC from the 15 previous days.
The time series below shows the VTEC difference (in green) and relative difference (in blue) with respect to the median of the last 15 days in the North, Mid (above Brussels) and South of Europe. It thus illustrates the VTEC deviation from normal quiet behaviour.
The VTEC is expressed in TECu (with TECu=10^16 electrons per square meter) and is directly related to the signal propagation delay due to the ionosphere (in figure: delay on GPS L1 frequency).
The Sun's radiation ionizes the Earth's upper atmosphere, the ionosphere, located from about 60km to 1000km above the Earth's surface.The ionization process in the ionosphere produces ions and free electrons. These electrons perturb the propagation of the GNSS (Global Navigation Satellite System) signals by inducing a so-called ionospheric delay.
See http://stce.be/newsletter/GNSS_final.pdf for some more explanations; for more information, see https://gnss.be/SpaceWeather
The SIDC Space Weather Briefing
The forecaster on duty presented the SIDC briefing that gives an overview of space weather from APril 22 to 28.
The pdf of the presentation can be found here: https://www.stce.be/briefings/20240429_SWbriefing.pdf
STCE Activities
Courses and presentations with the Sun-Space-Earth system and Space Weather as the main theme. We provide occasions to get submerged in our world through educational, informative and instructive activities.
* May 3, STCE seminar, An Echo of the Sun
* May 6, An Echo of the Sun, PhD defense Pepa Ivanova, Brussels, Belgium
* May 13, lecture by the STCE, From physics to forecasting, ESA Space Weather Training Course 2024, Euro Space Center, Redu, Belgium
* May 14, STCE Seminar, Segmentation, grouping and classification of sunspots from ground-based observations using deep learning methods
* May 13 - 17, lectures by the STCE, solar and heliospheric weather; magnetosphere, ionosphere, aviation, and ground based impact, Course Operational Space Weather Fundamentals, L'Aquila, Italy
* May 18, Public presentation, The PROBA-3 Mission: Artificial Total Solar Eclipse in Space, FotonFest, Urania, Hove, Belgium
* May 28, Solar physics and Space Weather: Solar Orbiter Spacecraft, online course - Registrations are open
* June 4, STCE seminar, title TBC
* June 7, STCE seminar, Ground level enhancements: probing conditions of the geospace environment
* June 9, Public presentation Total Eclipse of the Sun, Helios, Averbode, Belgium
* June 13, STCE seminar, Solar Prominence Eruptions: Insights from UV Imaging with EUI/FSI
* June 25, Solar physics and Space Weather: predictions and services, online course - Registrations are open
* June 27, STCE annual meeting, Brussels, Belgium
* June 28, public presentation Help! Het stormt in de ruimte!?, Wetenschappelijke middagen, Brussels, Belgium
To register for a course or lecture, check the page of the STCE Space Weather Education Center: https://www.stce.be/SWEC
If you want your event in the STCE newsletter, contact us: stce_coordination at stce.be
.png)