
We signed up for a period with more activity after a long time of flaring silence. The long duration C8.0 flare in the night between May 2 and 3 was the starting shot of a new series of M-flares.
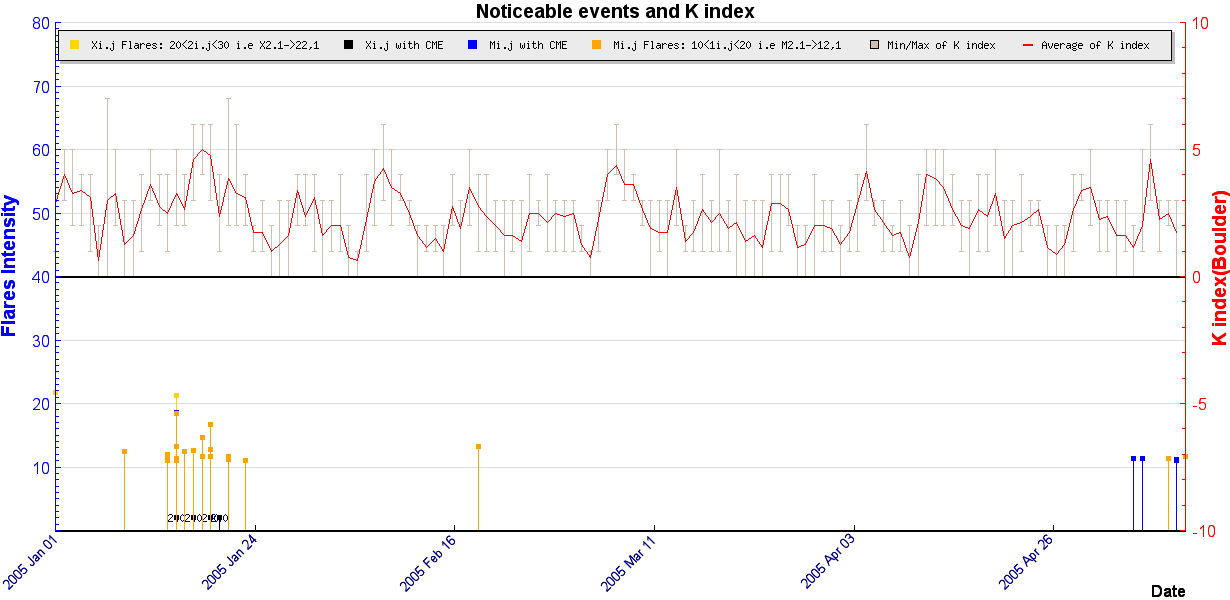
An extended private data-base of the forecasts done and recorded observations was created by one of our staff members, offering the forecaster the possibility to visualize and combine in a graph past and current solar activity indices, like number of C, M, X flares, flare duration, 10cm flux, K-index, background X-radiation, … The graph above gives an overview of the X- and M-class flares that happened since January 1, 2005 up till now. Similarly, the daily averaged planetary K-index as estimated by Boulder is plotted together with the maximum and minimum value of that day. [Please note that averaging of the Kp-index should not be done, as it represents non-linear deviations of the geomagnetic field]. Some explanation about the way the strength of a flare is indicated. For example, a M3.4 flare is plotted as a blue or orange square with the y-value of 13.4 where '1' stands for M. A X5.3 flare (without accompanying coronal mass ejection (CME)) is plotted as a yellow square with the y-value of 25.3 where '2' stands for X. The horizontal band between 10 and 20 is reserved for M-flares, while the band above 20 is reserved for X-flares. The black squares are X-flares with an accompanying CME, no numerical value for the intensity is given (ignore the '2' and 'c' symbols in the plot). C-flares are not plotted as they are not included in the noticeable events list.
During the second week of January, we had an agitated Sun firing many M-class flares and even 5 X-class flares! On February 19, there was one isolated M-flare. After this flare, the active regions seem not to have enough energy and complexity. We had a long period of low flaring activity, until May 6 when sunspot group 57 (NOAA 0576) produced an M1.3 flare. This flare is seen in the plot as the first blue square. The minor geomagnetic storm on May 8 (Kp=6) was caused by the arrival of a CME associated with a C8.5 flare on May 6.
