- Table of Content
- 1.Extreme solar ...
- 2.At the movies:...
- 3.Review of spac...
- 4.Noticeable Sol...
- 5.International ...
- 6.PROBA2 Observa...
- 7.Geomagnetic Ob...
- 8.The SIDC Space...
- 9.Review of Iono...
- 10.STCE training ...
2. At the movies: Dancing in the rain
3. Review of space weather
4. Noticeable Solar Events
5. International Sunspot Number by SILSO
6. PROBA2 Observations (16 Feb 2026 - 22 Feb 2026)
7. Geomagnetic Observations in Belgium
8. The SIDC Space Weather Briefing
9. Review of Ionospheric Activity
10. STCE training courses, lectures and workshops
Extreme solar wind conditions
Many aspects of the extraordinary solar storm of 19 January 2026 have already been discussed in previous newsitems (see the STCE news archive at https://www.stce.be/news ). In this newsitem, the peculiar solar wind conditions that accompanied the passage of the interplanetary coronal mass ejection (CME) are highlighted. The table underneath is based on the solar wind data obtained by the Advanced Composition Explorer (ACE - https://www.swpc.noaa.gov/products/ace-real-time-solar-wind ; since 1998) and the Deep Space Climate Observatory (DSCOVR ; since 2016). Solar wind data obtained by both spacecraft can be accessed online at https://www.swpc.noaa.gov/products/real-time-solar-wind, and this all the way back to 1998.
The 1-minute data were checked for all solar wind events where either the Bt was larger than 50 nT, Bz lower than -40 nT, OR the solar wind speed ("v") around 1000 km/s or higher. Bt is the total strength of the Interplanetary Magnetic Field (IMF), Bz is the strength of the southward component of this IMF. Both are expressed in nanotesla (nT). The more negative and the longer Bz is negative, the more the geomagnetic field is affected. Note that the ACE sensors measuring particle data such as the solar wind speed, are affected during periods of strong proton events. Hence, for the Bastille day (15 July 2000) and the Halloween events (29 and 30-31 October 2003), the values were used from research papers by Smith et al. (2001 - https://doi.org/10.1023/A:1014265108171 ) and Skoug et al. (2004 - https://doi.org/10.1029/2004JA010494 ). No other efforts were made to calibrate or further polish these data, so the table gives only a general idea of the strongest solar wind events. Over nearly 30 years, there were only 24 events that satisfied any of these criteria, with 17 from solar cycle 23, just 1 from solar cycle 24, and the remaining 6 from the still ongoing solar cycle 25. For each of the 3 parameters Bt, Bz and v, the Top 11 was selected and fit into the table underneath.
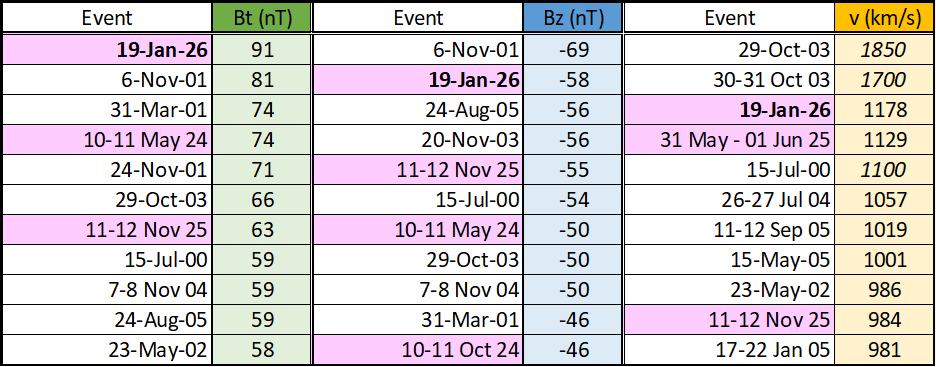
From the table, it can readily be seen that the 19 January 2026 storm was one of the strongest in the 28 years of ACE and DSCOVR measurements. It ranks first in terms of strongest Bt (91 nT), second when it comes to the lowest Bz (-58 nT vs -69 nT), and is only surpassed by the two Halloween storms for the highest solar wind speed (1178 km/s vs 1700 or more km/s). Note that for the latter, a higher speed is possible pending further analysis of the January 2026 solar wind data (data affected by the ongoing proton event - see this newsitem at https://www.stce.be/news/804/welcome.html ). Amazingly, also the storm of 11-12 November 2025 (just a few months ago!) figures in the Top 11 for each of the 3 parameters. Any CME would be proud to see itself just once in this elite table! Truth be told: there have been in the past of course stronger CMEs but for which there were no in-situ solar wind data available, such as the Carrington event (1859) or the August 1972 event. And some strong CMEs such as the July 2012 event (see this newsitem at https://www.stce.be/news/152/welcome.html ) were not directed to Earth. Nonetheless, this does not diminish the awesome performance of the 19 January 2026 storm.
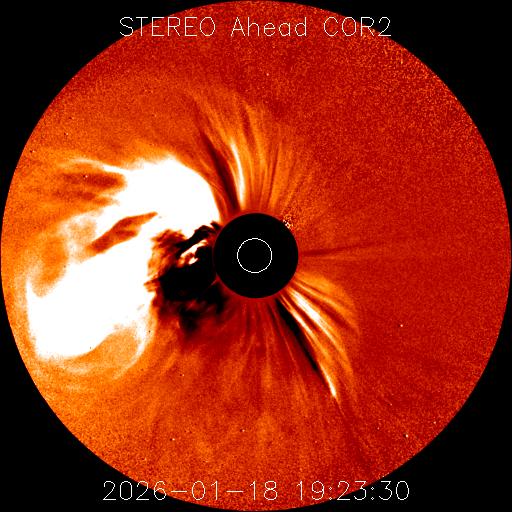
At the movies: Dancing in the rain
On February 25, 2026, a recording of coronal plasma raining down on the Sun was made. The movie was shot at the a distance of 0.3269 AU. The rain starts high, follows a magnetic trajectory to finally reach a bright area below.
Movie: https://www.stce.be/movies/JHV_2026-02-26_11.14.10.mp4
For dramatic purposes, the Sun is tilted such that the spectator has the impression of an horizon. The yellow dot is the middle of the view of an observer on Earth looking in the direction of the Sun.
Technical information: the camera is in fact the space telescope FSI which can make pictures of the Sun in two wavelengths. The red corresponds to 30.4nm and the green to 17.4nm. FSI or Full Sun Imager is part of the instrument EUI onboard of the satellite Solar Orbiter. The distance of Solar Orbiter to the Sun continuously changes as it has a pronounced elliptical orbit with the Sun in 1 of its focal points.
Review of space weather
Solar Active Regions (ARs) and flares
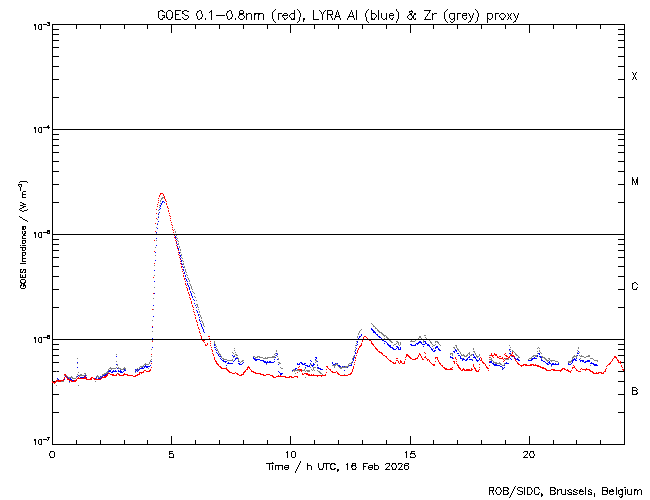
Over the past week, the flaring activity decreased from moderate to low with 16 C-class flares and one M-class flare. The M-flare was reached M2.4 (SIDC Flare 7037, S09 E89) at 04:35 UTC on Feb 16 and came from an unnumbered active region on the E limb. There were six numbered active regions in view from Earth. All six had an alpha or beta magnetic configuration. By the end of the week, all sunspots had vanished.
Coronal mass ejections
A partial halo coronal mass ejection (CME) was observed in SOHO/LASCO-C2 images on 04:24 UTC on Feb 16. It was associated with the M2.4 flare (SIDC Flare 7037, S09 E89, peak: 04:35 UTC) and a prominence eruption on the E limb. From the 2D LASCO images, the speed of the CME was estimated around 1600 km/s and its width around 180 degrees. A glancing blow at Earth could be expected, but with low confidence. It turned out that the CME indeed did not arrive.
A faint and wider CME made its appearance in SOHO/LASCO-C2 images around 14:00 UTC on Feb 16. This CME was associated to a filament eruption in the Southern solar hemisphere (S3-25 W0-17). The filament started to elevate around 12:30 UTC. It had a projected speed of about 457 km/s and a projected width of about 110 deg. With its source region closer to the central meridian, it was expected to impact the Earth on Feb 19. Near Earth, a glancing blow with a weak ICME signature from 22:35 UTC on Feb 20, was seen.
Few wider coronal mass ejections (CMEs) associated to prominence eruptions were observed in the SE and SW limbs, but none of them had Earth-directed components.
Coronal Holes
An elongated, positive polarity, recurrent coronal hole (SIDC Coronal Hole 146) was crossing the central meridian since Feb 13. The high speed stream (HSS) related to this coronal hole enhanced the solar wind near Earth during Feb 15-20.
Another negative polarity, recurrent coronal hole (SIDC Coronal Hole 147) which spanned 10 S to 30 N, crossed the central meridian during Feb 20-23. The HSS related to this coronal hole enhanced the solar wind near Earth from Feb 21.
Proton flux levels
The greater than 10 MeV GOES proton flux was nominal.
Electron fluxes at GEO
The greater than 2 MeV electron flux measured by GOES-18 and GOES-19 satellites, was above the threshold for only a few hours during Feb 16-17. From Feb 18 to Feb 21, it was mostly above the threshold. It was in response to the high speed streams (HSSs) from the recurrent, positive polarity, elongated coronal hole (SIDC Coronal Hole 146) which started to cross the central meridian since Feb 13. The 24-hour electron fluence was at moderate levels between Dec 18-21.
Solar wind near Earth
The solar wind was disturbed until Feb 20 due to the high speed stream (HSS) coming from the elongated, positive polarity, recurrent coronal hole (SIDC Coronal Hole 146) which started to cross the central meridian from Feb 13. The solar wind speed increased up to 722 km/s, the interplanetary magnetic field (IMF) went up to 9 nT, and its Bz component decreased to -7 nT.
A weak glancing blow, associated to the coronal mass ejection of Feb 16, enhanced the solar wind slightly from 22:35 UTC on Feb 20. The solar wind speed increased up to 560 km/s, the IMF went up to 15 nT, and its Bz component decreased to -8 nT.
The glancing blow was immediately followed by the HSS related to the recurrent coronal hole (SIDC Coronal Hole 147, negative polarity), which crossed the central meridian during Feb 20-23.
Due to this HSS, the solar wind speed reached 734 km/s, the IMF 15 nT, and Bz component -10 nT, at the end of the week.
Geomagnetism
On Feb 16, 18:00-21:00 UTC, a local moderate geomagnetic storm (K_BEL=5) was ongoing locally and a minor geomagnetic storm at the planetary level (NOAA Kp=6). It was due to the impact of the high speed stream (HSS) from the coronal hole (SIDC Coronal Hole 146) which started to cross the central meridian from Feb 13.
Active geomagnetic conditions at the planetary level set in from Feb 20, 21:00 UTC to Feb 21, 03:00 UTC. Over Belgium, a minor storm was ongoing. This was possibly due to the weak glancing blow associated to the Feb 16 CME.
At the end of the week, geomagnetic conditions reached a minor storm level (NOAA Kp and K_BEL 5), both globally and locally over Belgium. This was due to the early arrival of the high speed stream (HSS) associated with the coronal hole (SIDC Coronal Hole 147) which crossed the central meridian during Feb 20-23.
Noticeable Solar Events
| DAY | BEGIN | MAX | END | LOC | XRAY | OP | 10CM | TYPE | Cat | NOAA |
| 16 | 0403 | 0435 | 0500 | M2.4 |
| LOC: approximate heliographic location | TYPE: radio burst type |
| XRAY: X-ray flare class | Cat: Catania sunspot group number |
| OP: optical flare class | NOAA: NOAA active region number |
| 10CM: peak 10 cm radio flux |
International Sunspot Number by SILSO

The daily Estimated International Sunspot Number (EISN, red curve with shaded error) derived by a simplified method from real-time data from the worldwide SILSO network. It extends the official Sunspot Number from the full processing of the preceding month (green line), a few days more than one solar rotation. The horizontal blue line shows the current monthly average. The yellow dots give the number of stations that provided valid data. Valid data are used to calculate the EISN. The triangle gives the number of stations providing data. When a triangle and a yellow dot coincide, it means that all the data is used to calculate the EISN of that day.
PROBA2 Observations (16 Feb 2026 - 22 Feb 2026)
Solar Activity
Solar flare activity fluctuated from very low to moderate during the week.
In order to view the activity of this week in more detail, we suggest to go to the following website from which all the daily (normal and difference) movies can be accessed: https://proba2.oma.be/ssa
This page also lists the recorded flaring events.
A weekly overview movie (SWAP week 830) can be found here: https://proba2.sidc.be/swap/data/mpg/movies/weekly_movies/weekly_movie_2026_02_16.mp4.
Details about some of this week's events can be found further below.
If any of the linked movies are unavailable they can be found in the P2SC movie repository here: https://proba2.oma.be/swap/data/mpg/movies/.
Monday February 16
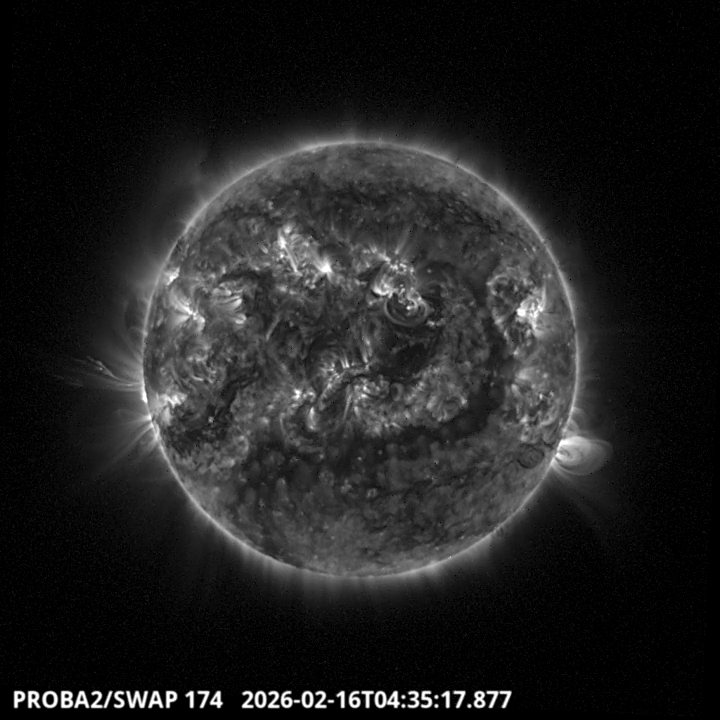
The largest and only M-flare of this week was an M2.4, and it was observed by LYRA (top panel) and SWAP (bottom panel). The flare peaked on 2026-Feb-16 at 04:35 UT and occurred just behind the eastern limb of the Sun.
Find a SWAP movie of the event here: https://proba2.sidc.be/swap/movies/20260216_swap_movie.mp4.
Tuesday February 17
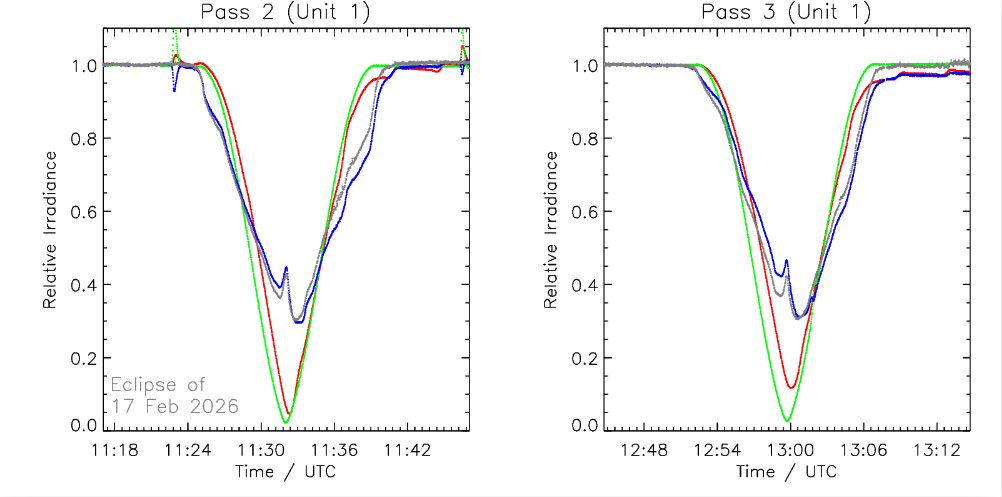
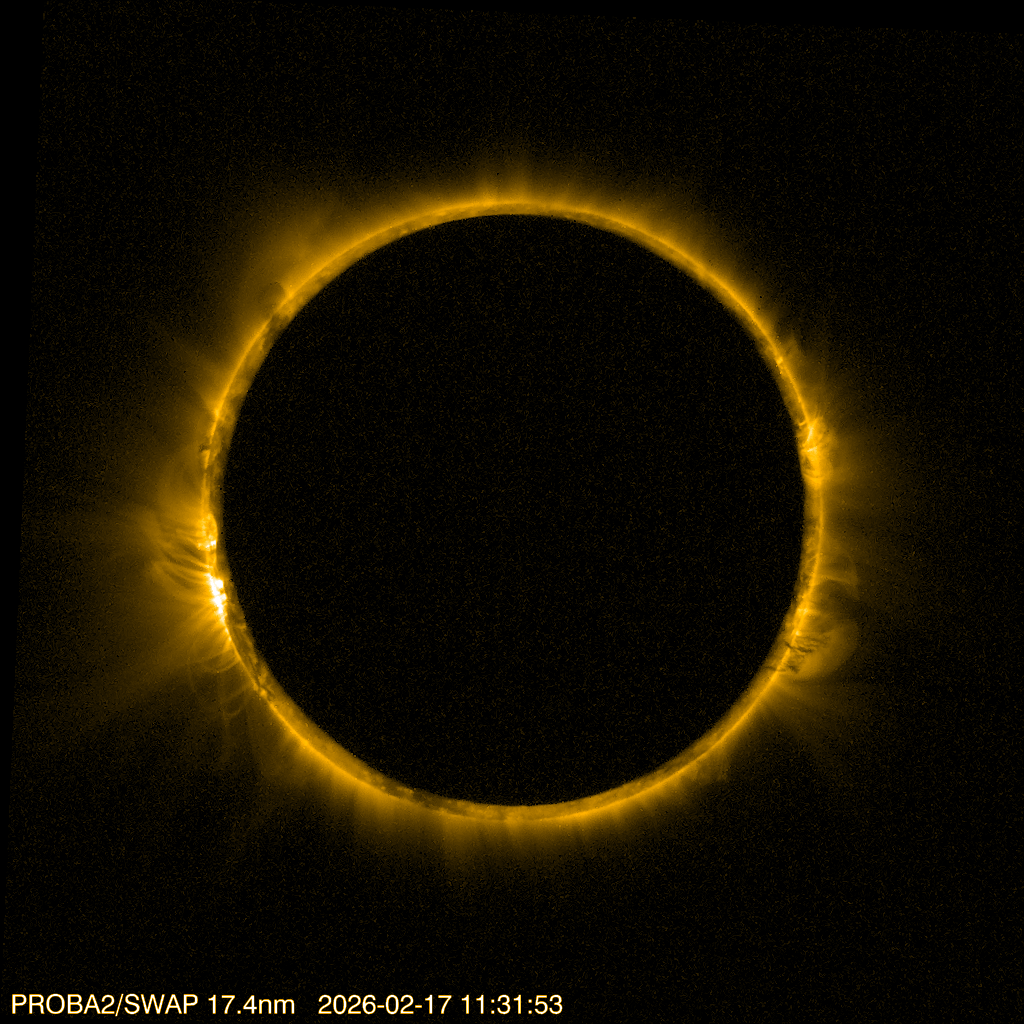
The annular solar eclipse of February 17 was observed and recorded by LYRA (top) and SWAP (bottom). The irradiance plots above, corresponding to the two primary transits (out of a total of 4 passes) of PROBA2 through the eclipse zone, illustrate the gradual reduction in irradiance across the four channels of LYRA's backup unit as the Moon passed in front of the Sun. The SWAP image captures the moment when the eclipse reached its maximum phase. More detailed explanations can be found on the PROBA2 website: https://proba2.sidc.be/Eclipse17February2026.
Find a SWAP movie of the event here: https://proba2.sidc.be/Events/2026-Feb-17-SolarEclipse/movies/swap_eclipse_2026_02_17_logos_lossless.mp4.
Geomagnetic Observations in Belgium

Local K-type magnetic activity index for Belgium based on data from Dourbes (DOU) and Manhay (MAB). Comparing the data from both measurement stations allows to reliably remove outliers from the magnetic data. At the same time the operational service availability is improved: whenever data from one observatory is not available, the single-station index obtained from the other can be used as a fallback system.
Both the two-station index and the single station indices are available here: http://ionosphere.meteo.be/geomagnetism/K_BEL/
The SIDC Space Weather Briefing
The forecaster on duty presented the SIDC briefing that gives an overview of space weather from Feb 16 to 22.
The pdf of the presentation: https://www.stce.be/briefings/20260223_SWbriefing.pdf
Review of Ionospheric Activity


VTEC time series at 3 locations in Europe from 16 Feb 2026 till 22 Feb 2026
The top figure shows the time evolution of the Vertical Total Electron Content (VTEC) (in red) during the last week at three locations:
a) in the northern part of Europe(N 61deg E 5deg)
b) above Brussels(N 50.5deg, E 4.5 deg)
c) in the southern part of Europe(N 36 deg, E 5deg)
This top figure also shows (in grey) the normal ionospheric behaviour expected based on the median VTEC from the 15 previous days.
The time series below shows the VTEC difference (in green) and relative difference (in blue) with respect to the median of the last 15 days in the North, Mid (above Brussels) and South of Europe. It thus illustrates the VTEC deviation from normal quiet behaviour.
The VTEC is expressed in TECu (with TECu=10^16 electrons per square meter) and is directly related to the signal propagation delay due to the ionosphere (in figure: delay on GPS L1 frequency).
The Sun's radiation ionizes the Earth's upper atmosphere, the ionosphere, located from about 60km to 1000km above the Earth's surface.The ionization process in the ionosphere produces ions and free electrons. These electrons perturb the propagation of the GNSS (Global Navigation Satellite System) signals by inducing a so-called ionospheric delay.
See http://stce.be/newsletter/GNSS_final.pdf for some more explanations; for more information, see https://gnss.be/SpaceWeather
STCE training courses, lectures and workshops
Courses, seminars, presentations and events with the Sun-Space-Earth system and Space Weather as the main theme. We provide occasions to get submerged in our world through educational, informative and instructive activities.
* Feb 28, 2026, In het oog van de ruimtestorm, Workshop Talim, Beringen, Belgium
* Mar 16-18, 2026, STCE course: Role of the ionosphere and space weather in military communications, Brussels, Belgium - full
* Apr 20-21, 2026, STCE cursus: inleiding tot het ruimteweer, voor leden van volkssterrenwachten, Brussels, Belgium - register: https://events.spacepole.be/event/260/
* Mar 23, 2026, STCE lecture: From physics to forecasting, Space Weather course by ESA Academy, Redu, Belgium
* Mar 25, 2026, The Belgian Space Weather centre, Space Weather course by ESA Academy, Brussels, Belgium
* Jun 15-17, 2026, STCE Space Weather Introductory Course, Brussels, Belgium - register: https://events.spacepole.be/event/256/
* Oct 12-14, 2026, STCE Space Weather Introductory Course, Brussels, Belgium - register: https://events.spacepole.be/event/257/
* Nov 23-25, 2026, STCE course: Role of the ionosphere and space weather in military communications, Brussels, Belgium - register: https://events.spacepole.be/event/259/
* Dec 7-9, 2026, STCE Space Weather Introductory Course for Aviation, Brussels, Belgium - register: https://events.spacepole.be/event/262/
To register for a course and check the seminar details, navigate to the STCE Space Weather Education Center: https://www.stce.be/SWEC
If you want your event in the STCE newsletter, contact us: stce_coordination at stce.be
Website: https://www.stce.be/SWEC