- Table of Content
- 1.Eye pleaser
- 2.Review of sola...
- 3.International ...
- 4.PROBA2 Observa...
- 5.Noticeable Sol...
- 6.Geomagnetic Ob...
- 7.Review of Iono...
- 8.The SIDC Space...
- 9.STCE Activitie...
2. Review of solar and geomagnetic activity
3. International Sunspot Number by SILSO
4. PROBA2 Observations
5. Noticeable Solar Events
6. Geomagnetic Observations in Belgium
7. Review of Ionospheric Activity
8. The SIDC Space Weather Briefing
9. STCE Activities, courses and seminars
Eye pleaser
The strongest flaring event last week was an M5.4 peaking at 17:06UTC on 11 April. Its source was uncertain, but was possibly from one of the active regions beyond the southeast limb based on observed coronal loops and associated coronal mass ejection (CME). A fast but faint CME was indeed observed in the southeast direction in SOHO's LASCO/C3 imagery (http://sohowww.nascom.nasa.gov/data/realtime-images.html ) starting already at 17:31UTC. The annotated graph underneath shows the evolution of the soft x-rays flux as observed by GOES (https://www.swpc.noaa.gov/products/goes-x-ray-flux ) with the M5 flare indicated.
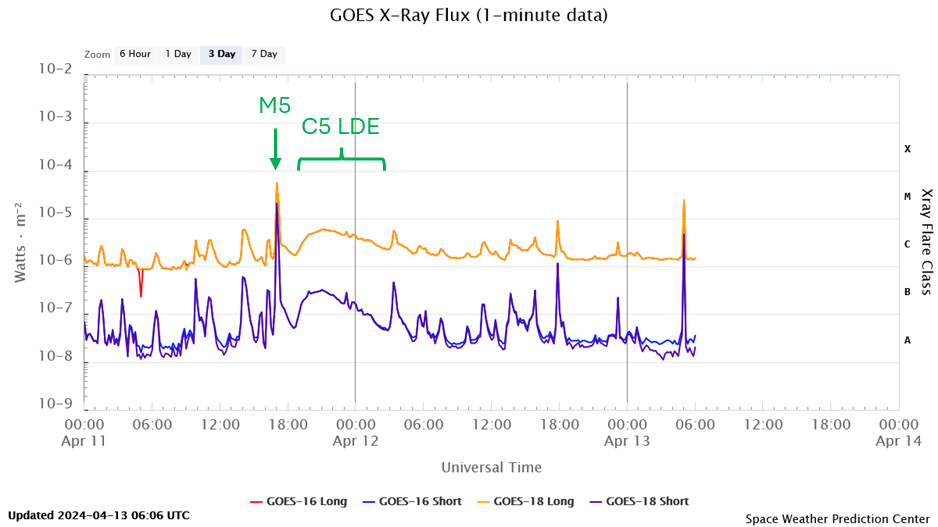
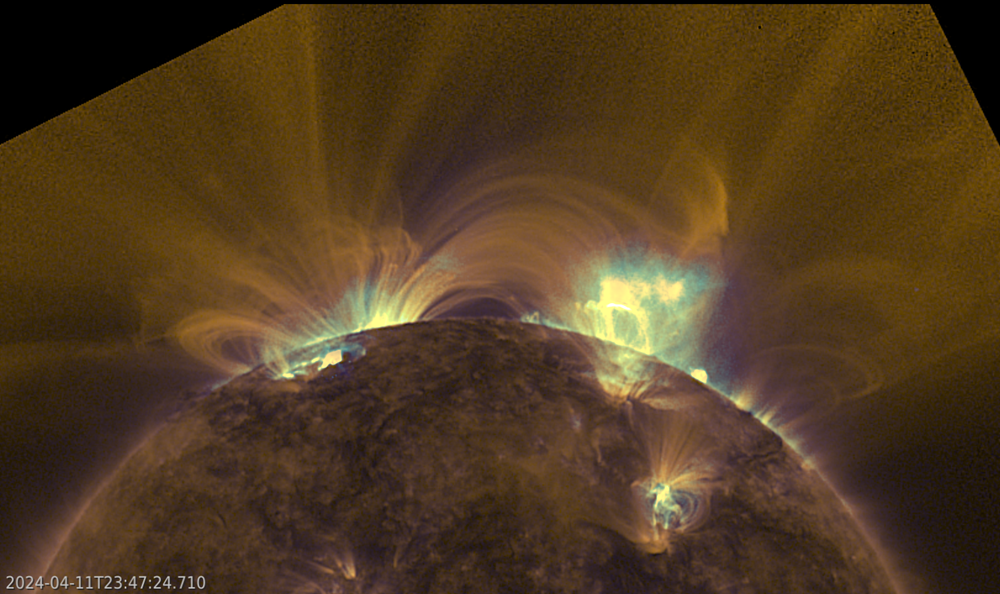
It was followed by a slow but spectacular long duration event (LDE) just beyond the Sun's northeast limb. The eruption got no flare designation, but peaked at 21:00UTC reaching a maximum intensity of C5.9. The event lasted for a whopping 6 hours from 18:30UTC until 00:30UTC on 12 April. At that time impressive post-eruption coronal loops could be seen towering above the solar limb. The compilation underneath combines extreme ultraviolet (EUV) images from GOES/SUVI 094 (https://www.swpc.noaa.gov/products/goes-solar-ultraviolet-imager-suvi ), showing the Sun at multi-million degrees, with those from GOES/SUVI 171 which display the Sun at a temperature of 700.000 degrees. The colors used are respectively purple/blue and yellow. The images are rotated by 90 degrees such that east is on top and north to the right. This provides a better view on the entire east limb, with a lot of dynamics going on in the Sun's outer atmosphere (the "corona"), as shown in SUVI's wide field-of-view. Note there is still a trans-equatorial connection between active regions in the northern and southern hemisphere, as can be gauged from the bridging coronal loops in the background. This was also the case during the previous solar rotation, between NOAA 3614 and 3615, as mentioned in this newsflash (https://www.stce.be/news/692/welcome.html ) and in the online version of this newsitem (https://www.stce.be/news/695/welcome.html ).
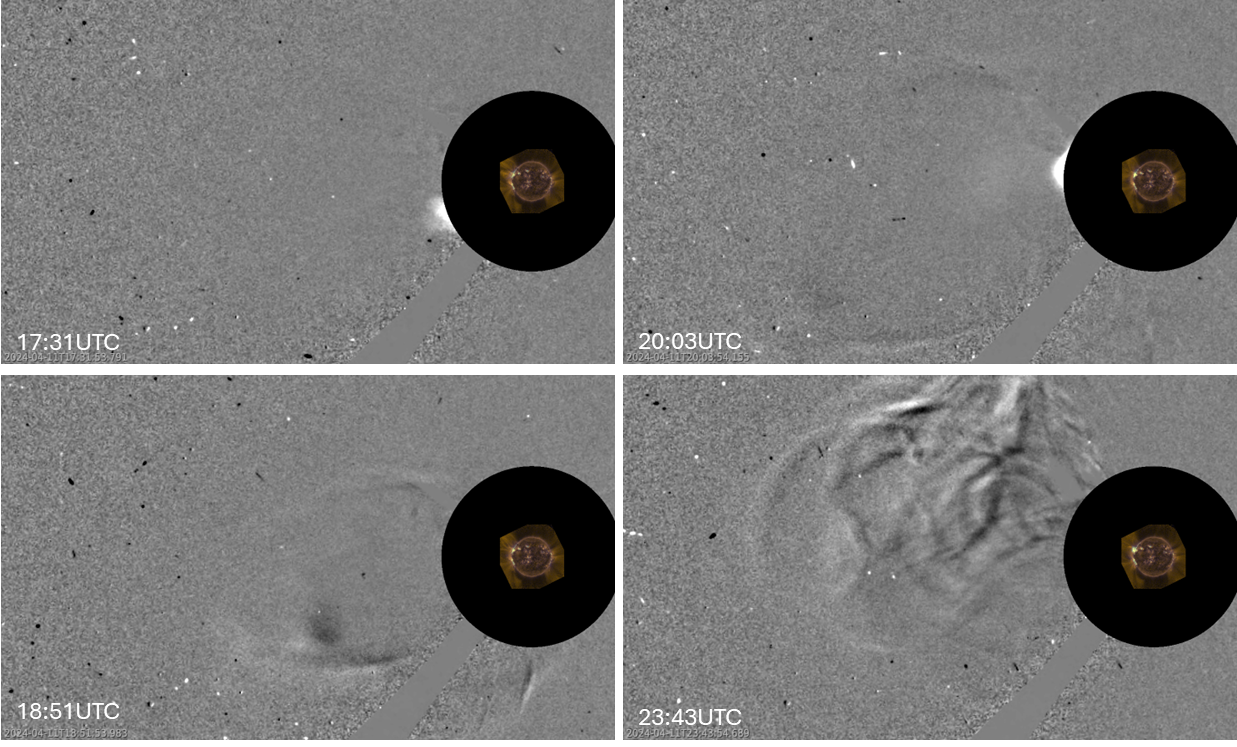
A potent CME was observed in LASCO/C3 coronagraphic imagery starting at 20:03UTC. When it became visible, the faint outlines of the previous CME (related to the M5 flare) were still distinguishable in the difference images (i.e. one image subtracted from the next). Its plane-of-the-sky speed was substantially slower than that of the M5-related CME, 380 km/s versus 1300 km/s (CACTus - https://www.sidc.be/cactus/ ). As the CMEs were both related to farside eruptions, they had no earth-directed components. In the imagery underneath, east is to the left and north is up.
Review of solar and geomagnetic activity
WEEK 1215 from 2024 Apr 08
Solar Active Regions and flares
Solar flaring activity was low between April 8th-11th, with multiple C-class flares. Solar flaring activity reached moderate levels towards the end of the week, with three M-class flares. The strongest flare was an M5.4 from beyond the east solar limb, peaking at 17:06 UTC on April 11th. There were a total of 11 numbered active regions (ARs) observed on the visible solar disk over the week. The most complex one was NOAA AR 3634, which evolved from beta to beta-gamma and later back to beta.
Coronal mass ejections
A faint Coronal Mass Ejection (CME) towards the south-east was observed in SOHO/LASCO-C2 around 06:30 UTC on April 11th, likely associated with a filament eruption near the central meridian.
A faint partial halo coronal mass ejection (CME) was observed in SOHO/LASCO-C2 and SOHO/LASCO-C3 starting from 02:30 UTC on April 12th. It was probably associated with the filament eruption observed in SDO/AIA 304 data at 01:10 UTC on April 12th.
A faint Coronal Mass Ejection (CME) towards the north was observed in SOHO/LASCO-C2 around 18:30 UTC on April 13th. It was probably associated with a C5.5 flare from NOAA AR 3634.
A CME at the north-west limb was observed in SOHO/LASCO-C2 and SOHO/LASCO-C3 starting from 03:50 UTC on April 14th. It is possibly related to a prominence eruption on the west limb.
Coronal Holes
Two small coronal holes have crossed the central meridian during the past week. The first one was a negative polarity, equatorial, southern coronal hole that crossed the central meridian on April 9th. The second one was a positive polarity, mid-latitude, northern coronal hole that crossed the central meridian on April 10th.
Proton flux levels
The greater than 10 MeV GOES proton flux was below the 10 pfu threshold over the past week.
Electron fluxes at GEO
Over the past week, the greater than 2 MeV electron flux remained below the 1000 pfu threshold as measured by GOES 16. The greater than 2 MeV electron flux measured by the GOES-18 satellite reached the threshold between 17:50 UTC and 23:30 UTC on April 7th.
The 24-hour electron fluence was at nominal levels throughout the week.
Solar wind
Over the past week, slow solar wind conditions were observed with speed values between 300 km/s and 510 km/s. The interplanetary magnetic field varied between 5 nT and 8 nT. The Bz component varied between -7 nT and 7 nT. The interplanetary magnetic field phi angle was predominantly in the positive sector.
Geomagnetism
Geomagnetic conditions locally and globally were at quiet to unsettled levels (NOAA Kp and K BEL from 0 to 3).
International Sunspot Number by SILSO
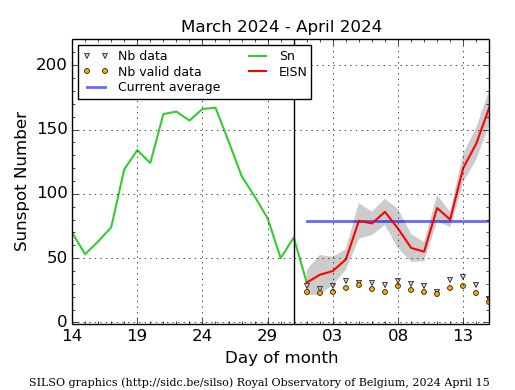
The daily Estimated International Sunspot Number (EISN, red curve with shaded error) derived by a simplified method from real-time data from the worldwide SILSO network. It extends the official Sunspot Number from the full processing of the preceding month (green line), a few days more than one solar rotation. The horizontal blue line shows the current monthly average. The yellow dots give the number of stations that provided valid data. Valid data are used to calculate the EISN. The triangle gives the number of stations providing data. When a triangle and a yellow dot coincide, it means that all the data is used to calculate the EISN of that day.
PROBA2 Observations
Solar Activity
Solar flare activity fluctuated from low to moderate during the week.
In order to view the activity of this week in more detail, we suggest to go to the following website from which all the daily (normal and difference) movies can be accessed: https://proba2.oma.be/ssa
This page also lists the recorded flaring events.
A weekly overview movie can be found here (SWAP week 733). https://proba2.sidc.be/swap/data/mpg/movies/weekly_movies/weekly_movie_2024_04_08.mp4
Details about some of this week's events can be found further below.
If any of the linked movies are unavailable they can be found in the P2SC movie repository here: https://proba2.sidc.be/swap/data/mpg/movies/
Monday Apr 08
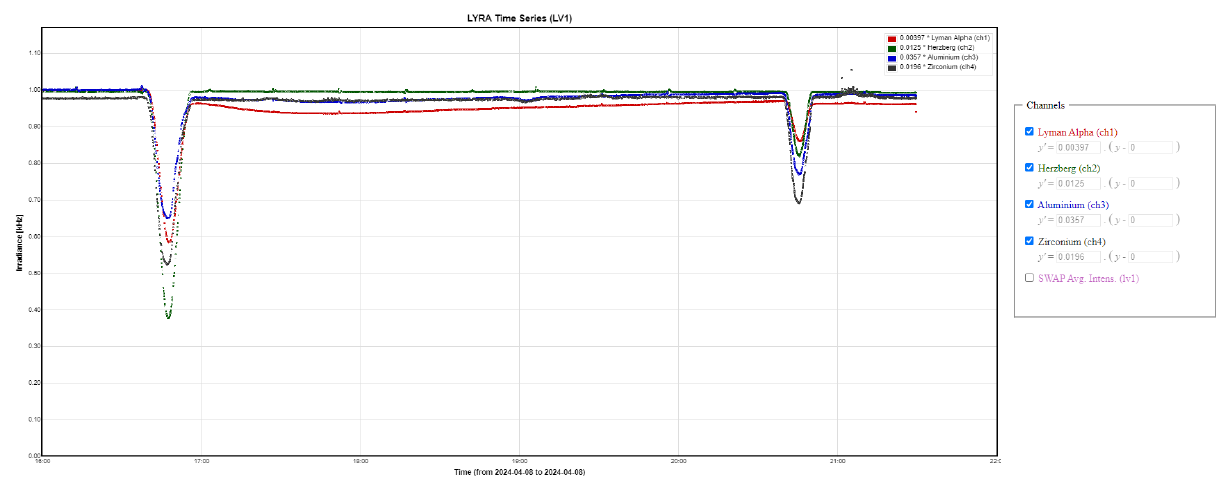
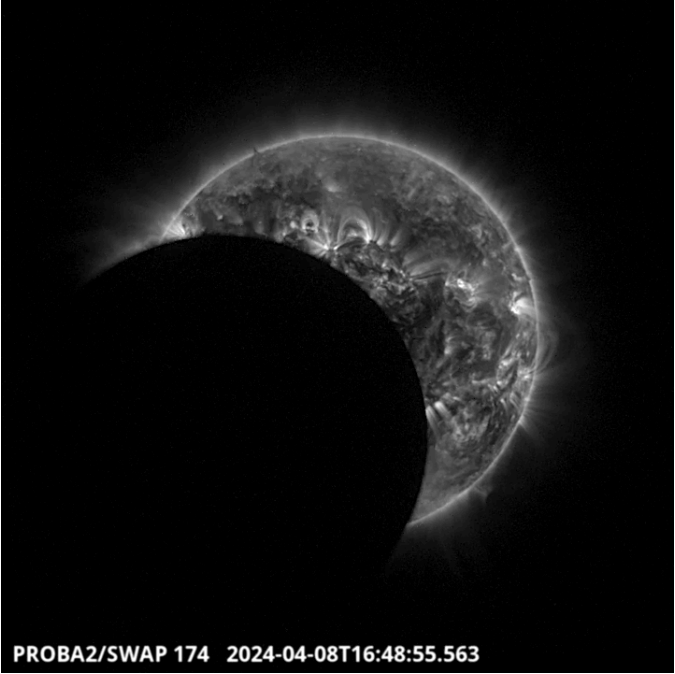
On April 8, there was a total eclipse visible from a big part of the American continent. From
PROBA2, the eclipse was only partial. However, the spacecraft was crossing twice the eclipse
zone: around 16:50 and 20:50 UT. LYRA curves show the irradiance drop caused by the
occultation of the Sun by the Moon in each of its channels. Find a SWAP movie of the event here: https://proba2.sidc.be/Events/2024-Apr-08-SolarEclipse/movies/swap_eclipse_2024_04_08_logos_lossless.mp4
Thursday Apr 11
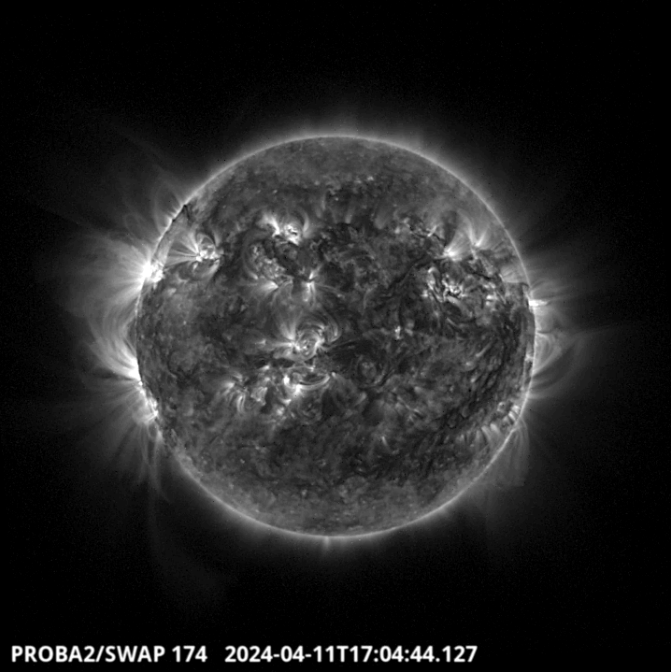
The strongest flare of this week is a M5.4. The source of the flare was just behind the Sun's
northeastern limb. Find a SWAP movie of the event here: https://proba2.sidc.be/swap/movies/20240411_swap_movie.mp4
Noticeable Solar Events
| DAY | BEGIN | MAX | END | LOC | XRAY | OP | 10CM | TYPE | Cat | NOAA |
| 11 | 1652 | 1706 | 1711 | M5.4 | III/2IV/1 | |||||
| 13 | 0458 | 0502 | 0506 | S10E80 | M2.4 | SF | III/2 | 3637 | ||
| 14 | 0224 | 0232 | 0236 | S11E67 | M4.3 | 1F | III/3 | 3637 |
| LOC: approximate heliographic location | TYPE: radio burst type |
| XRAY: X-ray flare class | Cat: Catania sunspot group number |
| OP: optical flare class | NOAA: NOAA active region number |
| 10CM: peak 10 cm radio flux |
Geomagnetic Observations in Belgium
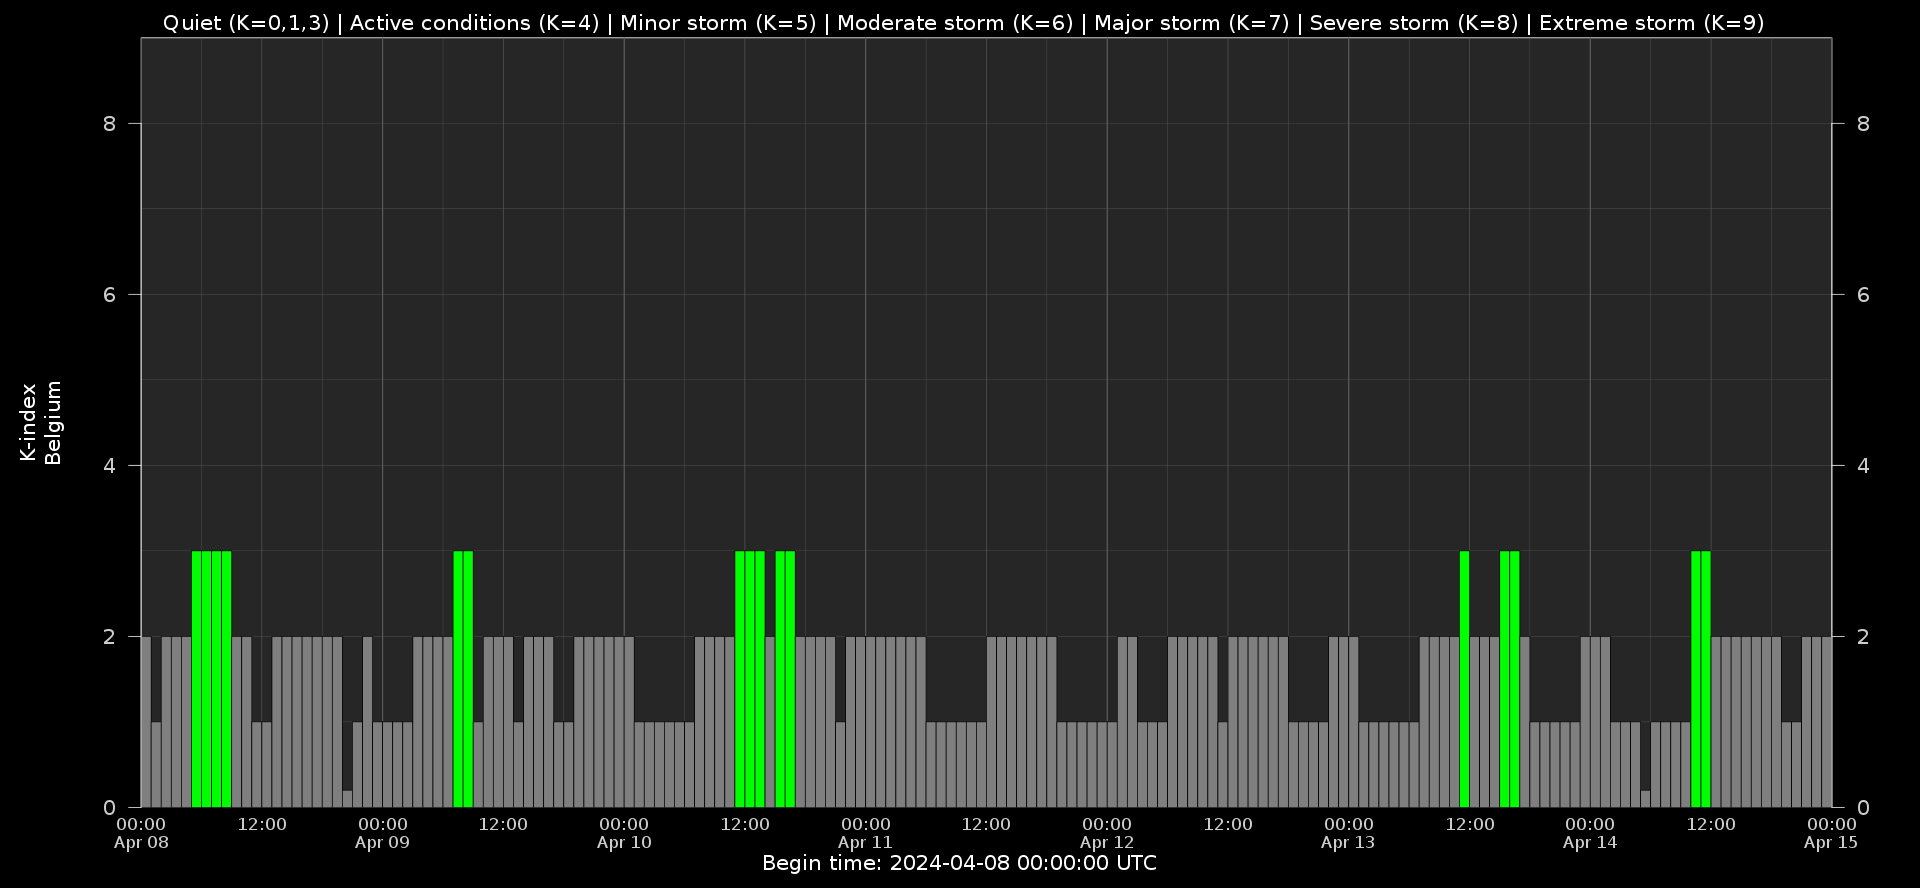
Local K-type magnetic activity index for Belgium based on data from Dourbes (DOU) and Manhay (MAB). Comparing the data from both measurement stations allows to reliably remove outliers from the magnetic data. At the same time the operational service availability is improved: whenever data from one observatory is not available, the single-station index obtained from the other can be used as a fallback system.
Both the two-station index and the single station indices are available here: http://ionosphere.meteo.be/geomagnetism/K_BEL/
Review of Ionospheric Activity
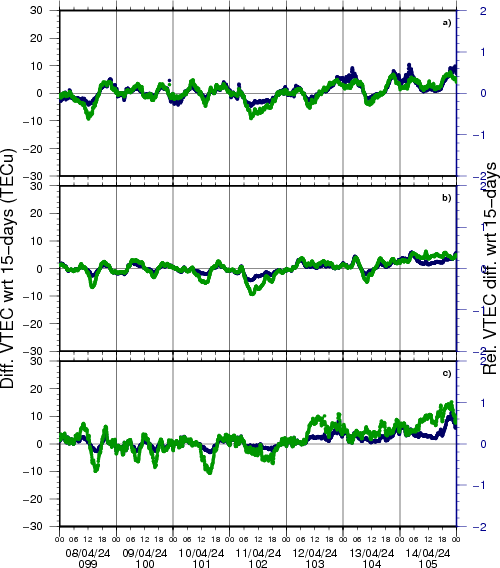
NEW! The time series below illustrates (in green) the VTEC deviation from normal quiet behaviour.
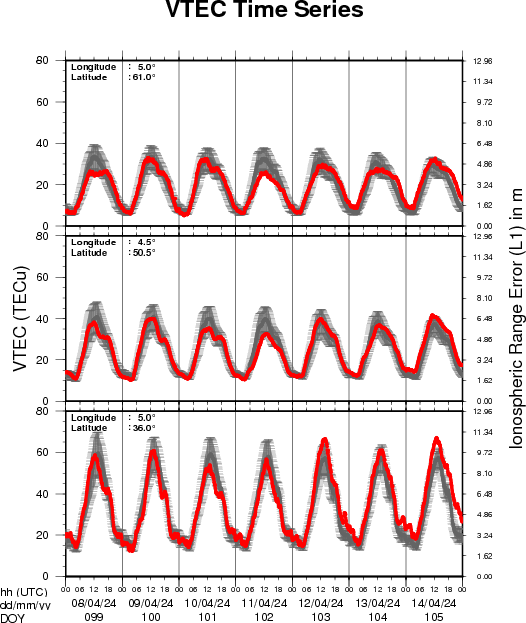
VTEC time series at 3 locations in Europe from 8 Apr 2024 till 14 Apr 2024
The top figure shows the time evolution of the Vertical Total Electron Content (VTEC) (in red) during the last week at three locations:
a) in the northern part of Europe(N 61deg E 5deg)
b) above Brussels(N 50.5deg, E 4.5 deg)
c) in the southern part of Europe(N 36 deg, E 5deg)
This top figure also shows (in grey) the normal ionospheric behaviour expected based on the median VTEC from the 15 previous days.
The time series below shows the VTEC difference (in green) and relative difference (in blue) with respect to the median of the last 15 days in the North, Mid (above Brussels) and South of Europe. It thus illustrates the VTEC deviation from normal quiet behaviour.
The VTEC is expressed in TECu (with TECu=10^16 electrons per square meter) and is directly related to the signal propagation delay due to the ionosphere (in figure: delay on GPS L1 frequency).
The Sun's radiation ionizes the Earth's upper atmosphere, the ionosphere, located from about 60km to 1000km above the Earth's surface.The ionization process in the ionosphere produces ions and free electrons. These electrons perturb the propagation of the GNSS (Global Navigation Satellite System) signals by inducing a so-called ionospheric delay.
See http://stce.be/newsletter/GNSS_final.pdf for some more explanations; for more information, see https://gnss.be/SpaceWeather
The SIDC Space Weather Briefing
The forecaster on duty presented the SIDC briefing that gives an overview of space weather from 8 to 14 April.
The pdf of the presentation can be found here: https://www.stce.be/briefings/20240415_SWbriefing.pdf

STCE Activities, courses and seminars
Courses and presentations with the Sun-Space-Earth system and Space Weather as the main theme. We provide occasions to get submerged in our world through educational, informative and instructive activities.
* April 22-24, STCE Space Weather Introductory Course, Brussels, Belgium - Registrations are open
* April 26, Public presentation Proba-3: a solar eclipse maker, MIRA, Grimbergen, Belgium
* April 30, Solar physics and Space Weather: Proba-2 and Proba-3, online course - Registrations are open
* May 3, STCE seminar, An Echo of the Sun
* May 6, An Echo of the Sun, PhD defense Pepa Ivanova, Brussels, Belgium
* May 13, lecture by the STCE, From physics to forecasting, ESA Space Weather Training Course 2024, Euro Space Center, Redu, Belgium
* May 14, STCE Seminar, Segmentation, grouping and classification of sunspots from ground-based observations using deep learning methods
* May 13 - 17, lectures by the STCE, solar and heliospheric weather; magnetosphere, ionosphere, aviation, and ground based impact, Course Operational Space Weather Fundamentals, L'Aquila, Italy
* May 18, Public presentation, The PROBA-3 Mission: Artificial Total Solar Eclipse in Space, FotonFest, Urania, Hove, Belgium
* May 28, Solar physics and Space Weather: Solar Orbiter Spacecraft, online course - Registrations are open
* June 4, STCE seminar, title TBC
* June 9, Public presentation Total Eclipse of the Sun, Helios, Averbode, Belgium
* June 13, STCE seminar, Solar Prominence Eruptions: Insights from UV Imaging with EUI/FSI
* June 25, Solar physics and Space Weather: predictions and services, online course - Registrations are open
* June 27, STCE annual meeting, Brussels, Belgium
* June 28, public presentation Help! Het stormt in de ruimte!?, Wetenschappelijke middagen, Brussels, Belgium
To register for a course or lecture, check the page of the STCE Space Weather Education Center: https://www.stce.be/SWEC
If you want your event in the STCE newsletter, contact us: stce_coordination at stce.be