
The Solar-Terrestrial Centre of Excellence (STCE) is a collaborative network of the Belgian Institute for Space Aeronomy, the Royal Observatory of Belgium and the Royal Meteorological Institute of Belgium.
|
Published by the STCE - this issue : 18 Apr 2013. The Solar-Terrestrial Centre of Excellence (STCE) is a collaborative network of the Belgian Institute for Space Aeronomy, the Royal Observatory of Belgium and the Royal Meteorological Institute of Belgium. |
| Archive of the newsletters | Subscribe to this newsletter by mail |
No doubt about it: The M6 flare in sunspot group NOAA 1719 was the highlight of last week's space weather activity.
A movie (http://www.youtube.com/watch?v=ZzZaI2EkScs ) was created showing the various aspects of this flare and its impact on Earth. Some additional details can be found underneath.
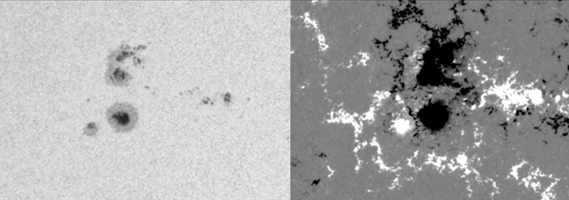
NOAA 1719 was a relatively simple group, but possessed some spots of opposite magnetic polarity close to each other. The flare took place along the line separating these fields of opposite magnetic polarity. The M6.5 flare peaked at 7:16UT (11 April), and lasted for 34 minutes. It is noteworthy that NOAA 1719 was also the source of an M2 flare about a week earlier, while it was still near the east limb.
The next part of the movie shows the flare in successively higher and hotter levels of the Sun's atmosphere: From the relatively cool chromospheric layer via the transition zone into the million degrees hot corona. The outlook changes dramatically, with post-flare coronal loops becoming better visible as temperatures increase. In the cool chromosphere, the flare was very bright and also big, being about 6 times as large as the Earth's surface area.
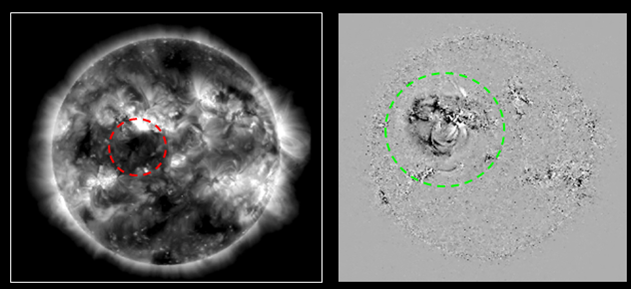
The SDO/AIA 193 and the PROBA2/SWAP 174 images show quite well the EUV dimmings and the EIT wave associated with the flare. EUV dimmings are also called transient coronal holes, as they indicate places where material temporarily punched a hole through the corona while being ejected from the Sun. The EIT wave is best visible in difference-images (one image being subtracted from the previous), propagating at a speed of several hundred kilometers per second in the plane-of-sky.

The SDO/AIA combo movies provide a good zoom on the blast area showing the post-flare coronal loops and the interaction with the surroundings particularly well. The continuous series of coronal loops is called an arcade.
Already 1.5 hours later, energetic protons from this event arrived at Earth. Both the x-ray radiation as the proton event degraded the HF communication on Earth moderately, resp. over Asia (x-ray) and over the polar regions (protons).
The Humain solar radio telescope very nicely captured the radio bursts associated with this event, as material traveled through the corona. The Type 2-burst in particular was distinct, and indicated the ejection of plasma.
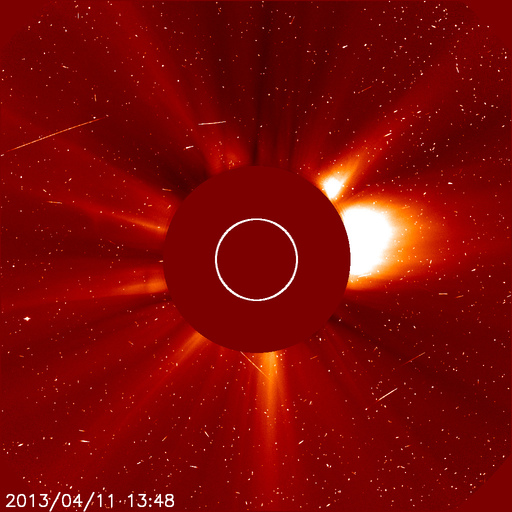
Images made by the coronagraphs of the SOHO, STEREO-A and -B spacecraft confirmed there was a coronal mass ejection. The CME was a full halo in both the SOHO and STEREO-A spacecraft. This meant the plasma cloud was heading for Earth. It had also a very strong asymmetry of the material distribution towards the east. It is also interesting to note that the speed of the disturbance gradually decelerated from around 1160 km/s to 800 km/s as the CME progressed through the C2 and C3 fields of view of the SOHO/Lasco coronagraph.

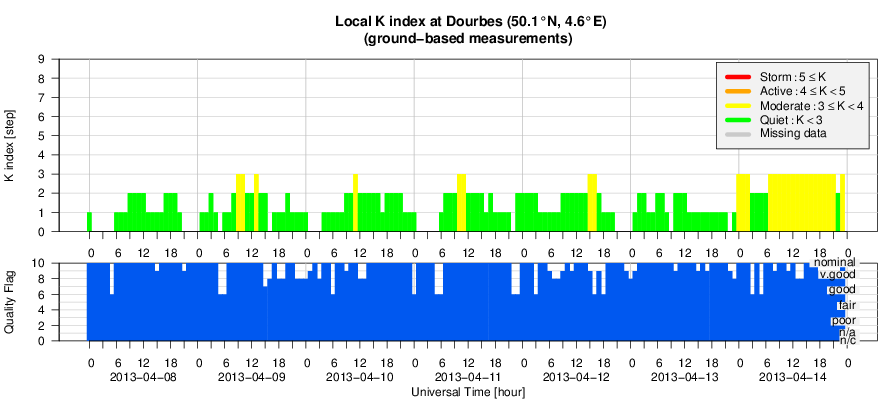
The CME arrived late on 13 April. Having a predominantly north oriented and relatively weak magnetic field, it resulted in only unsettled geomagnetic conditions. Polar lights were well visible only from Alaska and Scandinavia.
Credits – Images and data were taken from SDO (http://sdo.gsfc.nasa.gov/data/ ), SOHO (http://sohowww.nascom.nasa.gov/ ), PROBA2 (http://proba2.oma.be/ ), STEREO (http://stereo.gsfc.nasa.gov/ ), GONG/H-alpha Network (http://halpha.nso.edu/ ), Humain Solar Radio telescope (http://sidc.oma.be/humain/realtime.php ), ACE (http://www.swpc.noaa.gov/ace/ ), NOAA/SWPC (http://www.swpc.noaa.gov/today.html ) and SIDC (http://www.sidc.oma.be/ ), and processed with JHelioviewer (http://jhelioviewer.org/ ).
On Friday June 7, the STCE has its annual yearly meeting. In preparation, the STCE members hold workshops. Here, we give an avant-premiere overview of the up-coming meetings:
* GNSS, May 14 - contact Stan Stankov
* EPN Local Analysis Centres Workshop, May 15 and 16 - contact Carine Bruyninx,
* Alfven waves and Turbulence, May 30 - contact Yuriy Voitenko and Andre Zhukov,
* Automatic detection of events in radio data, May 31 - contact Christophe Marqué and Hervé Lamy.
Two meetings, PROBA2 - intercalibrattion and degradation of EUV instruments and Water Vapour, Meteorology and Climate happened already. A wrap up will be giving during the annual meeting on June 7.
More information will follow. Keep tuned!
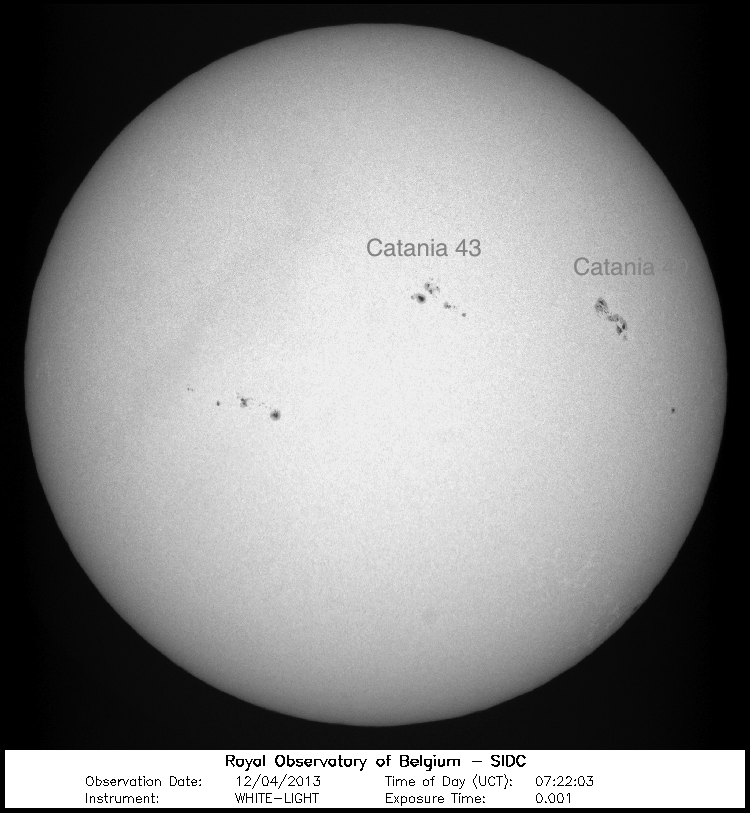
In the beginning of the week, the solar flaring activity was at a low C-level. Starting from late April 10, the flaring activity became dominated by two large sunspot groups, Catania numbers 40 and 43 (NOAA ARs 1718 and 1719 respectively). They produced numerous C-class flares and two M-class flares. The two sunspot groups are indicated in the picture below which is taken by the USET white light telescope at the Royal Observatory of Belgium - check http://sidc.be/uset/.
The M6.5 flare peaking at 07:16 UT was detected on April 11 in the Catania sunspot group 43 (NOAA AR 1719), accompanied by a metric type II burst observed by Humain starting from around 07:02 UT. According to the SDO/AIA data, this flare was also accompanied by coronal dimmings, an EIT wave, and a post-eruption arcade, indicating the eruption of a CME. A full halo CME was first detected in the SOHO/LASCO C2 field of view at 07:24 UT. The CME plane-of-the-sky linear speed was around 930 km/s (the second-order fit showed deceleration from around 1160 km/s to 800 km/s as the CME progressed through the C2 and C3 fields of
view). The corresponding interplanetary disturbance arrived at the Earth late on April 13 (see the section Review of Geomagnetic Activity).
M3.3 flare was detected on April 12 peaking at 20:38 UT in the Catania sunspot group 40 (NOAA AR 1718). It was not associated with a CME. After that only weak C-class flares occurred.
The proton flux at energies above 10 MeV crossed the SEP event threshold around 10:00 UT on April 11, in association with the full halo CME. The proton flux peaked in the afternoon of April 11, and then decreased and went below the SEP event threshold late on April 12, although staying above the background level until the end of the week. No significant increase of the proton flux at energies above 10 MeV was detected in association with the interplanetary shock wave arrival on April 13 (see the section Review of Geomagnetic Activity).
The coronograph LASCO onboard of SOHO was affected by the proton storm. The energetic particles hit the telescope and are visible as white dots. For comparison, we added a similar picture taken before the SEP event.
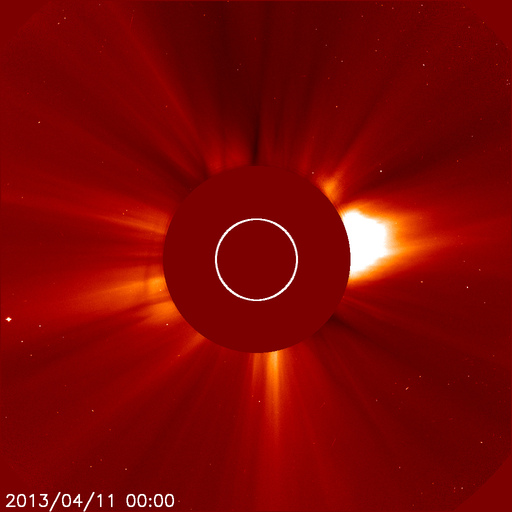
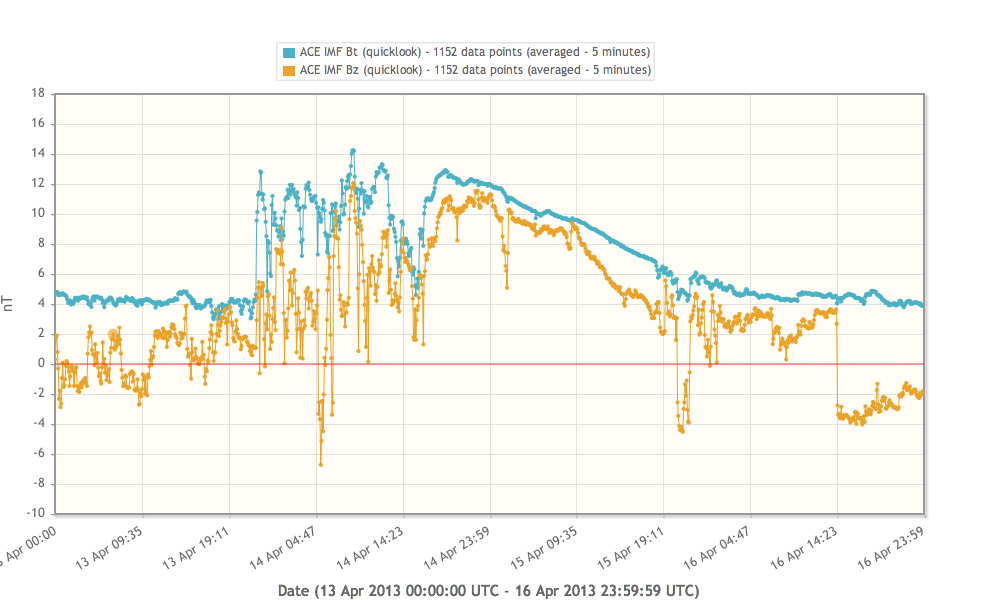
During the most of the week the Earth was situated inside a slow to intermediate-speed solar wind flow and the geomagnetic conditions were quiet. An interplanetary shock wave was detected by SOHO/CELIAS at 22:24 UT on April 13. In the graph below, you see the sudden increase of the total interplanetary magnetic field (IMF) and the solar wind speed, measured in situ by ACE.


| DAY | BEGIN | MAX | END | LOC | XRAY | OP | 10CM | TYPE | Cat | NOAA | NOTE |
| 11 | 0655 | 0716 | 0729 | N09E12 | M6.5 | 3B | 470 | VI/1 IV/3 II/3 III/3 | 43 | 1719 | |
| 12 | 1952 | 2038 | 2046 | N21W42 | M3.3 | 0 | 40 | 1718 | Location from SolarSoft Events |
| LOC: approximate heliographic location | TYPE: radio burst type |
| XRAY: X-ray flare class | Cat: Catania sunspot group number |
| OP: optical flare class | NOAA: NOAA active region number |
| 10CM: peak 10 cm radio flux |
Solar (flaring) activity was low at the start of the week, until Thursday, when an M6.5 flare erupted almost on the center of the solar disk (AR 11719). On Friday too, an M3.3 flare erupted from AR 11718. Both days are thus categorized as moderate activity. After that flare activity diminished during the week end, thereby evolving from low on Saturday to very low on Sunday.
In order to view the activity of this week in more detail, we suggest to go to the following website from which all the daily (normal and difference) movies can be accessed: http://proba2.oma.be/ssa.
This page also lists the recorded flaring events.
A weekly overview movie can be found here: http://proba2.oma.be/swap/data/mpg/movies/WeeklyReportMovies/WR159/2013_04_08_00_00_07_2013_04_14_22_53_55_SWAP_174__AIA_304-hq.mp4 (SWAP174/AIA304 combination; HelioViewer.org).
During the week, several interesting events occurred, some of which are presented below.

For a SWAP difference movie of this event, see here: http://proba2.oma.be/swap/data/mpg/movies/WeeklyReportMovies/WR159/Events/SWAP_DoubleEruption_NEQ_08Apr2013.mp4.
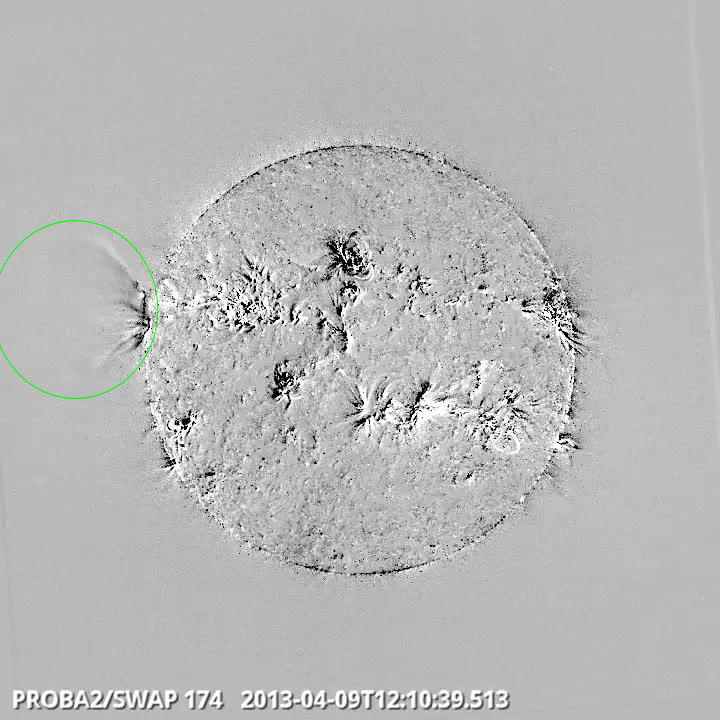
For a SWAP difference movie of this event, see here: http://proba2.oma.be/swap/data/mpg/movies/WeeklyReportMovies/WR159/Events/SWAP_Eruption_EastLimb_09Apr2013.mp4.

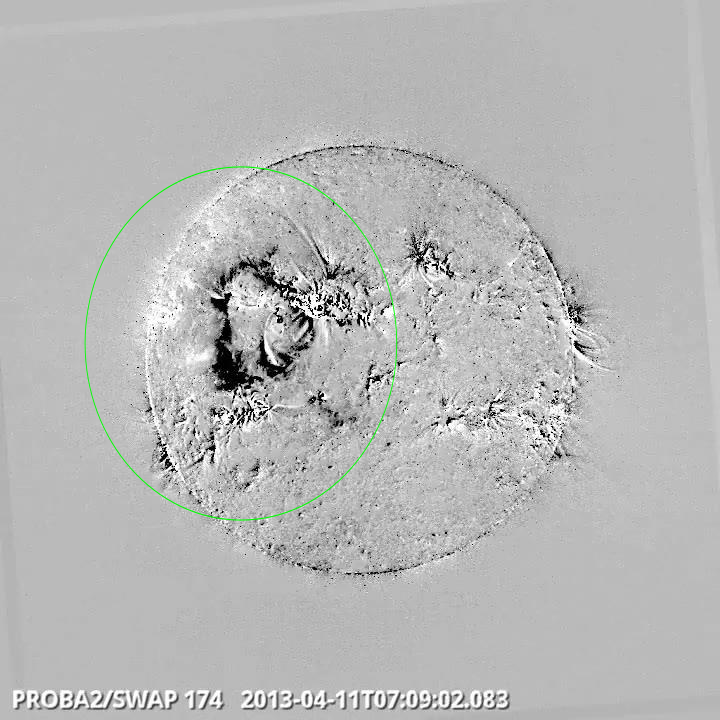
For a SWAP difference movie of this event, see here: http://proba2.oma.be/swap/data/mpg/movies/WeeklyReportMovies/WR159/Events/SWAP_M65_11Apr2013_0655.mp4.
For a HelioViewer movie (SWAP/AIA), see here: http://proba2.oma.be/swap/data/mpg/movies/WeeklyReportMovies/WR159/Events/2013_04_11_04_00_31_2013_04_11_09_57_55_SWAP_174__AIA_304-hq.mp4.
A special flare hunting campaign was initiated on Friday evening, based on the forecasts issued that day. That same evening, the M3.3 flare occurring in AR 11718 was captured successfully by LYRA Unit 3, specially opened for that purpose (see plot below).
At the same time EVE (SDO) was also running a flare campaign.

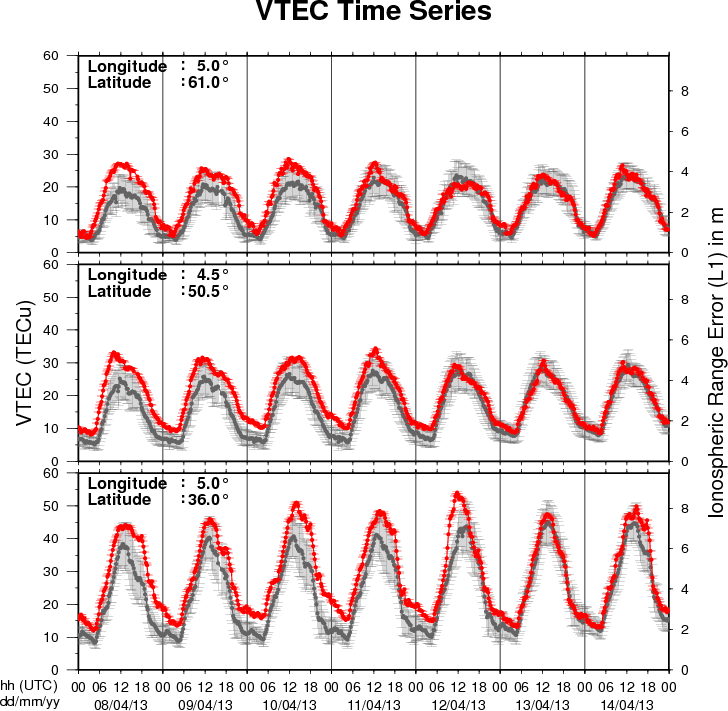
The figure shows the time evolution of the Vertical Total Electron Content (VTEC) (in red) during the last week at three locations:
a) in the northern part of Europe(N61°, 5°E)
b) above Brussels(N50.5°, 4.5°E)
c) in the southern part of Europe(N36°, 5°E)
This figure also shows (in grey) the normal ionospheric behaviour expected based on the median VTEC from the 15 previous days.
The VTEC is expressed in TECu (with TECu=10^16 electrons per square meter) and is directly related to the signal propagation delay due to the ionosphere (in figure: delay on GPS L1 frequency).
The Sun's radiation ionizes the Earth's upper atmosphere, the ionosphere, located from about 60km to 1000km above the Earth's surface.The ionization process in the ionosphere produces ions and free electrons. These electrons perturb the propagation of the GNSS (Global Navigation Satellite System) signals by inducing a so-called ionospheric delay.
See http://stce.be/newsletter/GNSS_final.pdf for some more explanations ; for detailed information, see http://gnss.be/ionosphere_tutorial.php
Presentatie over de 24ste zonnecyclus voor leden van de VVS-afdeling ASH Polaris te Herentals in het kader van hun maandelijkse voordrachten. Een basiskennis is vereist. Behandelde onderwerpen zijn zonnevlekken, de zonnedynamo, zonneuitbarstingen, ruimteweer, voorspellingen voor SC24, evolutie van SC24, verwachtingen voor het verdere verloop van SC24.
http://www.spaceweather.eu/en/repository/show?id=429
Poster for the session 4: DATA ASSIMILATION, VISUALIZATION AND ANALYSIS
http://www.spaceweather.eu/en/repository/show?id=430