
The Solar-Terrestrial Centre of Excellence (STCE) is a collaborative network of the Belgian Institute for Space Aeronomy, the Royal Observatory of Belgium and the Royal Meteorological Institute of Belgium.
|
Published by the STCE - this issue : 22 Nov 2013. The Solar-Terrestrial Centre of Excellence (STCE) is a collaborative network of the Belgian Institute for Space Aeronomy, the Royal Observatory of Belgium and the Royal Meteorological Institute of Belgium. |
| Archive of the newsletters | Subscribe to this newsletter by mail |
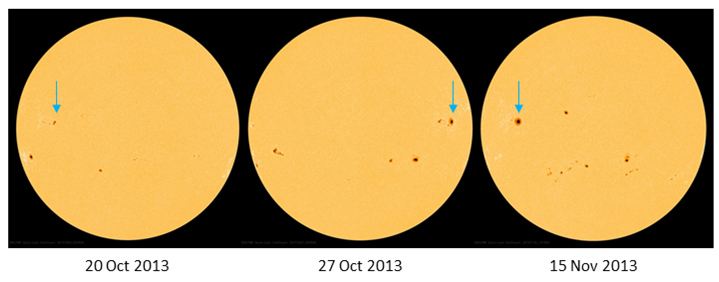
On 12 November, a big but symmetric sunspot rounded the eastern solar limb. Careful examination of white light images one solar rotation ago revealed that this new active region NOAA 1899 was in fact at the same location as NOAA 1875. This was a complex sunspot group that produced 12 medium and 2 extreme flares during its transit late October. Apparently, the main spot from NOAA 1875 had survived the backside transit on the Sun during the first 2 weeks of November, and was now giving an "encore performance". See the movie at http://www.youtube.com/watch?v=lYmijAy0LR0
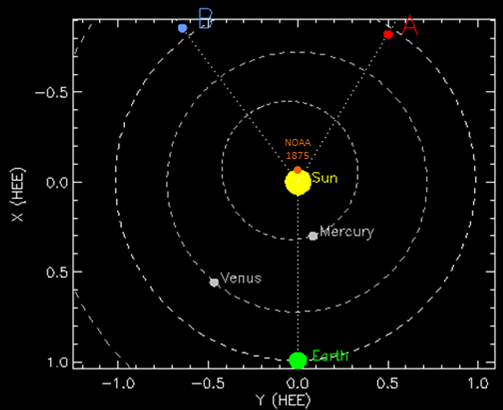
Actually, the sunspot group did more than just surviving. Imagery of the STEREO spacecraft revealed that good old NOAA 1875 continued to be very active, producing numerous strong flares, energetic particle events and coronal mass ejections (CMEs). The STEREO spacecraft were just in the right location to record all this activity. The image underneath shows the locations of the satellites, the Earth and the sunspot group on 5 November.
Activity started on 29 October while the region had just crossed the west limb. Despite the group not being visible from Earth, the flare produced by NOAA 1875 was still bright enough to be recorded by the GOES-15 satellite as an X2.3 flare (eXtreme class). STEREO-A had a really good view on the event (not far from its eastern solar limb). The associated CME was mostly directed away from both the spacecraft and the Earth.
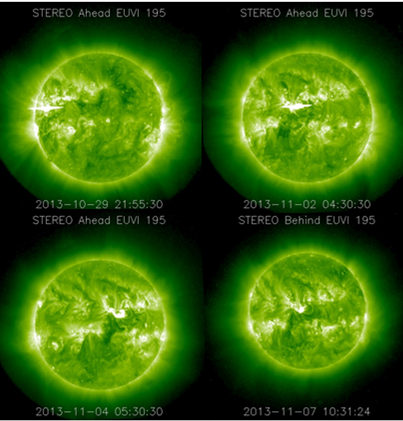
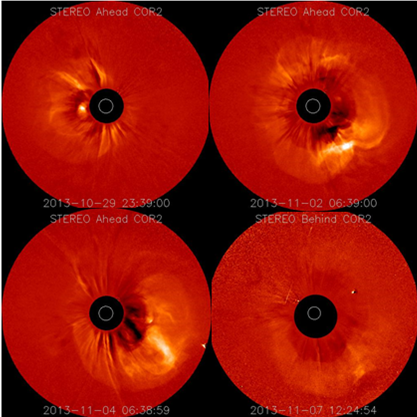
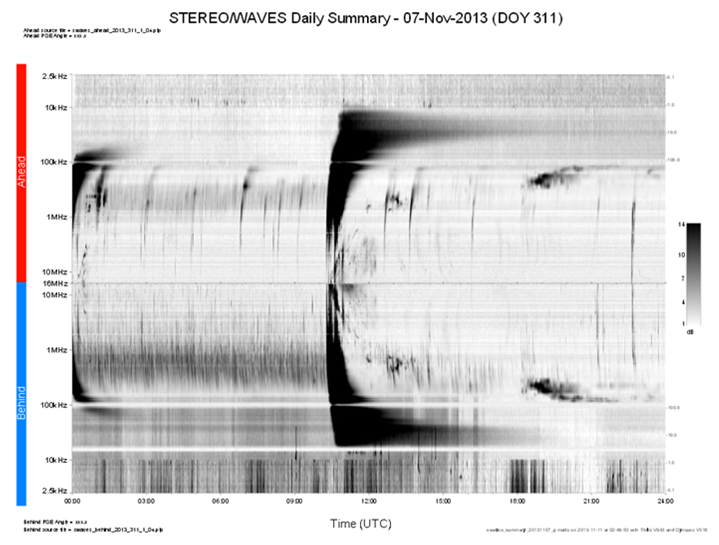
Among the numerous eruptive events, the flares on 2, 4 and 7 November clearly stood out. See images above, the bottom right image is from STEREO-B. They were all accompanied by transient coronal holes, post-flare coronal loops, and also strong radio bursts, as measured by STEREO's WAVES instrument. Such a burst is indicative for a CME, and indeed, the STEREO coronagraphs always showed a full halo CME, meaning that the CME was directed straight to the satellites. The halo CMEs can be seen in images underneath (bottom right image from STEREO-B). Note the 4 November halo CME was also seen as a halo event by SOHO, but here it obviously concerned a backside event, just as the two other November events.
The radio burst associated to the 7 November event was by far the most intense of the entire series. Though the CME itself was not as impressive as the other ones, its speed was estimated to be between 1400 and 2000 km/s. The fast plasma cloud apparently arrived already around noon the next day (only 26 hours after the flare), with wind speeds suddenly increasing from 375 to over 900 km/s, and densities from 1 to 25 particles per cm3. The cloud's magnetic field was oriented mainly northward though. Therefore, if at Earth, geomagnetic conditions would probably have been limited to moderate storming. After the 7 November event, NOAA 1875 significantly quieted down.
The movie at http://www.youtube.com/watch?v=lYmijAy0LR0 starts by showing the X2-flare as seen by SDO/AIA 131. Then follows the view from STEREO-A thru its EUVI 195 telescope and coronagraph COR2 from 29 October till 4 November. The same type of instruments then shows the activity from 5 till 11 November, but this time as seen by STEREO-B. The movie concludes by showing the view thru SOHO's coronagraphs over the same time period (i.e. from 29 October till 11 November). NOAA 1875's events can clearly be seen as (backside) partial or full halo CMEs.
Credits - Data and imagery were taken from STEREO (http://stereo.gsfc.nasa.gov/), SDO (http://sdo.gsfc.nasa.gov/), SOHO (http://sohowww.nascom.nasa.gov/ ) and Helioviewer (http://www.helioviewer.org/).
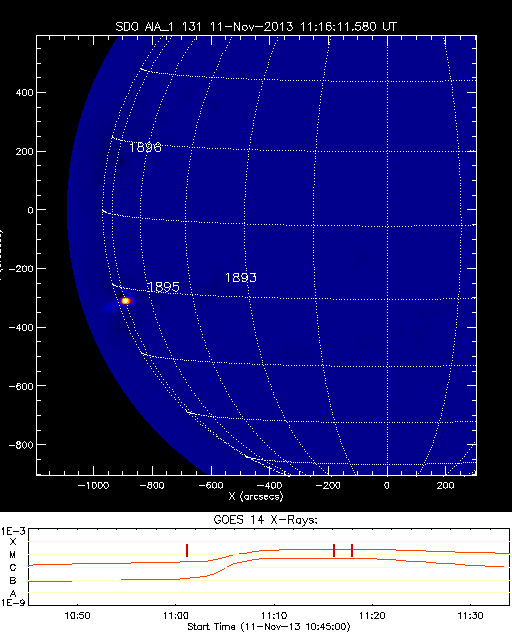
Six M-class flares and sixty-seven C-class flares were reported by GOES. The strongest flare of the week was the M2.4 flare on November 11, peaking at 11:18 UT. The flare originated from the Catania sunspot group 45 and had no clear signature of a CME in SOHO/LASCO and STEREO data.
In the difference image of SDO/AIA 131 the flare source area is highlighted. It was only the next day, November 12, the region causing the limb event was identified as NOAA AR 1897. The bottom panel shows the GOES X-ray radiation during the flare. Check SolarSoft: http://www.lmsal.com/solarsoft/latest_events/
The only wide CME observed this week was first seen in the SOHO/LASCO C2 field of view at 07:48 UT, on November 17. The CME had angular width of about 180 degrees and projected speed of about 700 km/s (as reported by CACTUS software). The bulk of the CME mass was directed southward of the Sun-Earth line.

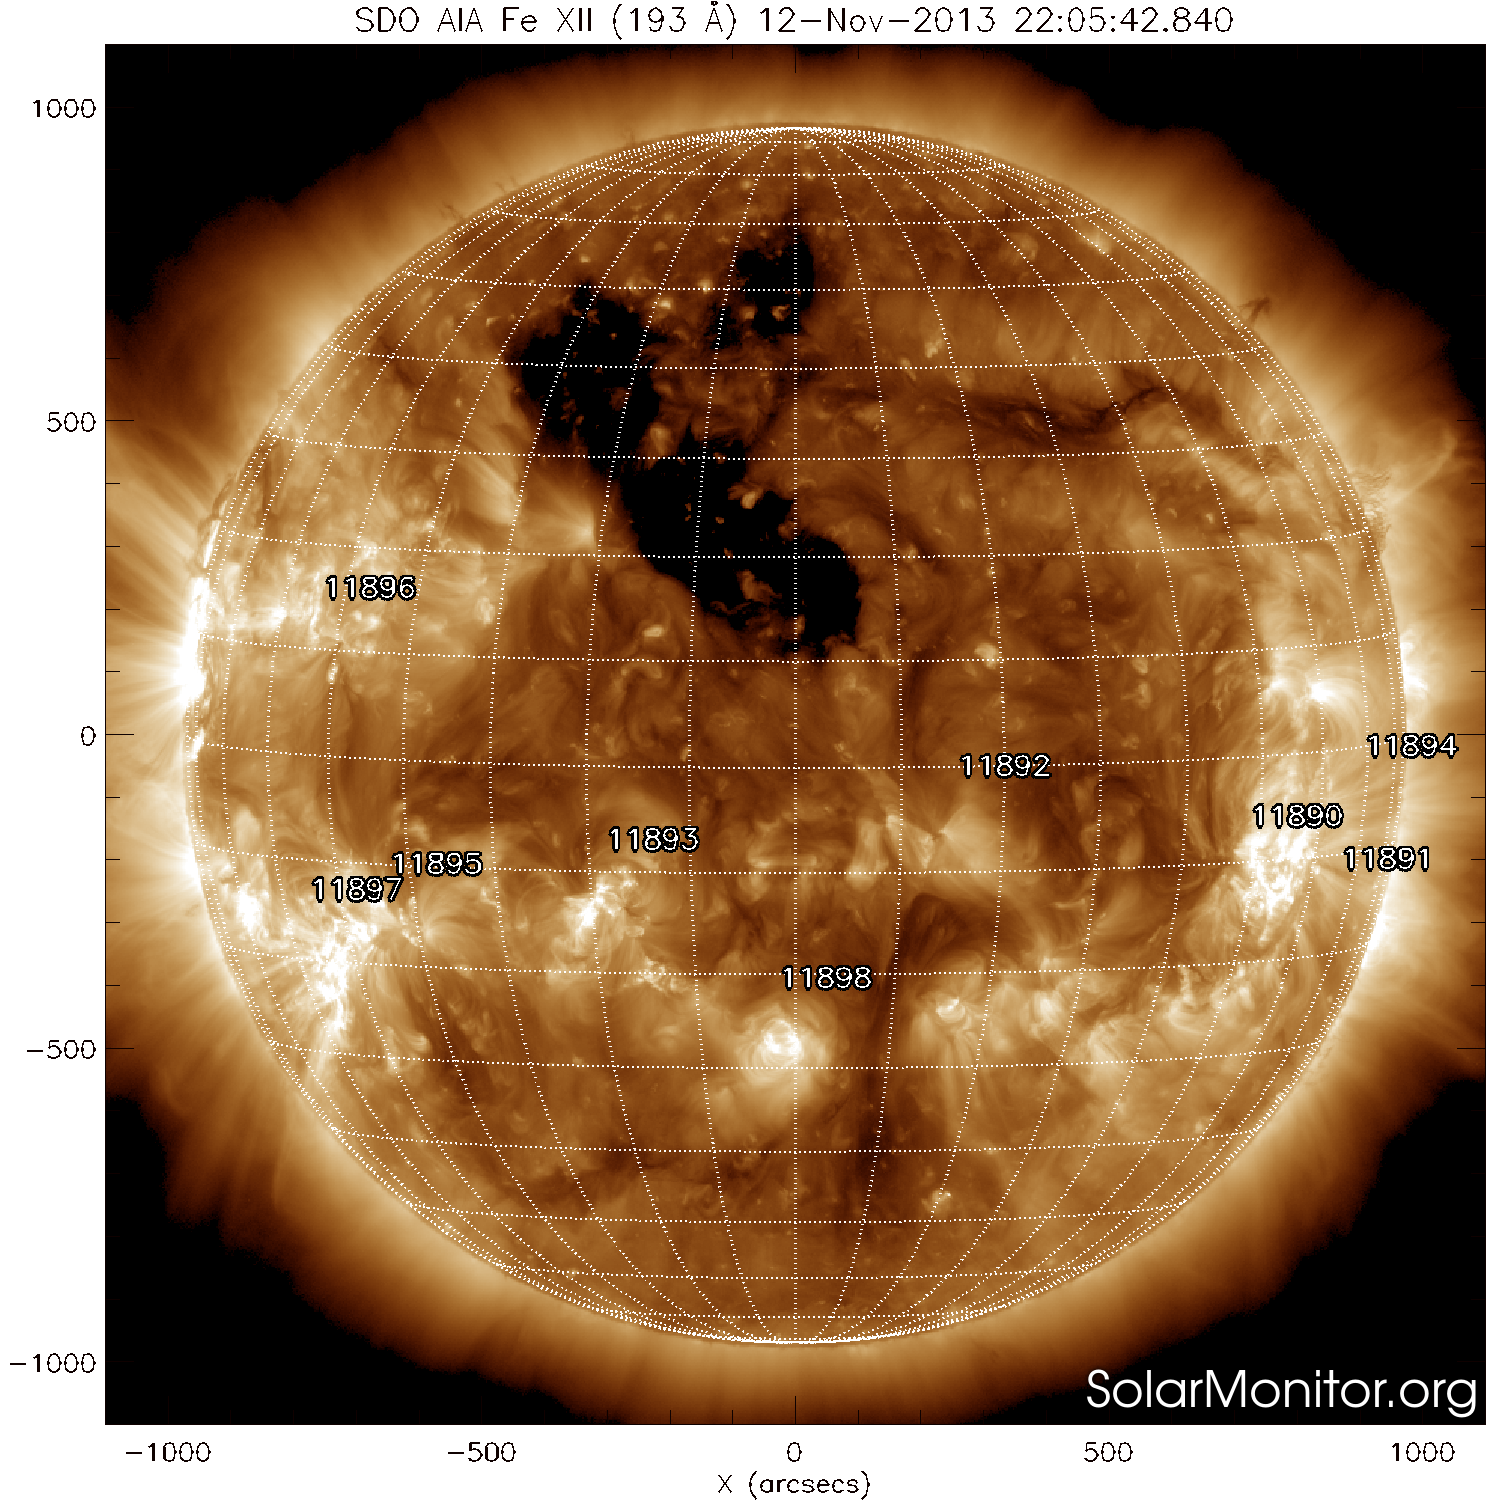
A coronal hole situated in the northern hemisphere reached the central meridian on November 13 as can be seen in the SDO/AIA 193 image.
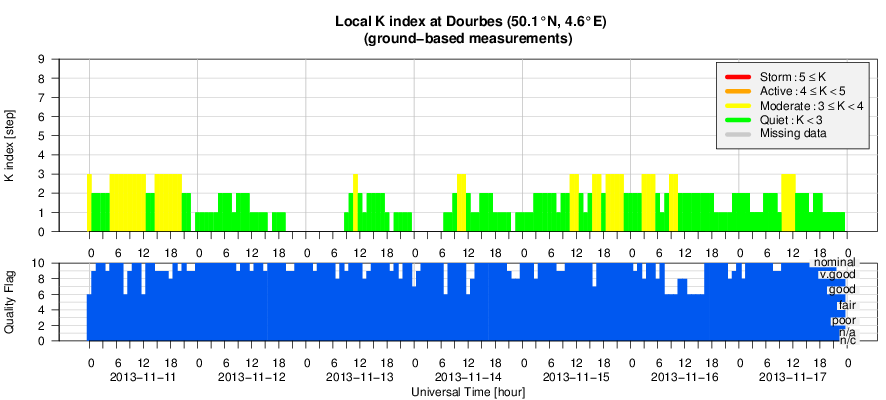
The fast flow from the low-latitude coronal hole in the northern hemisphere arrived at the Earth on November 16.The solar wind speed reached a maximum value of about 570 km/s on that day. The interplanetary magnetic field (IMF) magnitude had the maximum value of about 13 nT. Check the graphs below where the in situ solar wind speed and the total IMF and its Bz component measured at L1 is shown. Since the Bz component was only mildly negative, the geomagnetic conditions stayed quiet with Dourbes reporting only a few intervals of K equals 3.
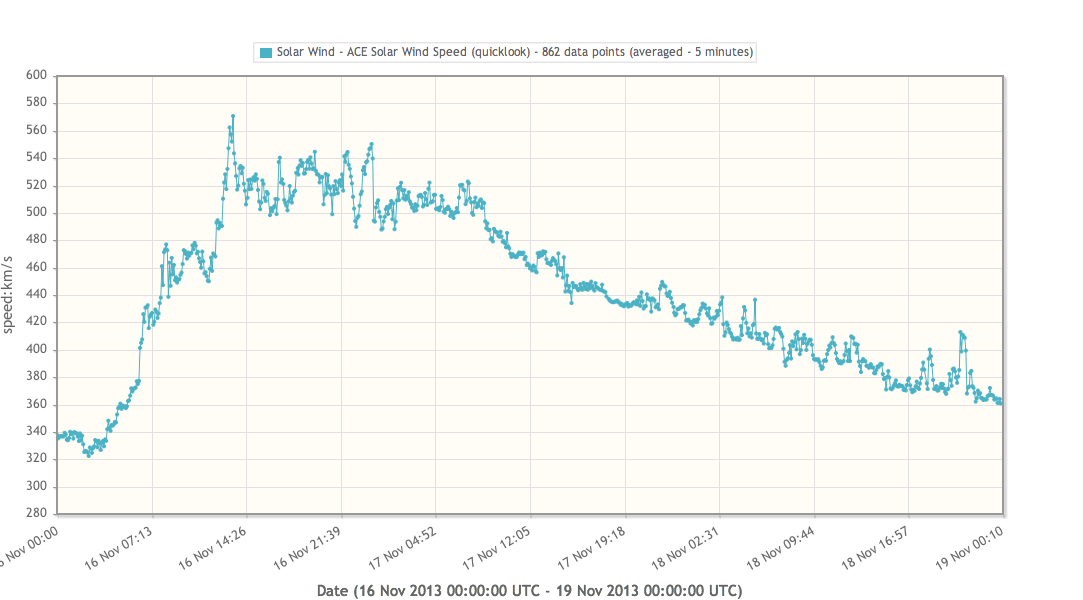
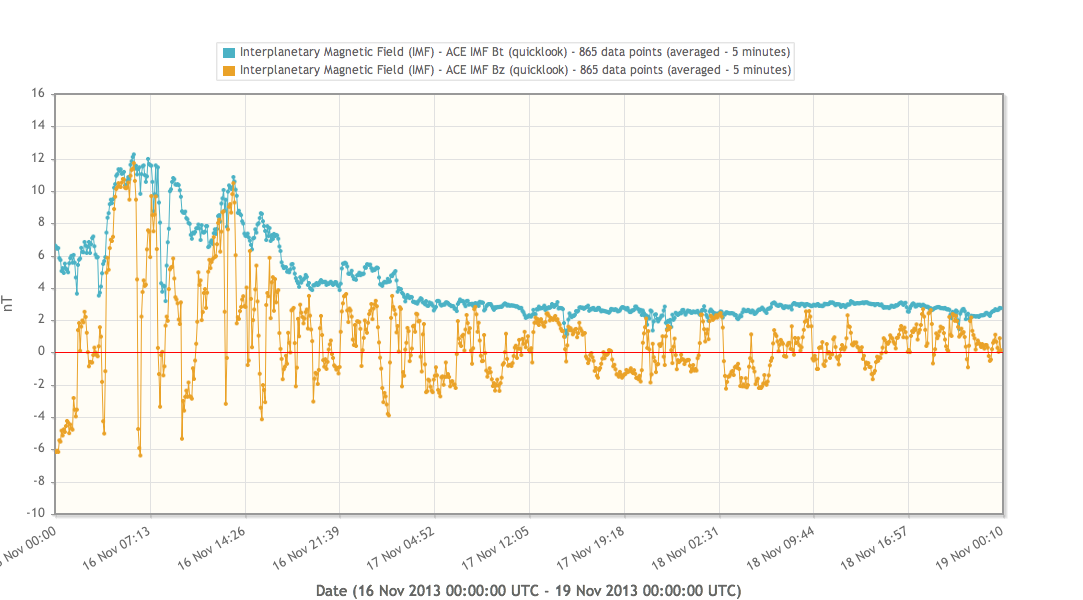
Otherwise, the IMF magnitude was stable at about 4 nT. Looking at the 'Geomagnetic Observations at Dourbes' overview, one can see that coronal hole didn't show up with a particular strong signature.
| DAY | BEGIN | MAX | END | LOC | XRAY | OP | 10CM | TYPE | Cat | NOAA |
| 11 | 1101 | 1118 | 1130 | M2.4 | 76 | 1897 | ||||
| 13 | 1457 | 1520 | 1541 | M1.4 | 1897 | |||||
| 15 | 0220 | 0229 | 0233 | N7E52 | M1.0 | SF | 46 | 1899 | ||
| 16 | 0447 | 0453 | 0457 | M1.2 | III/1 | 41 | 1900 | |||
| 16 | 0745 | 0749 | 0753 | S19W29 | M1.6 | 1F | CTM/1III/1 | 41 | 1900 | |
| 17 | 0506 | 0510 | 0513 | S20W42 | M1.0 | SN | 41 | 1900 |
| LOC: approximate heliographic location | TYPE: radio burst type |
| XRAY: X-ray flare class | Cat: Catania sunspot group number |
| OP: optical flare class | NOAA: NOAA active region number |
| 10CM: peak 10 cm radio flux |
Solar flare activity fluctuated between low and moderate during the week.
In order to view the activity of this week in more detail, we suggest to go to the following website from which all the daily (normal and difference) movies can be accessed: http://proba2.oma.be/ssa
This page also lists the recorded flaring events.
A weekly overview movie can be found here (SWAP week 190).
http://proba2.oma.be/swap/data/mpg/movies/WeeklyReportMovies/WR190_Nov11_Nov17/weekly_movie_2013_11_11.mp4
Details about some of this week's events, can be found further below.
The active region NOAA 1890 was particularly active on Wednesday Nov 13.

Failed eruption on southeast quad @ 06:33 - SWAP difference image
Find a movie of the event here (SWAP difference movie)
http://proba2.oma.be/swap/data/mpg/movies/WeeklyReportMovies/WR190_Nov11_Nov17/Events/20131112_Eruption_SoutWestLimb_0633_swap_diff.mp4
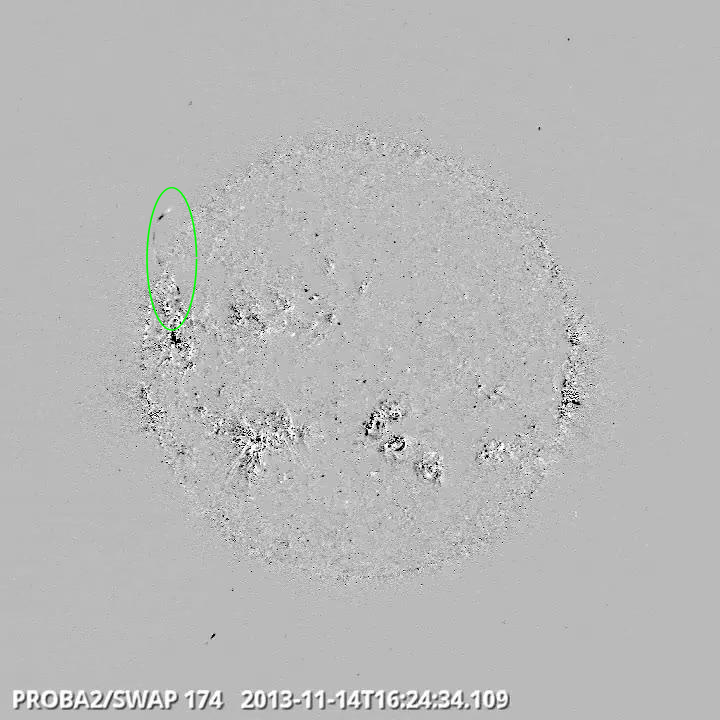
Flow on northeast Limb @ 16:24 - SWAP difference image
Find a movie of the event here (SWAP difference movie)
http://proba2.oma.be/swap/data/mpg/movies/WeeklyReportMovies/WR190_Nov11_Nov17/Events/20131114_Flow_NorthEastLimb_1624_swap_diff.mp4
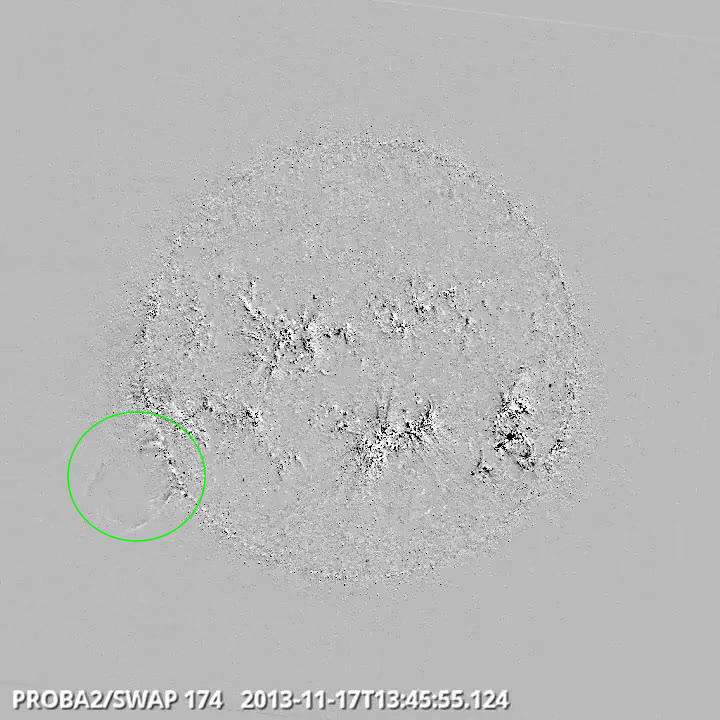
Eruption on southeast limb @ 13:45 - SWAP difference image
Find a movie of the event here (SWAP difference movie)
http://proba2.oma.be/swap/data/mpg/movies/WeeklyReportMovies/WR190_Nov11_Nov17/Events/20131117_Eruption_EastLimb_1345_swap_diff.mp4
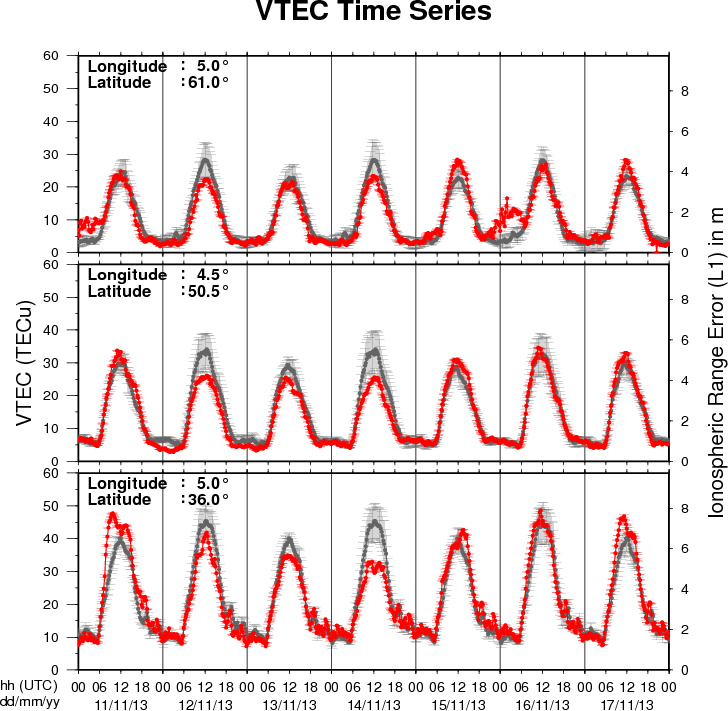
The figure shows the time evolution of the Vertical Total Electron Content (VTEC) (in red) during the last week at three locations:
a) in the northern part of Europe(N61°, 5°E)
b) above Brussels(N50.5°, 4.5°E)
c) in the southern part of Europe(N36°, 5°E)
This figure also shows (in grey) the normal ionospheric behaviour expected based on the median VTEC from the 15 previous days.
The VTEC is expressed in TECu (with TECu=10^16 electrons per square meter) and is directly related to the signal propagation delay due to the ionosphere (in figure: delay on GPS L1 frequency).
The Sun's radiation ionizes the Earth's upper atmosphere, the ionosphere, located from about 60km to 1000km above the Earth's surface.The ionization process in the ionosphere produces ions and free electrons. These electrons perturb the propagation of the GNSS (Global Navigation Satellite System) signals by inducing a so-called ionospheric delay.
See http://stce.be/newsletter/GNSS_final.pdf for some more explanations ; for detailed information, see http://gnss.be/ionosphere_tutorial.php
Start : 2014-04-27 - End : 2014-05-02
The EGU General Assembly 2014 will bring together geoscientists
from all over the world to one meeting covering all disciplines of
the Earth, planetary and space sciences. The EGU aims to provide a
forum where scientists, especially early career researchers, can
present their work and discuss their ideas with experts in all
fields of geosciences.