
The Solar-Terrestrial Centre of Excellence (STCE) is a collaborative network of the Belgian Institute for Space Aeronomy, the Royal Observatory of Belgium and the Royal Meteorological Institute of Belgium.
|
Published by the STCE - this issue : 2 Oct 2015. The Solar-Terrestrial Centre of Excellence (STCE) is a collaborative network of the Belgian Institute for Space Aeronomy, the Royal Observatory of Belgium and the Royal Meteorological Institute of Belgium. |
| Archive of the newsletters | Subscribe to this newsletter by mail |
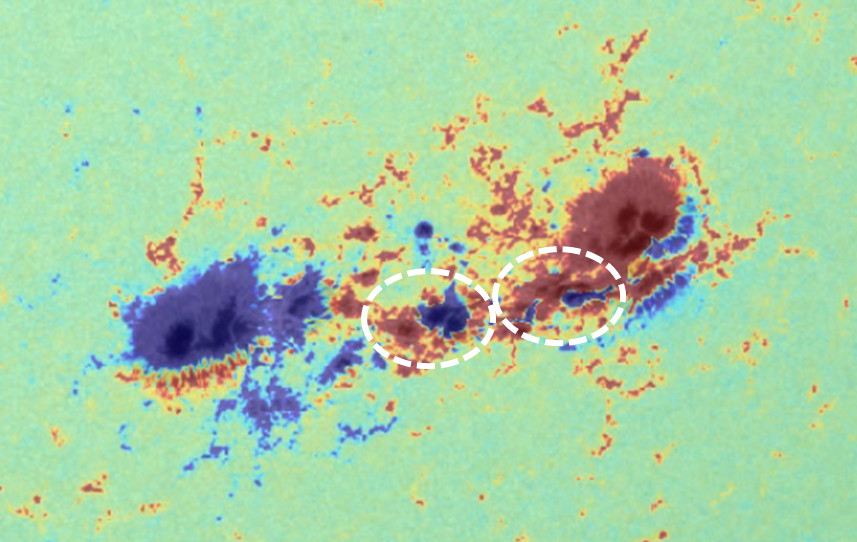
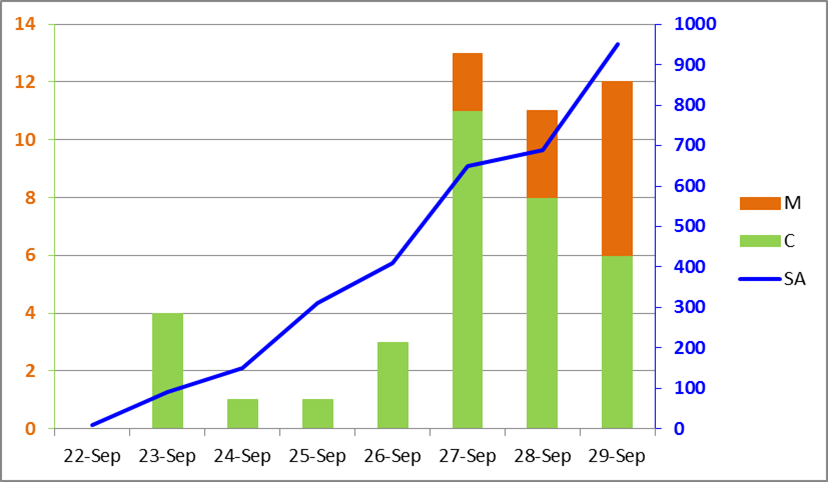
And that's exactly what active region NOAA 2422 did last week. From nothing, it started to emerge on 22 September as a simple bipolar sunspot region. Over the next few days, it developed into a fully mature sunspot group, gradually increasing its magnetic complexity. Until the 26th, it produced only a handful of C-class flares. However, by then, it had developed significant delta structures (spots of opposite magnetic polarity within the same penumbra) in its middle portion. This resulted in the production of M-class ("medium") flares starting on 27 September, with a major M7 flare on 28 September peaking at 14:58UT. The party continued on 29 September, with multiple M-class flares from this very active region.
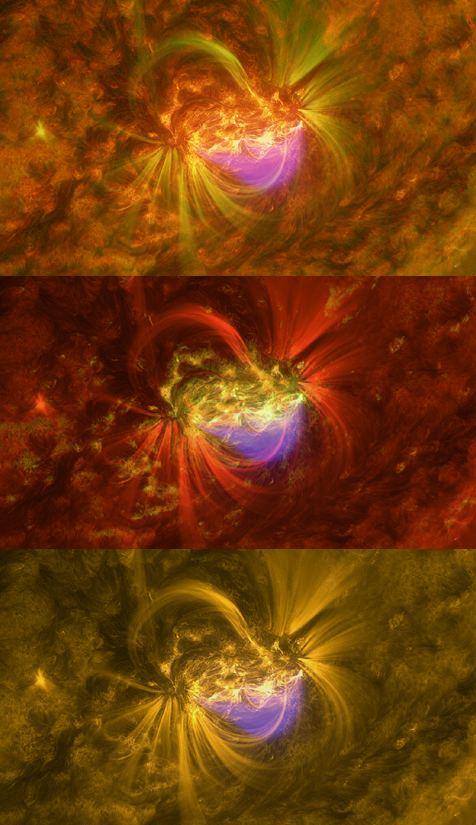
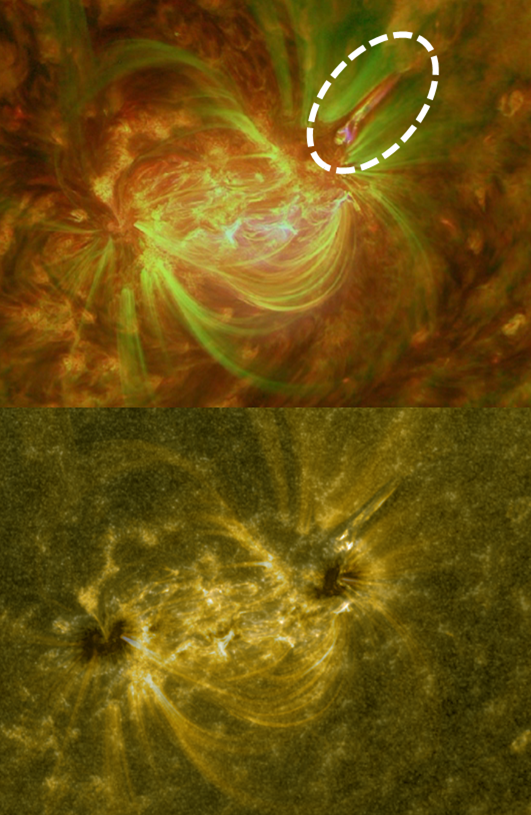
Images courtesy of SDO (http://sdo.gsfc.nasa.gov/data/aiahmi/) and (J)Helioviewer (http://helioviewer.ias.u-psud.fr/helioviewer/#).
- SSA SWE Segment status and prospects by Juha-Pekka Luntama
- Solar energetic particles: data environments, forecasting and impact by Tom Berger
- What do we know of solar flares? by Hugh Hudson
- Geomagnetically Induced Currents and Power Grids by Antti Pulkkinen
- Rosetta: flying through gas and dust by Andrea Accomazzo
- Model Validation and Metrics Studies for Space Environment Predictions by Masha Kuznetsova
- Planetary Space Weather in the Outer Heliosphere by Chris Arridge
- GAIA: First year flight operations in L2 environment by Federico Di Marco
- Neutron Monitors to study Space Weather in the Earth's Atmosphere and near-Earth by Erwin Flueckiger
- Radiation Belt Modeling and Forecasts: Limitations, Challenges and Future Needs by Reiner Friedel
The keynotes are plenary and scheduled before the sessions to allow you to get acquainted to the subjects of the day: http://www.stce.be/esww12/program/keynotes.php
Solar flare activity fluctuated between very low and moderate during the week.
In order to view the activity of this week in more detail, we suggest to go to the following website from which all the daily (normal and difference) movies can be accessed: http://proba2.oma.be/ssa
This page also lists the recorded flaring events.
A weekly overview movie can be found here: http://proba2.sidc.be/swap/data/mpg/movies/weekly_movies/weekly_movie_2015_09_21.mp4 (SWAP week 287).
Details about some of this week’s events:
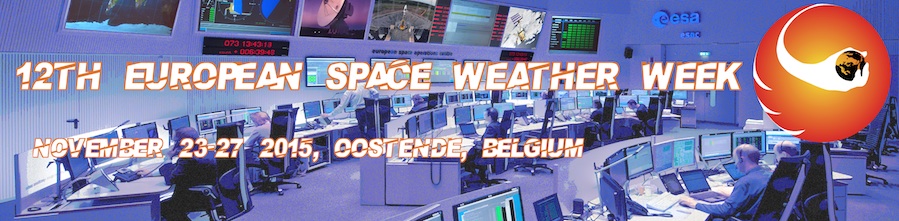
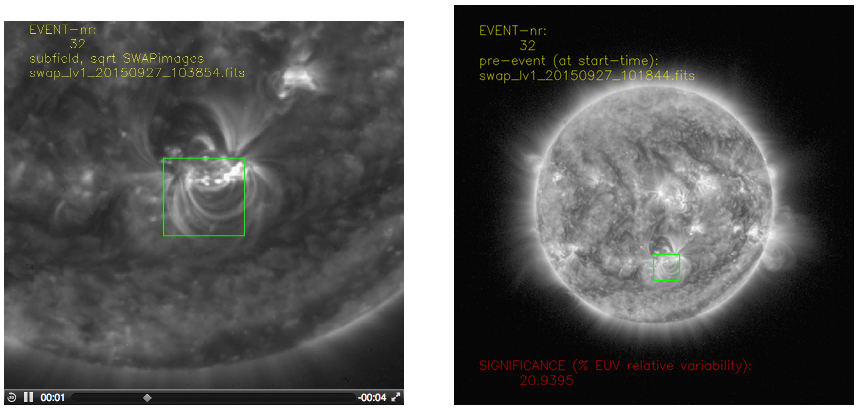
Solar activity increased towards the end of the week. AR 2422 produced two M-class flares on 2015-09-27: an M1.9 flare peaking around 10:40 UT and an M1.0 flare peaking around 21:00 UT.
Below we provide SWAP images from the time when these M-flares occurred on 2015-Sep-27. The annotated snapshots are produced by the Solar Feature Automated Search Tool (SoFAST). This tool detects dynamic solar events in EUV images from SWAP in near real-time. The snapshots illustrate the location of the flare on the solar disk (right) and a zoomed image (left).
The complete SoFAST online event list and additional plots are available on http://www.sidc.be/sofast.
M1.9 flare peaking around 10:40 UT
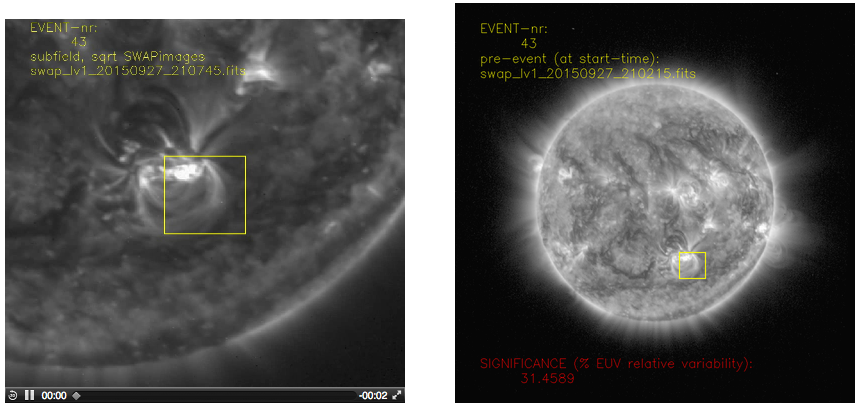
Eleven active regions were observed by NOAA during the week, with the NOAA AR numbers (corresponding Catania numbers in the brackets): 2415 (31), 2418 (32), 2419 (no Catania number), 2420 (38), 2421 (37), 2422 (39), 2423 (36), 2424 (40), 2425 (41), 2426 (42), 2427 (no Catania number). The flaring activity was variable from day to day, with NOAA ARs 2415, 2420, 2421, 2422, and 2423 producing flares above the B9.9-level. The strongest flare of the week was the M1.9 flare peaking at 10:40 UT on September 27 in the NOAA AR 2422 (Catania number 39). This group also released the second M-flare of this week on September 27. None of the flares was associated with an Earth-directed CME.
| DAY | BEGIN | MAX | END | LOC | XRAY | OP | 10CM | TYPE | Cat | NOAA |
| 27 | 1020 | 1040 | 1046 | S22W8 | M1.9 | 1F | 39 | 2422 | ||
| 27 | 2054 | 2100 | 2115 | S21W16 | M1.0 | 1N | III/1 | 39 | 2422 |
| LOC: approximate heliographic location | TYPE: radio burst type |
| XRAY: X-ray flare class | Cat: Catania sunspot group number |
| OP: optical flare class | NOAA: NOAA active region number |
| 10CM: peak 10 cm radio flux |
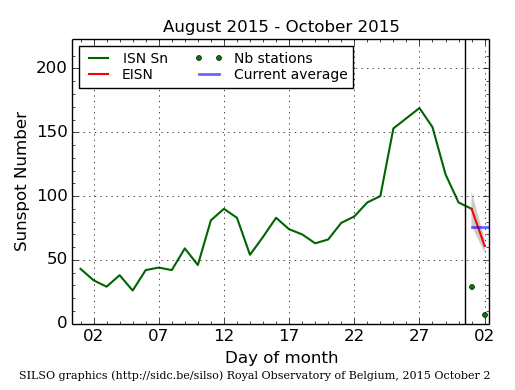
The daily Estimated International Sunspot Number (EISN, red curve with shaded error) derived by a simplified method from real-time data from the worldwide SILSO network. It extends the official Sunspot Number from the full processing of the preceding month (green line). The plot shows the last 30 days (~ one solar rotation). The horizontal blue line shows the current monthly average, while the green dots give the number of stations included in the calculation of the EISN for each day.
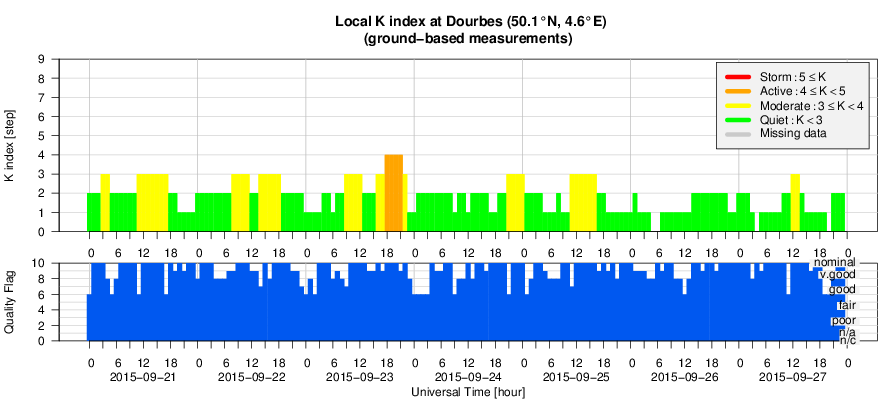
Solar wind measured by ACE in the L1 point near the Earth was very variable during the week but without clear structuring. The solar wind speed was varying between less than 400 km/s and almost 700 km/s. Even if the interplanetary magnetic field magnitude was reaching 10 nT at times, the geomagnetic activity was mostly at the quiet to unsettled levels. Only one interval of active conditions (K = 4) was reported by Dourbes, IZMIRAN, and NOAA (in the evening of September 23).
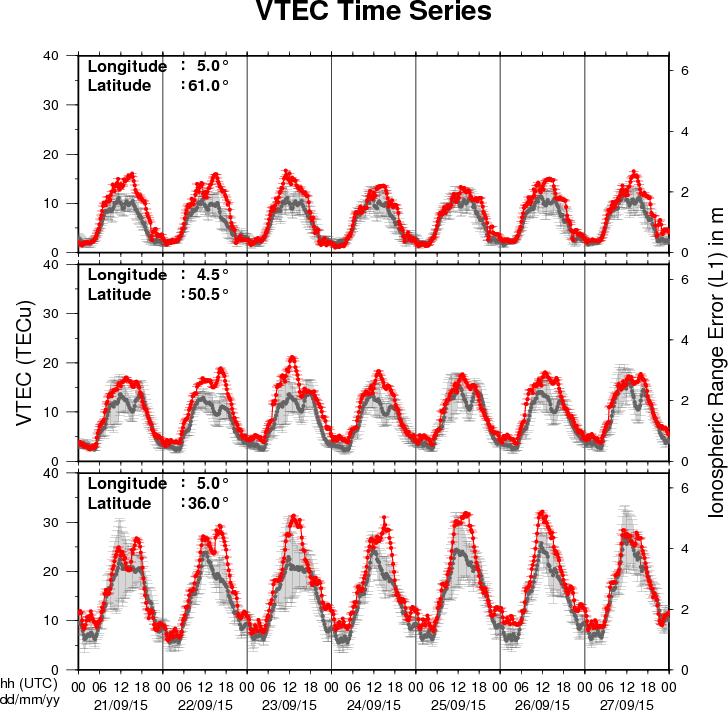
The figure shows the time evolution of the Vertical Total Electron Content (VTEC) (in red) during the last week at three locations:
a) in the northern part of Europe(N61°, 5°E)
b) above Brussels(N50.5°, 4.5°E)
c) in the southern part of Europe(N36°, 5°E)
This figure also shows (in grey) the normal ionospheric behaviour expected based on the median VTEC from the 15 previous days.
The VTEC is expressed in TECu (with TECu=10^16 electrons per square meter) and is directly related to the signal propagation delay due to the ionosphere (in figure: delay on GPS L1 frequency).
The Sun's radiation ionizes the Earth's upper atmosphere, the ionosphere, located from about 60km to 1000km above the Earth's surface.The ionization process in the ionosphere produces ions and free electrons. These electrons perturb the propagation of the GNSS (Global Navigation Satellite System) signals by inducing a so-called ionospheric delay.
See http://stce.be/newsletter/GNSS_final.pdf for some more explanations ; for detailed information, see http://gnss.be/ionosphere_tutorial.php
Start : 2015-10-26 - End : 2015-10-29
Erupting prominences/filaments, surges, flares, and coronal mass
ejections (CMEs) are prominent examples of the dynamic Sun.
Multi-wavelength and multi-instrument observations have the
potential to reveal highly energetic physical processes on the Sun
reaching from the photosphere, over the chromosphere and the
transition region, to the corona and beyond. Solar physicists have
nowadays access to a suite of new ground-based observing facilities
including, for example, the 1.5-meter GREGOR solar telescope at the
Observatorio del Teide, Tenerife, Spain, the European Low Frequency
Array (LOFAR), the Atacama Large Millimeter/Submillimeter Array
(ALMA) in Chile, and the Coronal Multi-Channel Polarimeter for
Slovakia (COMP-S) at Lomnicky Peak Observatory. A powerful fleet of
space missions, for example, the Reuven Ramaty High Energy Solar
Spectroscopic Imager (RHESSI), the Japanese Hinode, and the Solar
Dynamics Observatory (SDO), adds more capabilities to investigate
magnetic fields, complex plasma flows, and accelerated particle,
and thermal properties of solar eruptive events. In the tradition
of the series of »Potsdam Thinkshops«, we
invite instrument specialists, observers, modellers, and theorists
to exchange ideas, to stimulate discussion, to initiate future
collaborations among participants, and to attract new users of
instruments by showcasing the capabilities. The aim is to make
progress towards a comprehensive description of solar eruptive
events effectively aggregating their global properties as well as
their highly dynamic fine structure. Thinkshop 12 takes place at
the science park »Albert Einstein«, home to
AIP's Great Refractor and the Solar Observatory Einstein Tower at
the Telegraphenberg.
Website:
https://thinkshop.aip.de/12/cms/
Start : 2015-10-26 - End : 2015-10-29
The IRIS-5 workshop will be conducted at the Inter-University
Centre for Astronomy and Astrophysics (IUCAA), Pune, India from
October 26-29, 2015. This workshop is mainly aimed at the
participants who could not attend IRIS-4, which is being held at
Boulder, USA. Therefore, set up of the IRIS-5 workshop would be
essentially be very similar to that of IRIS-4.
The main aim of the workshop is to introduce the Interface
Region Imaging Spectrometer (IRIS) to students and young post docs.
This would be done through tutorials on IRIS data analysis, physics
of optically thick radiative transfer, MHD simulations of the solar
atmosphere related to IRIS and hydrodynamic simulations of flares.
There will be lectures as well as hands on sessions.
Website:
http://www.iucaa.ernet.in/~solar/Welcome.html
Start : 2015-11-09 - End : 2015-11-11
The fundamentally most important source of inner heliospheric
plasma physics and space weather is the active Sun, its solar
active region eruptions. Prediction of the evolution and influence
of solar active regions on solar storms in the near-Earth
environment is of particular interest to several forecasting
institutions, industrial stakeholders, and the public in
general.
State-of-the-art solar storm prediction tools are limited to
monitoring solar active regions, registering eruptions and mass
ejections while attempting, then, at extrapolating subsequent
evolution and spatio-temporal propagation: no realistic
physics-based and data-driven synthesis tool exists, which is
capable of predicting when a solar flare will be triggered, or when
a Coronal Mass Ejection will be launched into inter-planetary
space. In short, we are not yet able to answer the question: When
and why do solar storms launch?
Our meeting will be focused around initiation of space weather
events at the Sun. We will discuss and develop three major
challenges, and we aim to develop a draft resolution road-map for
those challenges during the meeting.
Website:
https://indico.nbi.ku.dk/conferenceDisplay.py?confId=817
Start : 2015-11-13 - End : 2015-11-13
With the launch of NASA's Solar Dynamics Observatory (SDO)
mission on 02/11/2010, researchers in solar physics have entered
the era of Big Data. The Atmospheric Imaging Assembly (AIA)
instrument on SDO provides imaging data and the Helioseismic and
Magnetic Imager (HMI) instrument on SDO provides magnetic field
data. Both instruments record data at a high spatial resolution and
a time cadence, amounting to about 1 Petabyte of scientific data
each year. The Big Data challenges in Solar Astronomy are expected
to grow even further with the inauguration of the NSF funded Daniel
K. Inouye Solar Telescope (DKIST), currently under construction in
Hawaii. This telescope is expected to generate: 3-5 Petabytes of
data per year.
Start : 2016-06-27 - End : 2016-07-01
Website:
http://www.issibern.ch/program/workshops.html