- Table of Content
- 1.PROBA2 views P...
- 2.PROBA2 Observa...
- 3.Review of sola...
- 4.The Internatio...
- 5.Review of geom...
- 6.Geomagnetic Ob...
- 7.Review of iono...
- 8.New documents ...
2. PROBA2 Observations (29 Feb 2016 - 6 Mar 2016)
3. Review of solar activity
4. The International Sunspot Number
5. Review of geomagnetic activity
6. Geomagnetic Observations at Dourbes (29 Feb 2016 - 6 Mar 2016)
7. Review of ionospheric activity (29 Feb 2016 - 6 Mar 2016)
8. New documents in the European Space Weather Portal Repository
PROBA2 views Partial Solar Eclipse - 8 and 9 March 2016
On 2016 March 8 and 9, a solar eclipse took place over the Pacific Ocean. This eclipse was total, that is, the entire solar disk was covered by the Moon- over Indonesia and the central Pacific, starting at sunrise over Sumatra and ending at sunset north of the Hawaiian Islands. Additionally, large parts of South-East Asia, Alaska and Australia witnessed a partial solar eclipse. The path of totality had a maximum width of 155 km and the maximum duration was 4 minutes and 9 seconds at the point of greatest eclipse, which was over the waters of the Pacific Ocean.
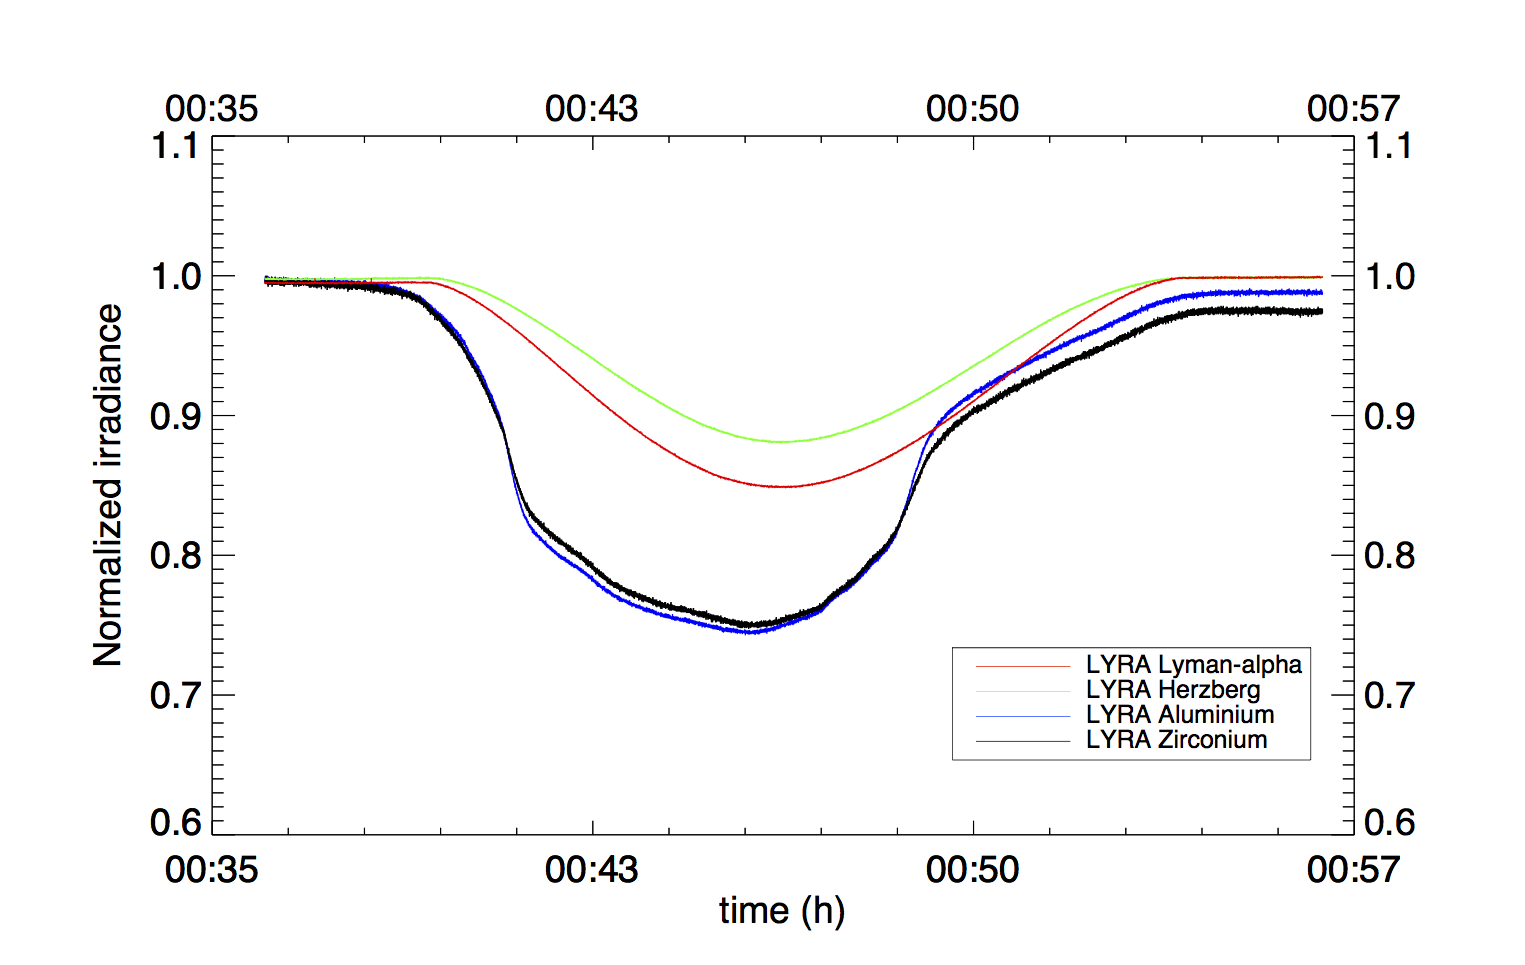
Unfortunately, this eclipse took place during night time in Belgium, so it could not be observed from ground here. Luckily, we do have the PROBA2 spacecraft observing the Sun nearly continuously. Due to its sun-synchronous orbit, PROBA2 follows the terminator, the dividing line between day and night on earth, and was thus able to observe a partial solar eclipse. Because PROBA2 has an orbit of only 90 minutes, it passed through the Moon’s shadow and observed a partial solar eclipse two times on March 9: between 00:40 UT and 00:54 UT and again between 02:58 UT and 03:13 UT. Additionally, the Moon appeared two times in the field of view of the solar instruments onboard PROBA2, SWAP and LYRA, without obscuring the solar disk.
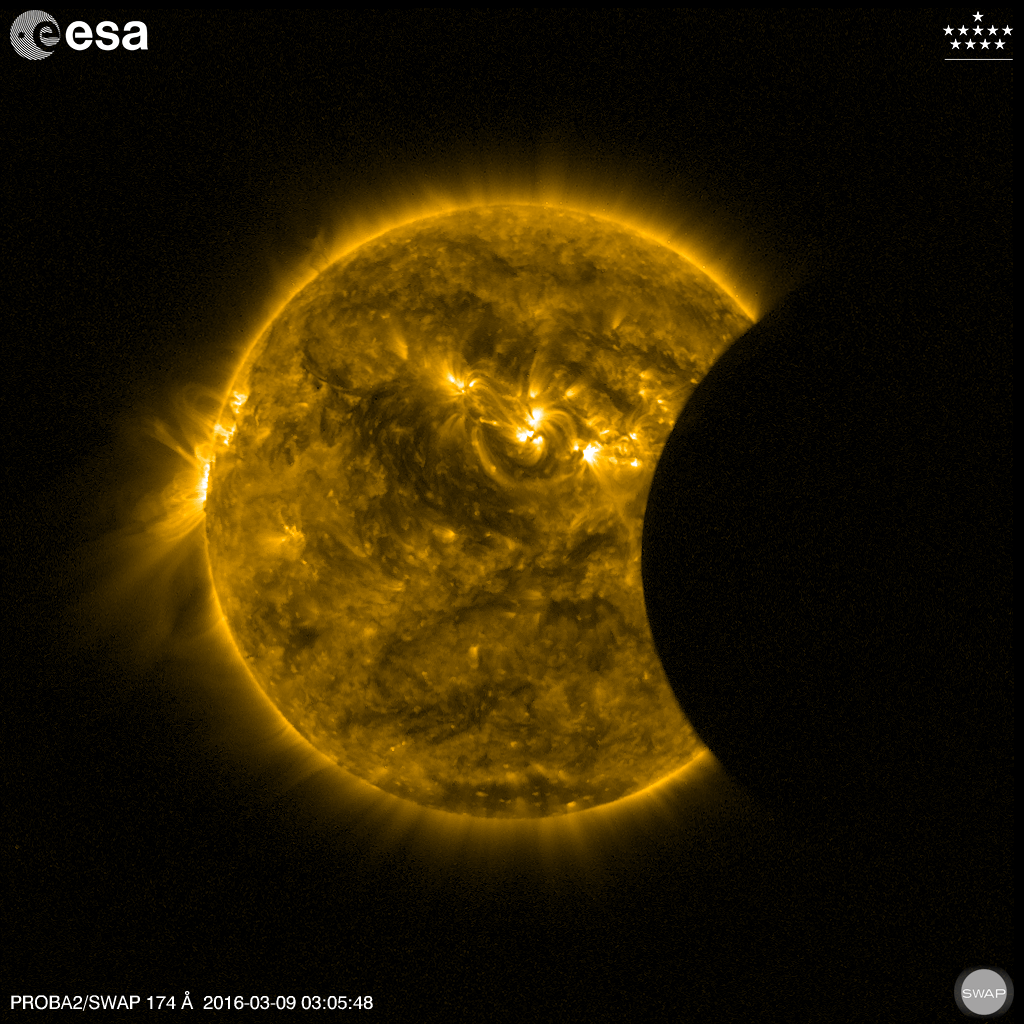
SWAP, an Extreme-Ultraviolet solar telescope, observes the solar corona in a passband centered on 17.4 nm. The structures we see in SWAP images have a temperature of approximately 1 million degrees. LYRA, an X-ray/Ultraviolet radiometer observes the total incoming light levels from the Sun in several wavelength bands.
The two transits of the Moon in front of the solar disk were also captured in LYRA timeseries. For the occasion, we activated our backup unit (unit3) in parallel to the nominal one.
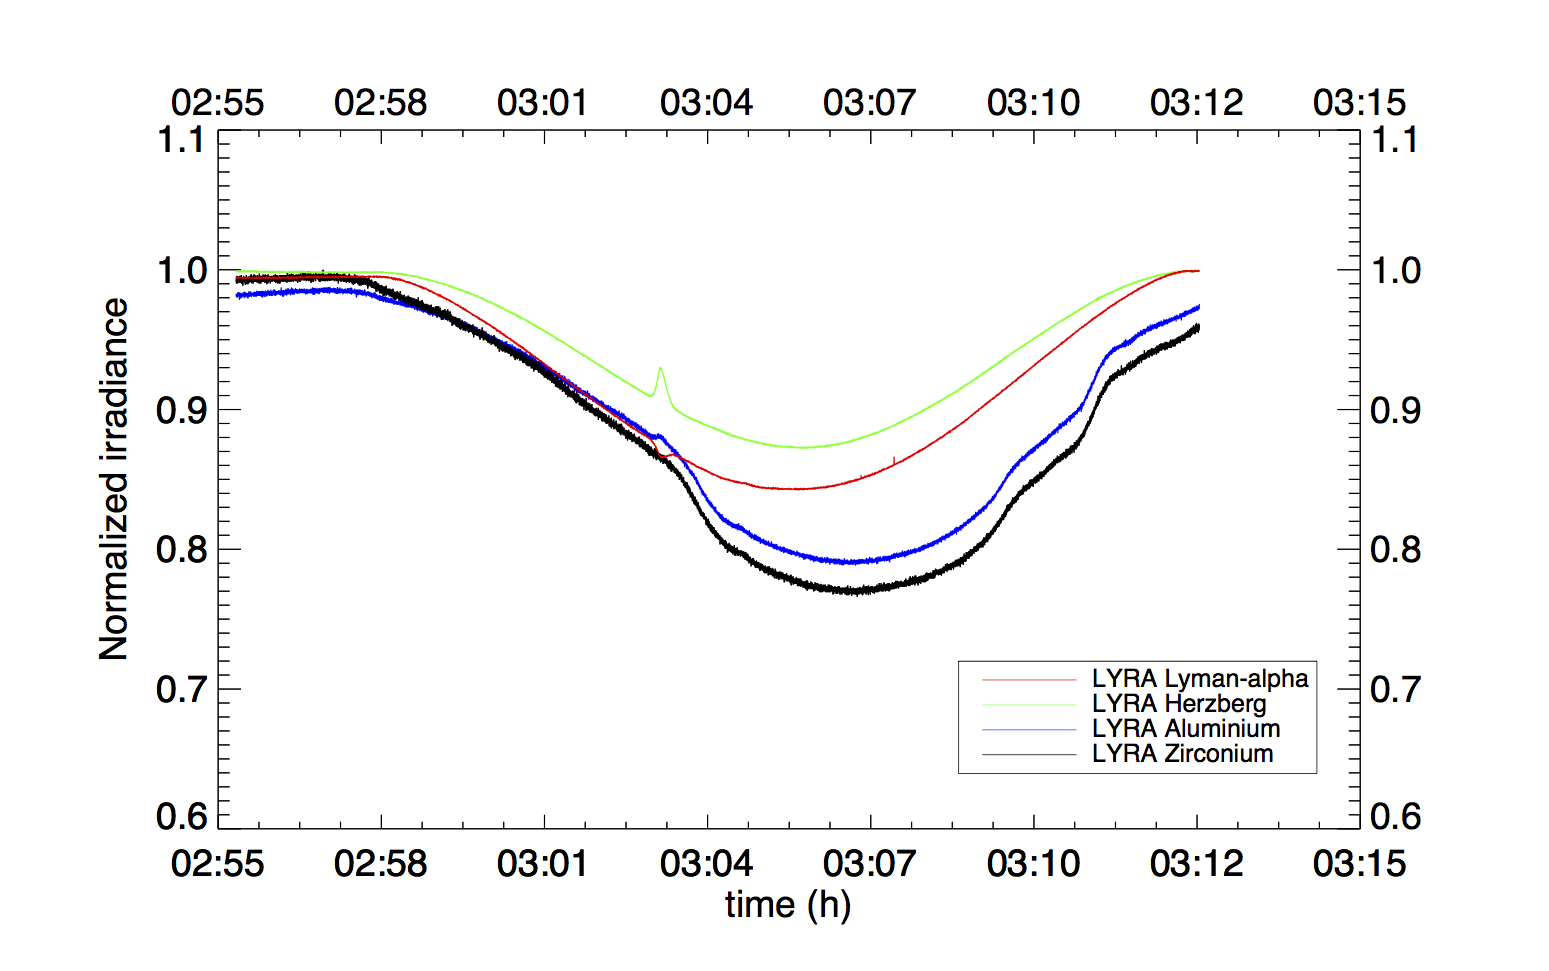
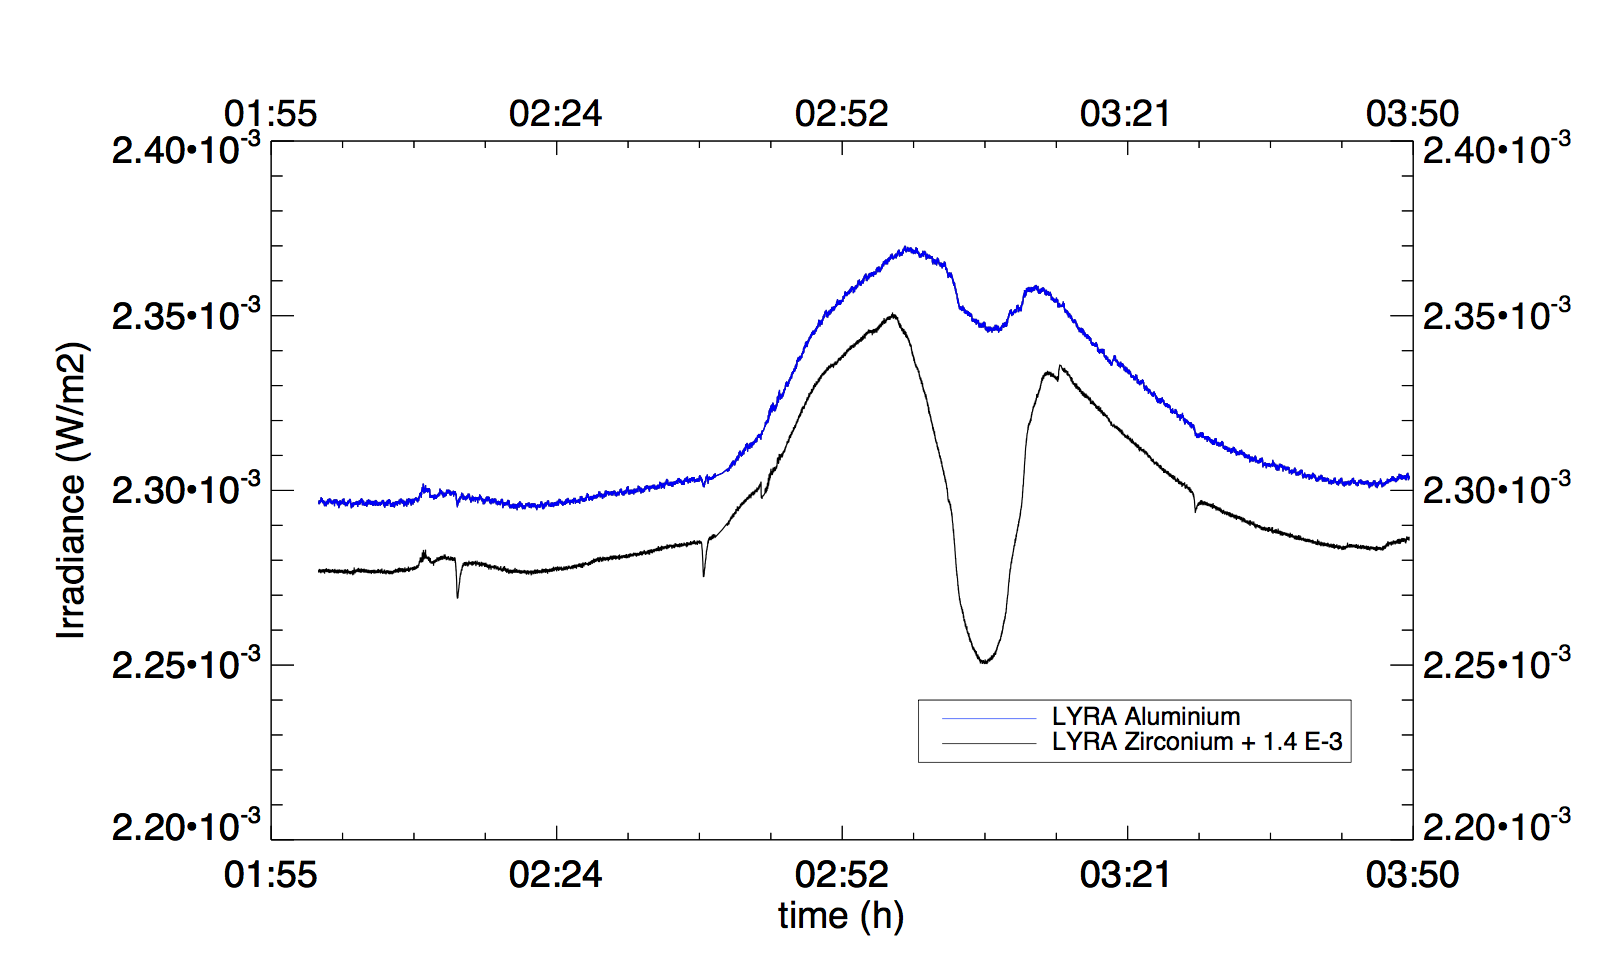
Interestingly, the second transit happened simultaneously to a C1.3 flare, as illustrated below:
Read the whole story on http://proba2.sidc.be/eclipse-march-2016
PROBA2 Observations (29 Feb 2016 - 6 Mar 2016)
Solar Activity
Solar flare activity fluctuated between quiet and low during the week.
In order to view the activity of this week in more detail, we suggest to go to the following website from which all the daily (normal and difference) movies can be accessed: http://proba2.oma.be/ssa
This page also lists the recorded flaring events.
A weekly overview movie can be found here: http://proba2.sidc.be/swap/data/mpg/movies/weekly_movies/weekly_movie_2016_02_29.mp4 (SWAP week 310).
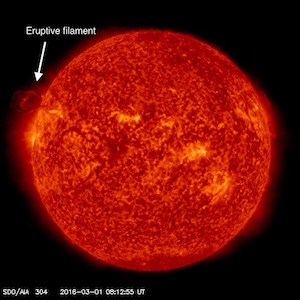
We did not observe any M or X-class flares, and only one C-class flare. The latter was a C1.1 flare produced by NOAA Active Region (AR) 2506 on 2016-Mar-04, peaking at 09:00 UT. On 2016-Mar-01, a filament eruption was observed. Below we provide SWAP images showing these events.
The annotated snapshots of the flare are produced by the Solar Feature Automated Search Tool (SoFAST). This tool detects dynamic solar events in EUV images from SWAP in near real-time. The snapshots illustrate the location of the flare on the solar disk (right) and a zoomed image (left).
The complete SoFAST online event list and additional plots are available at: http://www.sidc.be/sofast.
2016-Mar-04, AR 2506:
C1.1 peaking around 09:00 UT
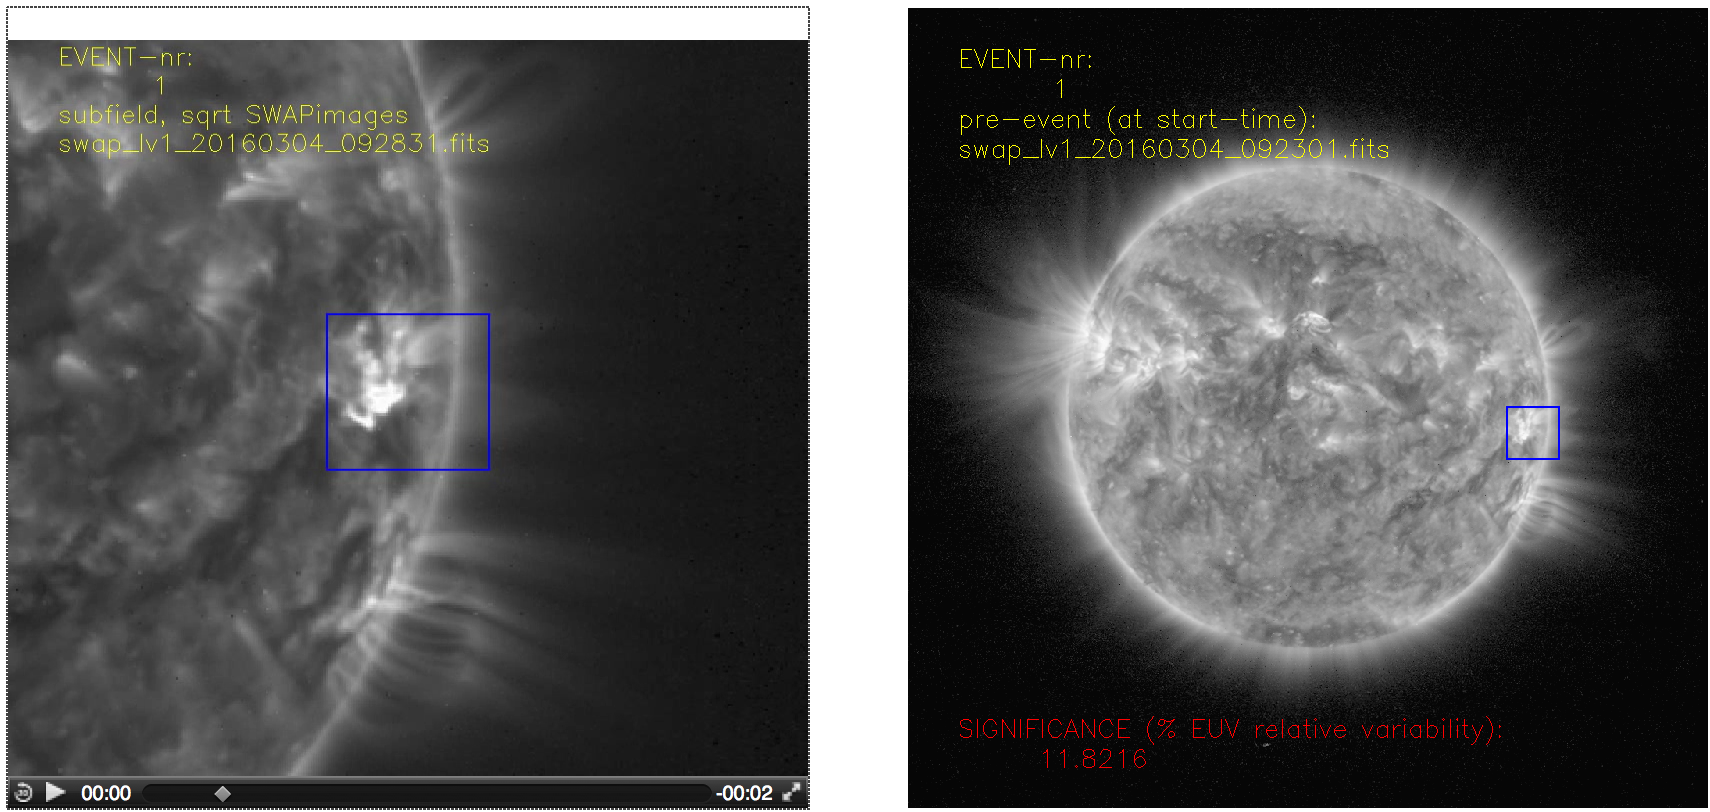
A movie of the event can be found here: http://proba2.sidc.be/swap/data/mpg/movies/20160304_swap_movie.mp4 (SWAP daily movie)
2016-Mar-01:
Filament eruption on North-East quadrant, around 07:45 UT.
Below we provide annotated SWAP images before and after the event.
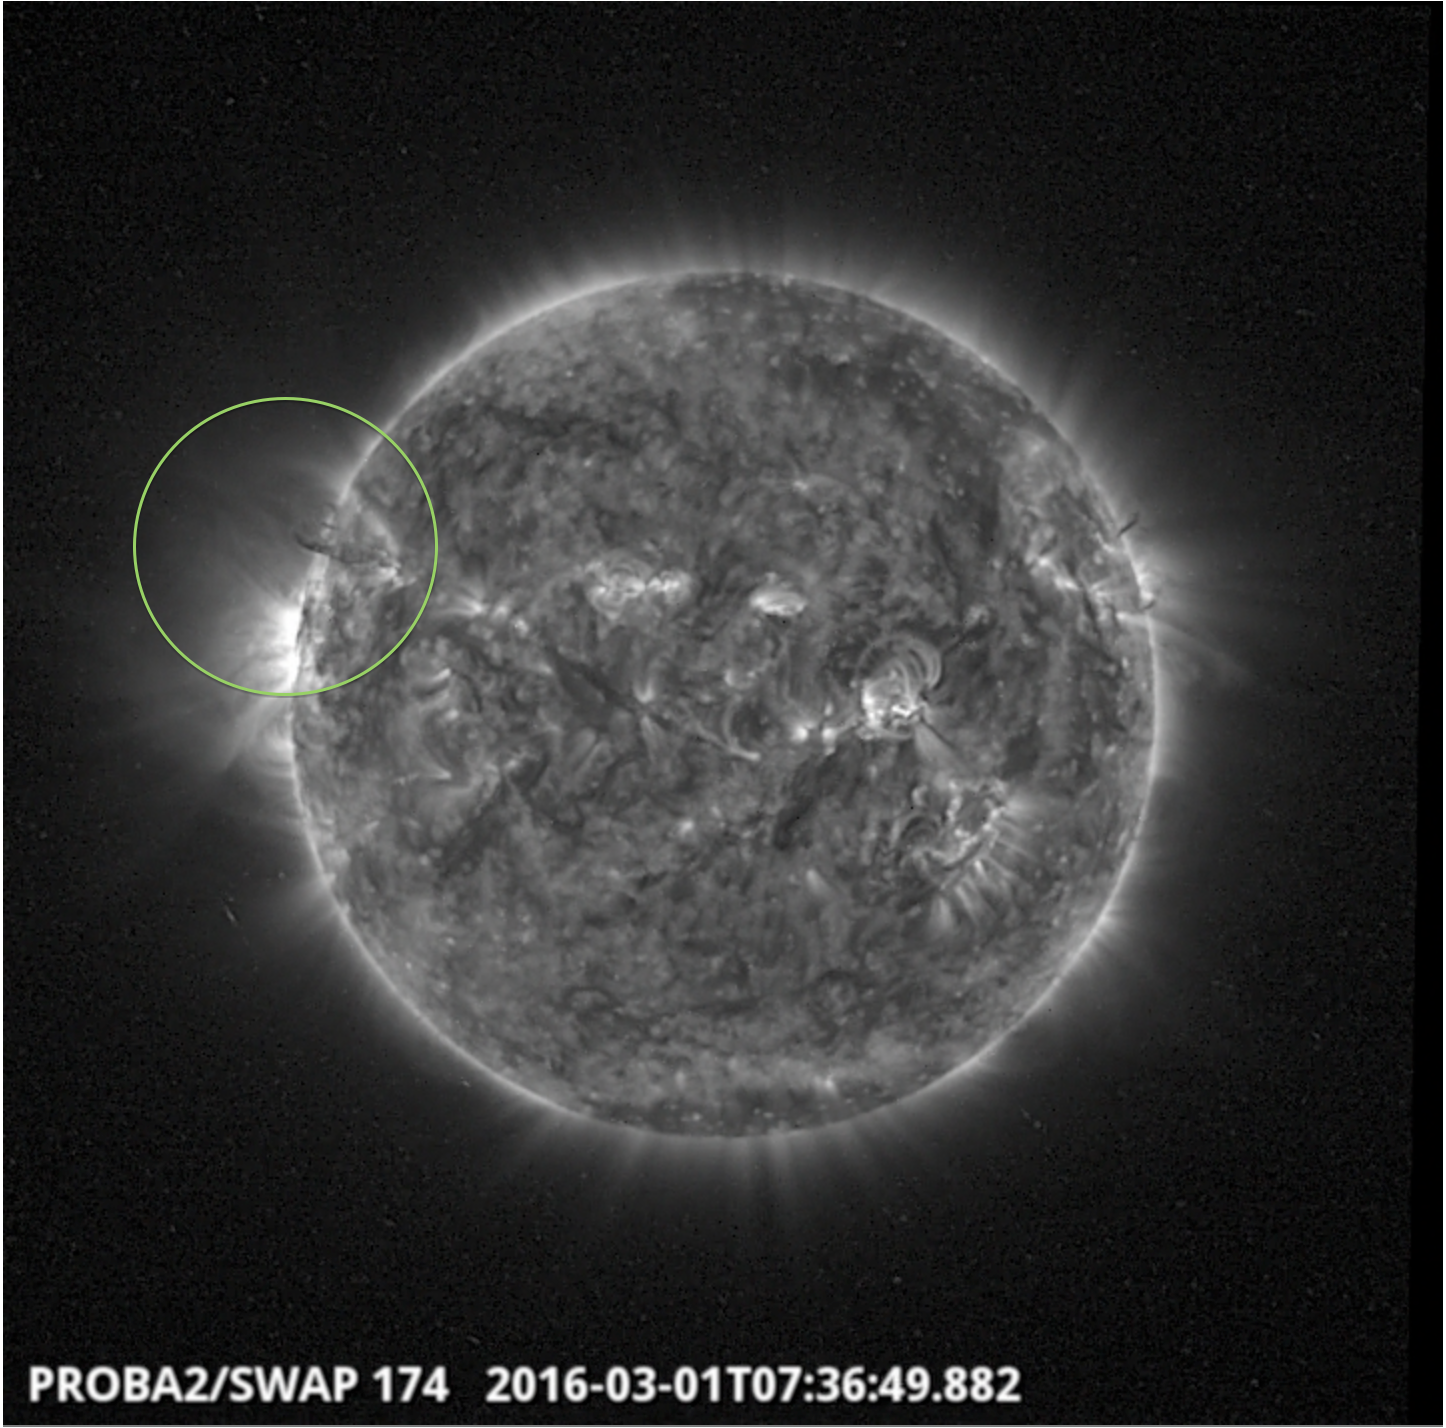
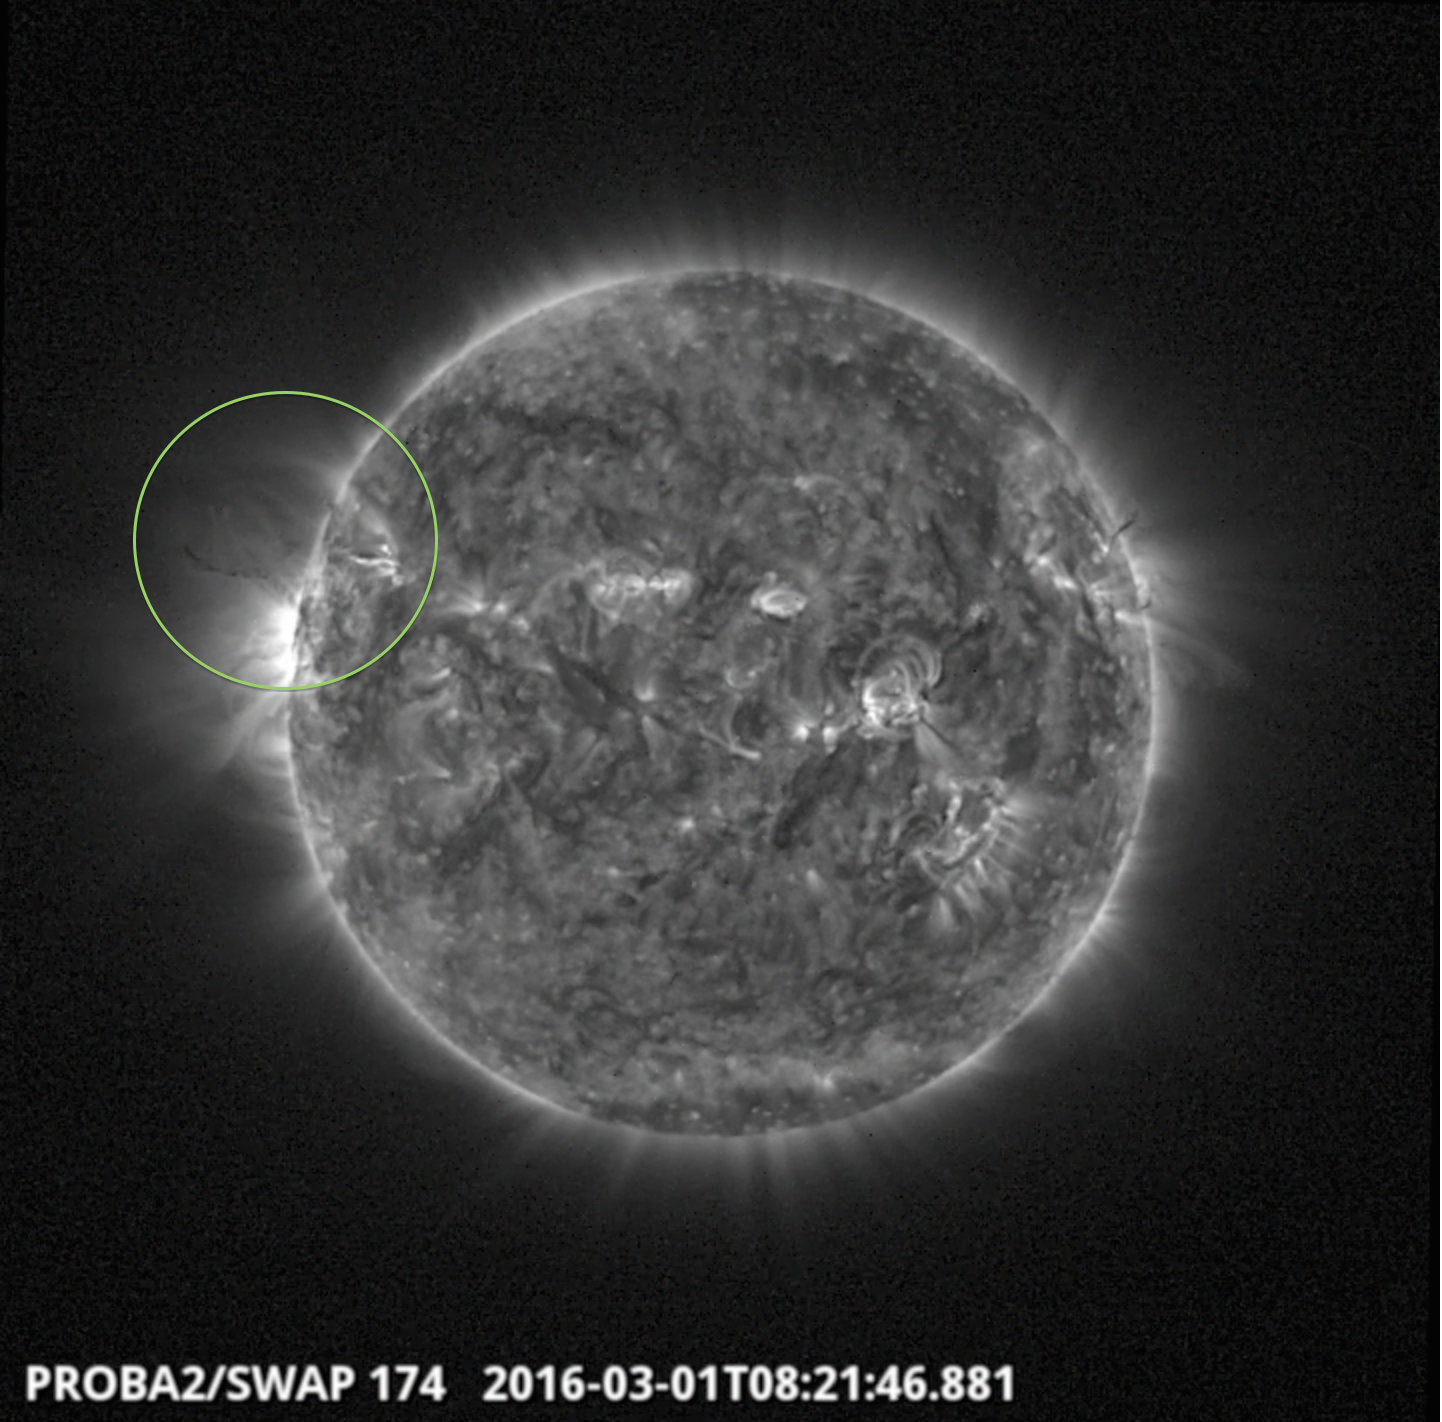
A movie of the event can be found here: http://proba2.sidc.be/swap/data/mpg/movies/20160301_swap_movie.mp4 (SWAP daily movie)
Review of solar activity
Flares
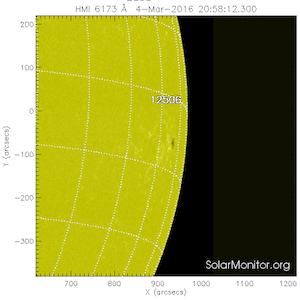
During this week solar activity was very low with only 1 C-class and 18 B-class flares observed by GOES. The C1.1 flare which peaked at 09:00 UT on March 04, originated from the Catania sunspot group 27 (NOAA 2506) at that moment situated close to the west solar limb.
Coronal Mass Ejections
The most significant CME observed this week was the CME associated with the filament eruption from the close to the East solar limb, on March 01. The CME was first seen in the SOHO/LASCO C2 field of view at 08:24 UT, had angular width of about 115 degrees and projected speed of about 500 km/s (as reported by the CACTUS software).
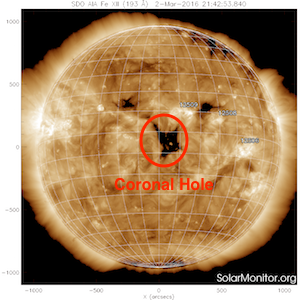
Coronal Hole
The small equatorial coronal hole reached the central meridian in the morning of March 02. The associated fast solar wind was expected at the Earth on March 5.
The International Sunspot Number
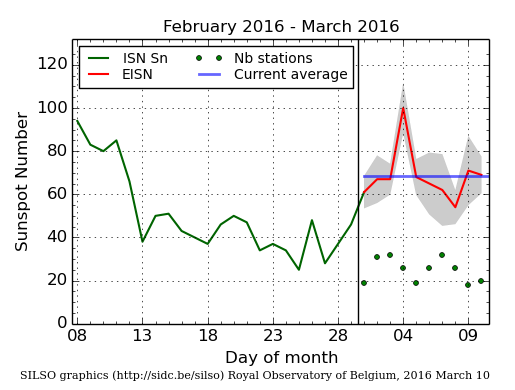
The daily Estimated International Sunspot Number (EISN, red curve with shaded error) derived by a simplified method from real-time data from the worldwide SILSO network. It extends the official Sunspot Number from the full processing of the preceding month (green line). The plot shows the last 30 days (about one solar rotation). The horizontal blue line shows the current monthly average, while the green dots give the number of stations included in the calculation of the EISN for each day.
Review of geomagnetic activity
Solar wind issues
In the early morning of the March 01 the solar wind speed increased rather suddenly (from about 380 to 440 km/s) concurrently with the small but visible increase of the temperature and the interplanetary magnetic field magnitude.
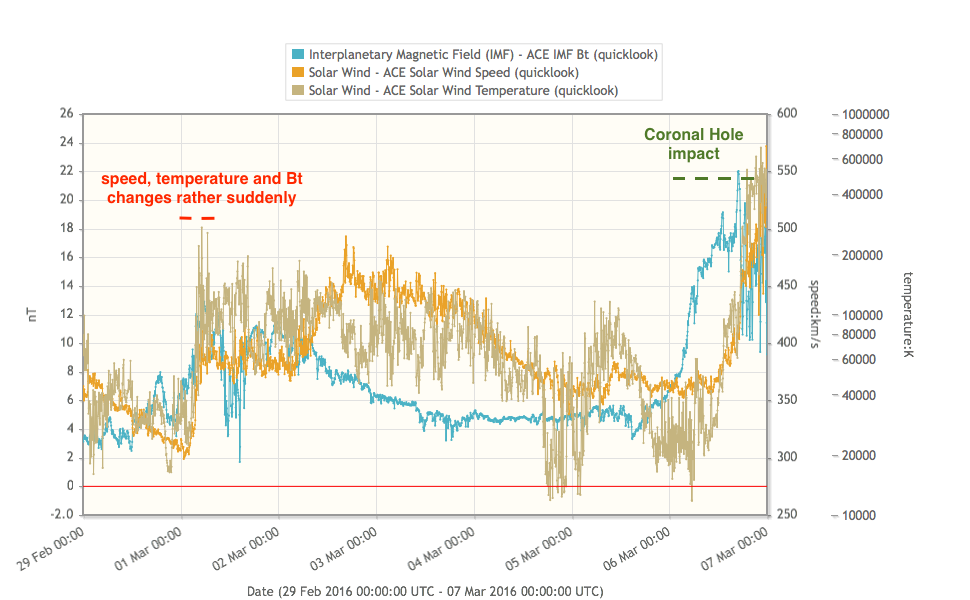
The change of the solar wind speed and other parameters was probably associated with the small equatorial coronal hole, seemingly connected to the northern polar coronal hole, which reached central meridian on February 26.
The arrival of a high speed stream associated with the small equatorial corona hole which reached the central meridian in the morning of March 02 (and most likely an ICME before) caused a geomagnetic storm that started in the evening of March 6.
Geomagnetic effects
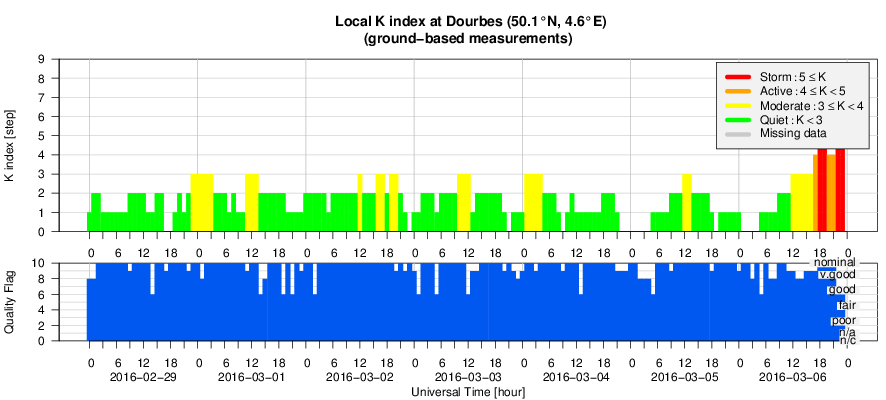
Due to the long interval of the strongly negative value of the Bz component of the interplanetary magnetic field (down to -18 nT), and the concurrent fast solar wind (speed of about 580 km/s) the major geomagnetic storm conditions were reported. Just before the midnight of March 6, the NOAA Kp reached it's maximum value for this storm, amounting to Kp=7 and Dourbes reported K=6. The source of the ICME is not clear, one of the possibility is that it is related to a filament eruption from the East limb on March 01.
During the rest of the week geomagnetic conditions were quiet to unsettled.
Geomagnetic Observations at Dourbes (29 Feb 2016 - 6 Mar 2016)
Review of ionospheric activity (29 Feb 2016 - 6 Mar 2016)
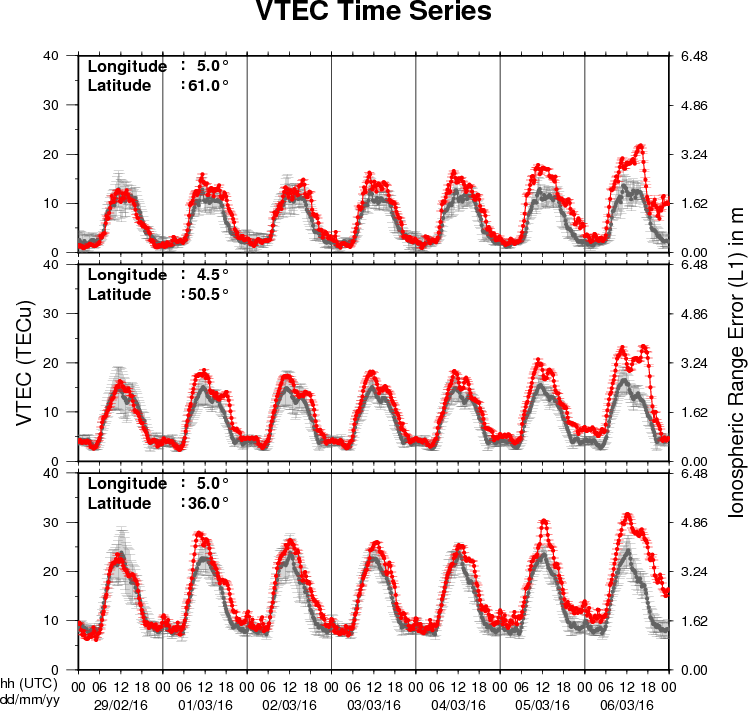
The figure shows the time evolution of the Vertical Total Electron Content (VTEC) (in red) during the last week at three locations:
a) in the northern part of Europe(N61°, 5°E)
b) above Brussels(N50.5°, 4.5°E)
c) in the southern part of Europe(N36°, 5°E)
This figure also shows (in grey) the normal ionospheric behaviour expected based on the median VTEC from the 15 previous days.
The VTEC is expressed in TECu (with TECu=10^16 electrons per square meter) and is directly related to the signal propagation delay due to the ionosphere (in figure: delay on GPS L1 frequency).
The Sun's radiation ionizes the Earth's upper atmosphere, the ionosphere, located from about 60km to 1000km above the Earth's surface.The ionization process in the ionosphere produces ions and free electrons. These electrons perturb the propagation of the GNSS (Global Navigation Satellite System) signals by inducing a so-called ionospheric delay.
See http://stce.be/newsletter/GNSS_final.pdf for some more explanations ; for detailed information, see http://gnss.be/ionosphere_tutorial.php
New documents in the European Space Weather Portal Repository
See http://www.spaceweather.eu/en/repository
STCE - Mini-ijstijd op komst?
Onlangs kopten de kranten: ‘mini-ijstijd op komst!’ Een wetenschapper voorspelde dat het gemiddeld aantal zonnevlekken zou dalen en de zon dus minder actief wordt. Hierdoor zou de komende decennia de temperatuur op aarde globaal gezien dalen.
De zon is helemaal geen statisch, onveranderlijk hemellichaam zoals je wel eens zou kunnen denken. Ze heeft twee seizoenen die elkaar opvolgen: een seizoen waarin de zon eerder kalm is of een zonneminimum en een seizoen waarin de zon heel wat activiteit ten toon spreid of een zonnemaximum. Zo een activiteitencyclus duurt om en bij de 11 jaar. Tijdens een zonneminimum ziet de zonneatmosfeer er meer egaal uit, tijdens een zonnemaximum is haar atmosfeer eerder een kluwen van plaatselijke actieve gebieden die kleine en grote uitbarstingen veroorzaken.
Of de zon actief is of minder actief, kan je beschrijven met het zonnevlekkengetal. Het mooie aan het zonnevlekkengetal is dat we dit eenvoudig kunnen bepalen door letterlijk te tellen hoeveel vlekken aanwezig zijn op de zonneschijf. Een simpele telescoop voldoet. Dit is de reden waarom deze index zo ver teruggaat in de tijd. Systematische waarnemingen van het zonnevlekkengetal zijn beschikbaar vanaf het begin van de 17de eeuw. We hebben dus een uitgebreid archief voor klimaatstudies.
Maar kan je de zonnevlekkencyclus zomaar linken aan het klimaat op aarde? Kan je besluiten dat een mini-ijstijd eraan staat te komen indien blijkt dat de komende cyclus lager is dan de vorigen?
http://www.spaceweather.eu/en/repository/show?id=599