- Table of Content
- 1.NOAA 2529 rema...
- 2.PROBA2 Observa...
- 3.Review of sola...
- 4.Noticeable Sol...
- 5.The Internatio...
- 6.Review of geom...
- 7.Geomagnetic Ob...
- 8.Review of iono...
- 9.Future Events
- 10.New documents ...
2. PROBA2 Observations (18 Apr 2016 - 24 Apr 2016)
3. Review of solar activity
4. Noticeable Solar Events (18 Apr 2016 - 24 Apr 2016)
5. The International Sunspot Number
6. Review of geomagnetic activity
7. Geomagnetic Observations at Dourbes (18 Apr 2016 - 24 Apr 2016)
8. Review of ionospheric activity (18 Apr 2016 - 24 Apr 2016)
9. Future Events
10. New documents in the European Space Weather Portal Repository
NOAA 2529 remains active
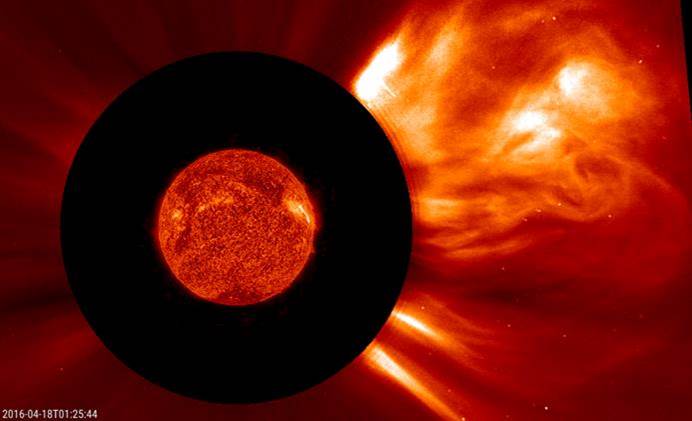
As discussed during last week's news item (http://www.stce.be/news/344/welcome.html ), big sunspot group NOAA 2529 was a relatively quiet region before producing an M6 flare early on 18 April. The coronal mass ejection (CME) associated with this "medium" flare was not directed to Earth. The image underneath combines an extreme ultraviolet (EUV) picture (SDO/AIA 304; http://sdo.gsfc.nasa.gov/data/aiahmi/ ) of the flare close to maximum intensity at 00:25UT, and a coronagraphic image (SOHO/LASCO C2; http://sohowww.nascom.nasa.gov/ ) an hour later at 01:25UT showing the ejection of the particle cloud.
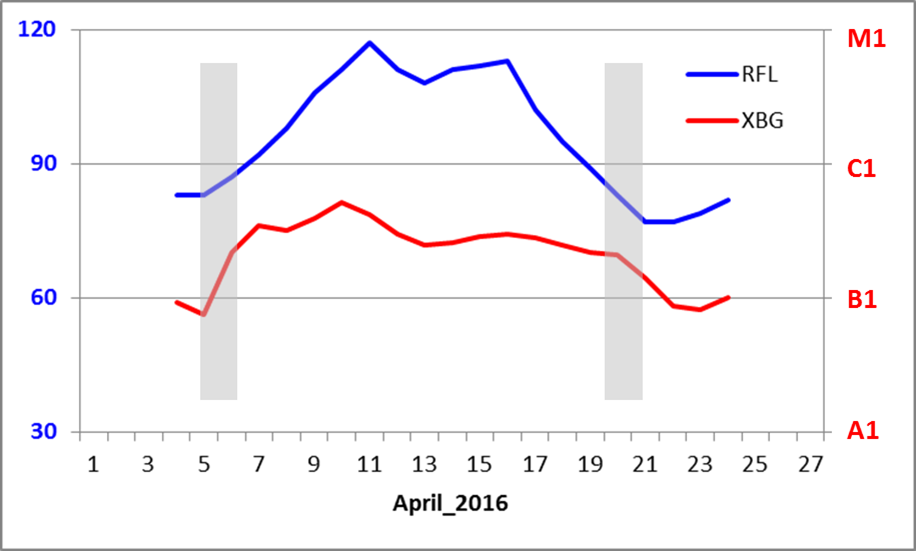
The departure of NOAA 2529 two days later was observed in many solar parameters as the related values quickly dropped to their nominal (low) levels. Two such parameters are the solar radio flux and the solar x-ray background flux, of which data can be found in the weekly SIDC bulletins (http://www.sidc.be/products/bul/ ).
Measurements of the 10.7 cm (2800 MHz) solar radio flux are made by the Dominion Radio Astrophysical Observatory (DRAO) at Penticton (Canada) at local noon (around 20:00UT). The reported values are expressed in solar flux units (sfu; https://en.wikipedia.org/wiki/Solar_flux_unit ) and are not corrected for the variable Sun-Earth distance or any flaring or other eruptive activity.
The x-ray background flux is measured daily in the 0.1 to 0.8 nm range by the GOES spacecraft. It usually is a midday minimum given in terms of the x-ray flare class. There are 5 such classes (A, B, C, M, X), with each class being 10 times stronger than the previous one. A is the weakest class, and C ("common"), M ("medium") and X ("eXtreme", the strongest class) are mostly used for flares.
More info on these parameters can be found in NOAA/SWPC's User Guide at http://www.swpc.noaa.gov/sites/default/files/images/u2/Usr_guide.pdf
The figure underneath shows the evolution of the solar radio flux (RFL; blue) and the x-ray background flux (XBG; red; note the logarithmic scale!) from 4 till 24 April. The presence of NOAA 2529 can readily be deduced from the enhanced radio and x-ray flux. Interestingly, XBG is already enhanced at least a day before the appearance of NOAA 2529, and remained so a day after its rounding the west limb (see the gray bars on 6 and 20 April). The extra enhancement is much less pronounced in the solar radio flux.
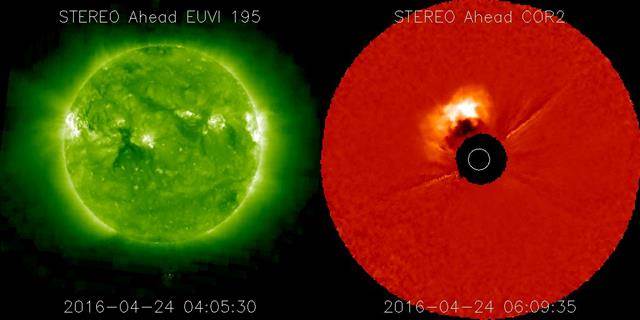
NOAA 2529 is currently transiting the solar backside. It still shows signs of occasionally vigorous activity. A good example of such a strong event occurred just a few days ago, when on 24 April a partial halo CME became visible in SOHO/LASCO coronagraphic imagery. There was no sign of ongoing activity on the earth-facing solar disk, and STEREO-A imagery (http://stereo-ssc.nascom.nasa.gov/ ) from the Sun's backside left no doubt that NOAA 2529 was the culprit. Between 02:00 and 06:00UT, a filament can be seen ejected mainly to the north of this "old" active region. It was associated with a coronal dimming and post-eruption coronal loops. The short movie at https://youtu.be/BRz6fa_a4pM first shows the CME as observed by SOHO/LASCO, and is followed by STEREO-A clips in EUV and coronagraphic observations. It's going to be very interesting to see how active NOAA 2529 still is when it will round the east limb around 3-4 May.
PROBA2 Observations (18 Apr 2016 - 24 Apr 2016)
Solar Activity
Solar flare activity fluctuated between very low and moderate during the week.
In order to view the activity of this week in more detail, we suggest to go to the following website from which all the daily (normal and difference) movies can be accessed:
http://proba2.oma.be/ssa
This page also lists the recorded flaring events.
A weekly overview movie can be found here (SWAP week 317).
http://proba2.oma.be/swap/data/mpg/movies/weekly_movies/weekly_movie_2016_04_18.mp4
Details about some of this week's events, can be found further below.
Monday Apr 18
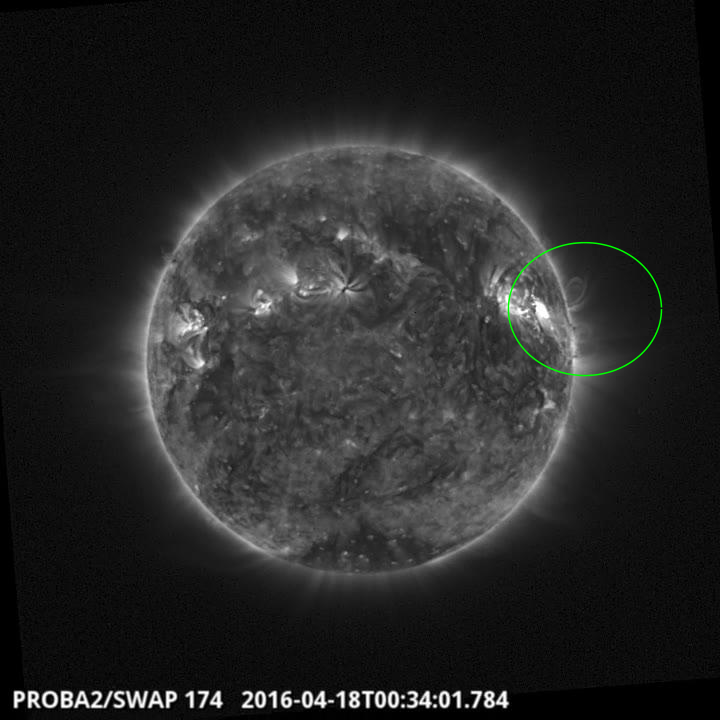
An Mflare was observed by SWAP on the northwest quadrant of the Sun at 15:35 UT on
2016/Mar/18 Find a movie of the events here (SWAP movie)
http://proba2.oma.be/swap/data/mpg/movies/20160418_swap_movie.mp4
Review of solar activity
The week started with an M6.7 flare from Catania group 54 (NOAA active region 2529). The flare peaked at 00:29UT April 18.
Although the region was still on the visible disk at that time, the associated CME (first detected in SoHO/LASCO C2 images around 00:12UT April 18) had a rather restricted angular extent (around 110 degrees), propagated mostly westward off the Sun-Earth line, and hence no impact at Earth was expected. Catania group 54 was at a location favourable for a proton event reaching Earth, but only a very slight increase (below the event threshold) of the 10 MeV proton fluxes was recorded. The region continued to produce several B flares and a single C1 flare as it passed around the solar limb.
Another sunspot group on the solar disk was Catania 59 (NOAA 2532) which dissipated over the week. Later however, renewed flux emergence was seen in that area but the region was mostly inactive. Catania group 60 (NOAA 2533), an unipolar, less interesting spot rotated on the solar disk. The list of sunspot groups was completed with Catania 54 (NOAA 2529).
Near the end of the week, a partial halo CME was recorded (first appearance in SOHO/LASCO C2 images around 4:36UT April 24) which was directed towards the North. Stereo AIA 195 images confirmed that this CME was originating from Catania group 54 (NOAA 2529) at that moment at the far side of the Sun.
Noticeable Solar Events (18 Apr 2016 - 24 Apr 2016)
| DAY | BEGIN | MAX | END | LOC | XRAY | OP | 10CM | TYPE | Cat | NOAA |
| 18 | 0014 | 0029 | 0039 | N12W62 | M6.7 | 1F | 120 | CTM/1III/3II/2IV/2 | 54 | 2529 |
| LOC: approximate heliographic location | TYPE: radio burst type |
| XRAY: X-ray flare class | Cat: Catania sunspot group number |
| OP: optical flare class | NOAA: NOAA active region number |
| 10CM: peak 10 cm radio flux |
The International Sunspot Number
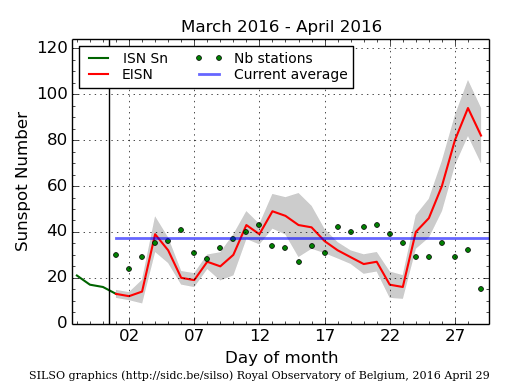
The daily Estimated International Sunspot Number (EISN, red curve with shaded error) derived by a simplified method from real-time data from the worldwide SILSO network. It extends the official Sunspot Number from the full processing of the preceding month (green line). The plot shows the last 30 days (about one solar rotation). The horizontal blue line shows the current monthly average, while the green dots give the number of stations included in the calculation of the EISN for each day.
Review of geomagnetic activity
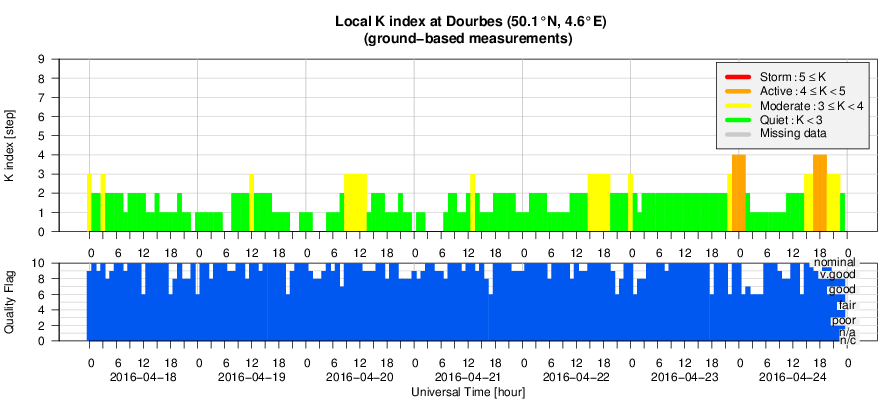
Solar wind conditions were at nominal levels at the start of the week. Earth was located in the positive sector throughout the week. By April 22, we saw the expected arrival of a fast wind stream from a transequatoriaxl extension of a northern polar coronal hole. Solar wind speed reached values around 600km/s late April 22. The high speed stream seemed to decrease rather quickly but later, a renewed gradual enhancement of the solar wind was recorded with speeds reaching around 550 km/s by April 24. In both cases, the total magnetic field enhanced to values around 14nT and 11nT respectively with a variable Bz reaching downward peaks of -11nT and -8nT.
These events led to local active geomagnetic conditions (K Dourbes 4). On the planetary level, a single period of minor storm conditions (Kp 5) was reported by NOAA.
Geomagnetic Observations at Dourbes (18 Apr 2016 - 24 Apr 2016)
Review of ionospheric activity (18 Apr 2016 - 24 Apr 2016)
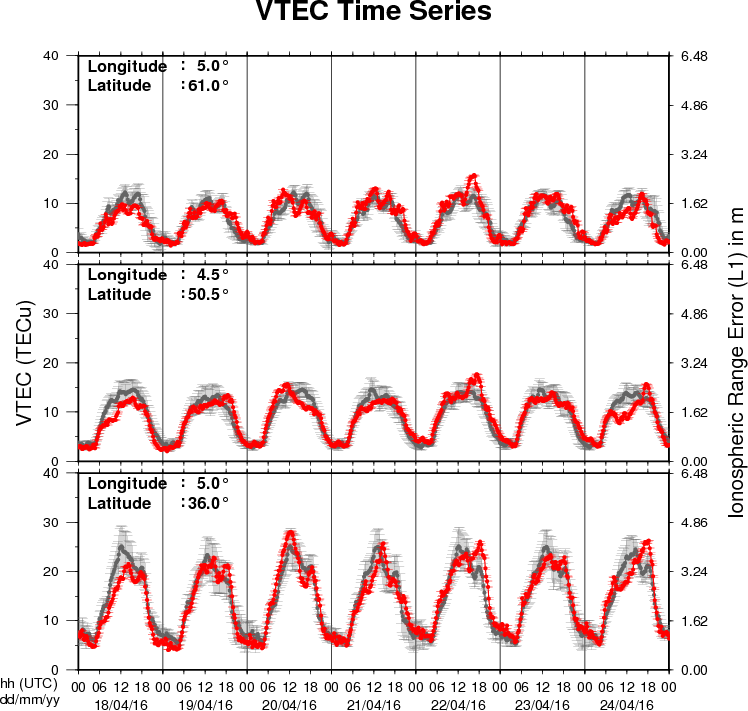
The figure shows the time evolution of the Vertical Total Electron Content (VTEC) (in red) during the last week at three locations:
a) in the northern part of Europe(N61°, 5°E)
b) above Brussels(N50.5°, 4.5°E)
c) in the southern part of Europe(N36°, 5°E)
This figure also shows (in grey) the normal ionospheric behaviour expected based on the median VTEC from the 15 previous days.
The VTEC is expressed in TECu (with TECu=10^16 electrons per square meter) and is directly related to the signal propagation delay due to the ionosphere (in figure: delay on GPS L1 frequency).
The Sun's radiation ionizes the Earth's upper atmosphere, the ionosphere, located from about 60km to 1000km above the Earth's surface.The ionization process in the ionosphere produces ions and free electrons. These electrons perturb the propagation of the GNSS (Global Navigation Satellite System) signals by inducing a so-called ionospheric delay.
See http://stce.be/newsletter/GNSS_final.pdf for some more explanations ; for detailed information, see http://gnss.be/ionosphere_tutorial.php
Future Events
For more details, see http://www.spaceweather.eu/en/event/future
Space Weather REDI Bootcamp
Start : 2016-06-07 - End : 2016-06-17
SW REDI summer Bootcamp is a two-week free training in space
weather, with the first week focusing on the fundamentals of space
weather and the second week on intensive forecaster training, with
alternative opportunities to discuss research topics with the CCMC
and NASA GSFC scientists.
The program is ideal for undergraduate and graduate students
interested in space weather forecasting or in space weather related
research but is also beneficial for scientists, engineers,
educators, mission operators, competitive high school students and
all others seeking to gain some basic knowledge regarding space
weather.
Website:
http://ccmc.gsfc.nasa.gov/support/SWREDI/bootcamp/
The Scientific Foundation of Space Weather
Start : 2016-06-27 - End : 2016-07-01
Website:
http://www.issibern.ch/program/workshops.html
Global Modelling of the Space Weather Chain in Helsinki, Finland
Start : 2016-10-24 - End : 2016-10-28
This event brings together solar, heliospheric, magnetospheric,
and ionospheric communities to discuss the current state and future
challenges in global modelling of the entire space weather chain.
Major developments in forecasting space weather, and understanding
the effects of solar eruptions requires increased communication and
collaboration of these often rather distinct communities. We
welcome submissions from these modelling communities and also
synergetic studies utilising both observations and numerical
models.
Website:
https://pnst.ias.u-psud.fr/sites/pnst/files/global_modelling_space_weather_oct2016.pdf
New documents in the European Space Weather Portal Repository
See http://www.spaceweather.eu/en/repository
STCE - De Zon
This is the theoretical course on the Sun and Spaceweather at the MIRA Solar Observatory in their lecture series for beginning amateur astronomers. Given on 13 April 2016 for 40 attendees.
http://www.spaceweather.eu/en/repository/show?id=600
STCE Annual Report 2014
The STCE Annual Report 2014 is a compilation of the activities done in 2014 within the frame of the Solar-Terrestrial Centre of Excellence (STCE). This report continues the style from the previous editions. Hence, as it is targeting a more general public, it presents only a selection of the 2014-activities in easy-to-digest summaries. These summaries emphasize the intense collaboration between the institutes at the Space Pole, as well as with our external partners. We hope you enjoy this report, which features articles on solar and space weather activity, the Open Doors at the Space Pole, the 11th European Space Weather Week, helmet streamers, a new solar coronagraph, total solar irradiance, the Belgian ALC network, SPENVIS-NG, and much more... Happy reading!
http://www.spaceweather.eu/en/repository/show?id=601