- Table of Content
- 1.Sunspot neighb...
- 2.Review of sola...
- 3.The Internatio...
- 4.PROBA2 Observa...
- 5.Review of geom...
- 6.Geomagnetic Ob...
- 7.Review of iono...
- 8.Future Events
- 9.New documents ...
2. Review of solar activity
3. The International Sunspot Number
4. PROBA2 Observations (11 Jul 2016 - 17 Jul 2016)
5. Review of geomagnetic activity
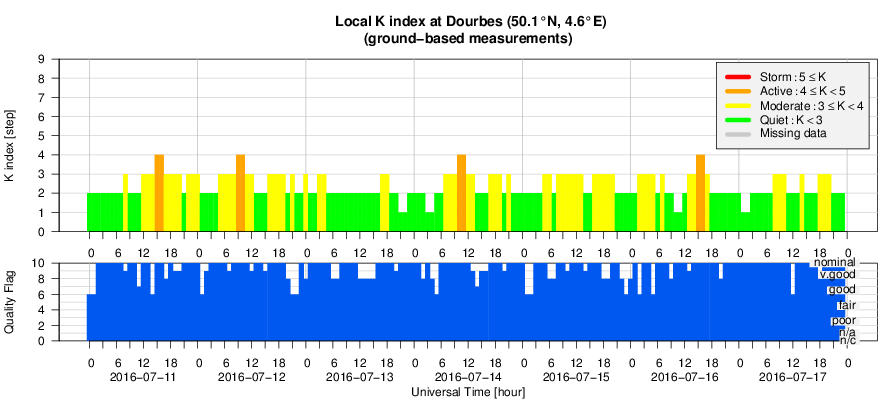
6. Geomagnetic Observations at Dourbes (11 Jul 2016 - 17 Jul 2016)
7. Review of ionospheric activity (11 Jul 2016 - 17 Jul 2016)
8. Future Events
9. New documents in the European Space Weather Portal Repository
Sunspot neighbours
Forecasters seemed to be heading for yet another boring space weather week, when -during the afternoon hours of 14 July- a new sunspot region gradually developed about 70.000 km east of NOAA 2565's main spot. In solar terms, that's like shaking hands with your neighbours! The new "sunspot family" was numbered NOAA 2567, and both groups reached a surface area of nearly twice the surface area of the Earth by the end of the period.

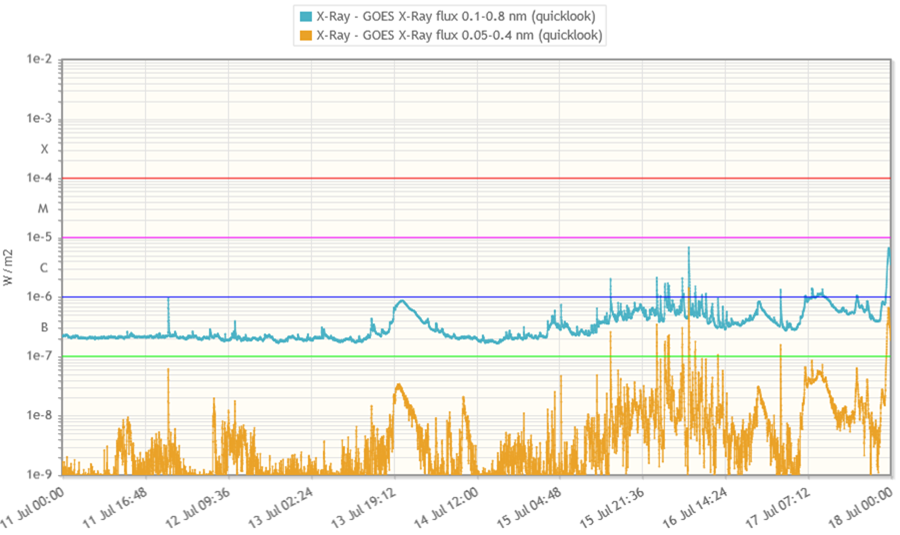
As the new group further matured, it developed a small delta in its trailing portion. This can be seen in the magnetogram underneath, where a negative (inward magnetic field; "blue") island is surrounded by positive (outward magnetic field; "red") magnetic polarity. The situation resulted in numerous C-class flares from NOAA 2567's trailing portion. On 16 July, eleven low-level C-Class flares were recorded in less than 12 hours, with the strongest event a C6.8 flare peaking at 07:04UT. This intense activity doubled the x-ray background flux from B1.7 to B3.5 in just 2 days.
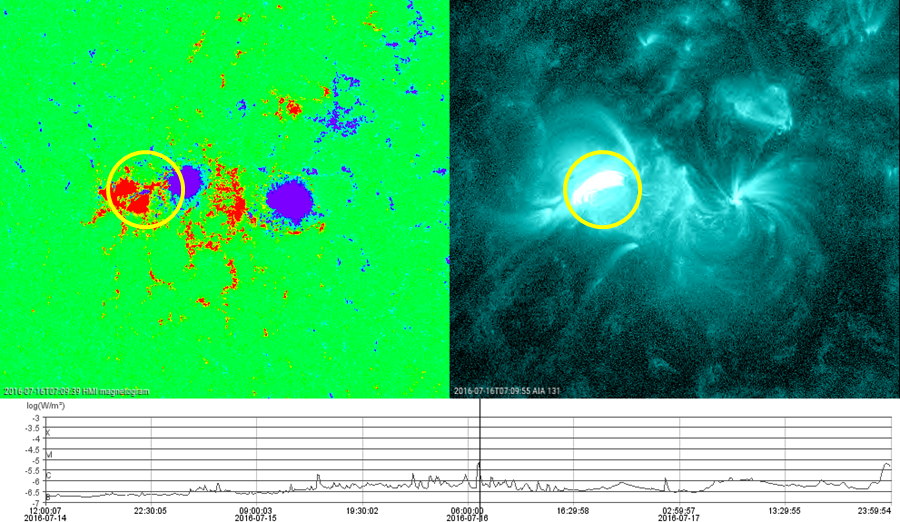
As the delta in NOAA 2567's trailing portion then gradually disappeared, the leading portion of NOAA 2567 started to interact with the -mostly spotless- trailing portion of NOAA 2565. As can be seen in the evolution of the x-ray flux, renewed C-class flaring resulted from this magnetic welcome party, but now with the location of most flares near the magnetic inversion line separating the two active regions and over a wider area. As the sunspot cluster has still a week before having to round the west limb, further modest fireworks can be expected.

A movie of the white light, magnetic and extreme-ultraviolet evolution and interaction of the two sunspot regions can be found at https://youtu.be/ueAXi5pgSHQ The SDO images (http://sdo.gsfc.nasa.gov/data/aiahmi/ ) are accompanied by x-ray flux data from the GOES spacecraft (http://www.swpc.noaa.gov/products/goes-x-ray-flux ), all stitched together using the JHelioviewer software (http://www.jhelioviewer.org/ ).
Review of solar activity
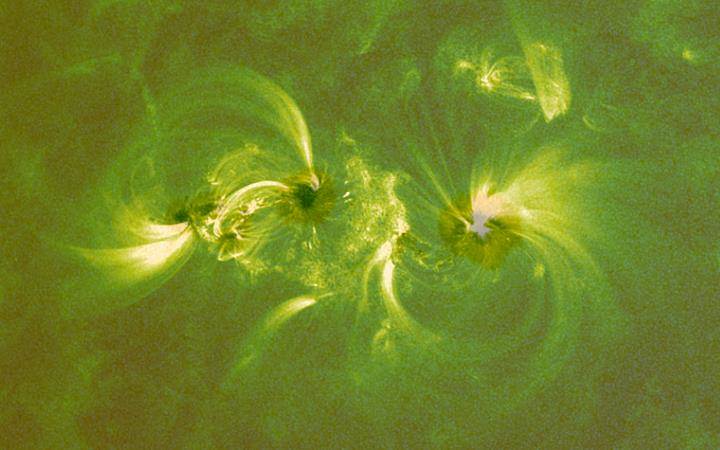
Over the past week, solar activity was low. The largest flare recorded was a C6.8 flare. There were only three significant Active Regions (AR) on the solar disk last week: AR 2564, AR 2565 and AR 2567. They all showed low levels of activity, producing mostly B- and C-class flares. At the start of the week, AR 2565 was the most active, producing several B-class flares. Later in the week, AR 2567 became more active, producing several C-class flares, including the C6.8 class flare peaking at 07:04 UT on 16 July 2016. The image underneath shows coronal loops in extreme ultraviolet (green ; SDO/AIA 171) overlaid on a white light image (SDO/HMI) of the NOAA 2565-NOAA 2567 sunspot complex on 16 July at 07:45UT.
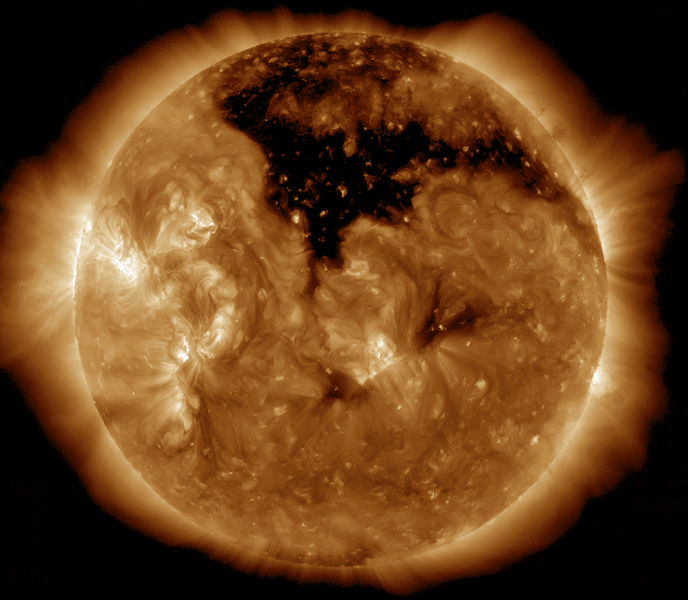
Solar protons have remained at background levels over the past week. No earth-directed or significant coronal mass ejections (CMEs) were detected last week. A large positive polarity trans-equatorial northern polar coronal hole moved from central longitudes to the western hemisphere limb throughout the week.
The International Sunspot Number
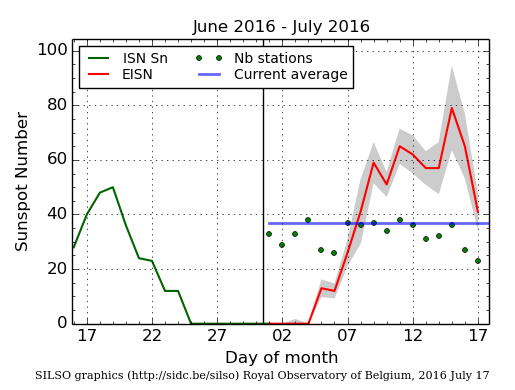
The daily Estimated International Sunspot Number (EISN, red curve with shaded error) derived by a simplified method from real-time data from the worldwide SILSO network. It extends the official Sunspot Number from the full processing of the preceding month (green line). The plot shows the last 30 days (about one solar rotation). The horizontal blue line shows the current monthly average, while the green dots give the number of stations included in the calculation of the EISN for each day.
PROBA2 Observations (11 Jul 2016 - 17 Jul 2016)
Solar Activity
Solar flare activity fluctuated between very low and low during the week.
In order to view the activity of this week in more detail, we suggest to go to the following website from which all the daily (normal and difference) movies can be accessed: http://proba2.oma.be/ssa
This page also lists the recorded flaring events.
A weekly overview movie can be found here (SWAP week 329). http://proba2.oma.be/swap/data/mpg/movies/weekly_movies/weekly_movie_2016_07_11.mp4
Details about some of this week’s events, can be found further below.
Wednesday Jul 13
If any of the linked movies are unavailable they can be found in the P2SC movie repository here
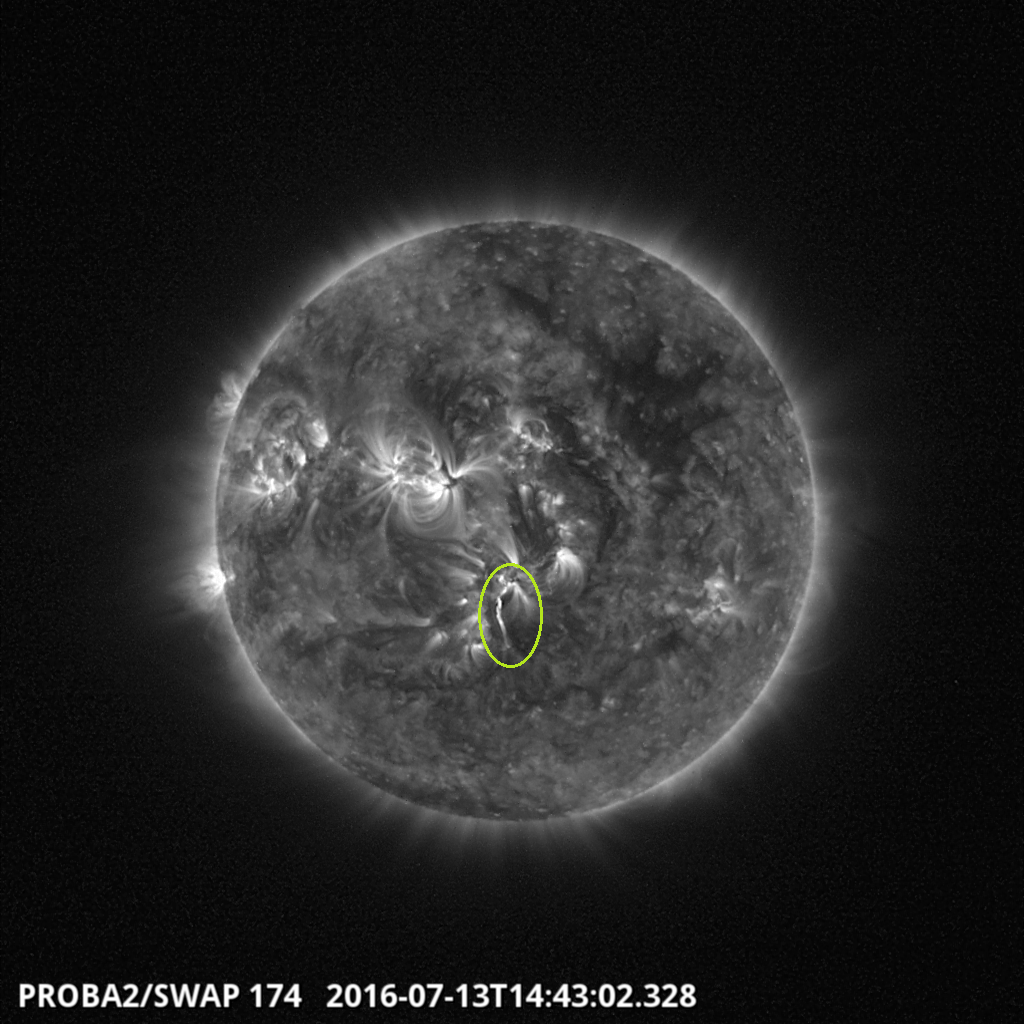
Bursty outflows followed by an eruption at South Central Meridian 14:43 - SWAP image
Find a movie of the event here (SWAP movie) http://proba2.oma.be/swap/data/mpg/movies/20160713_swap_movie.mp4
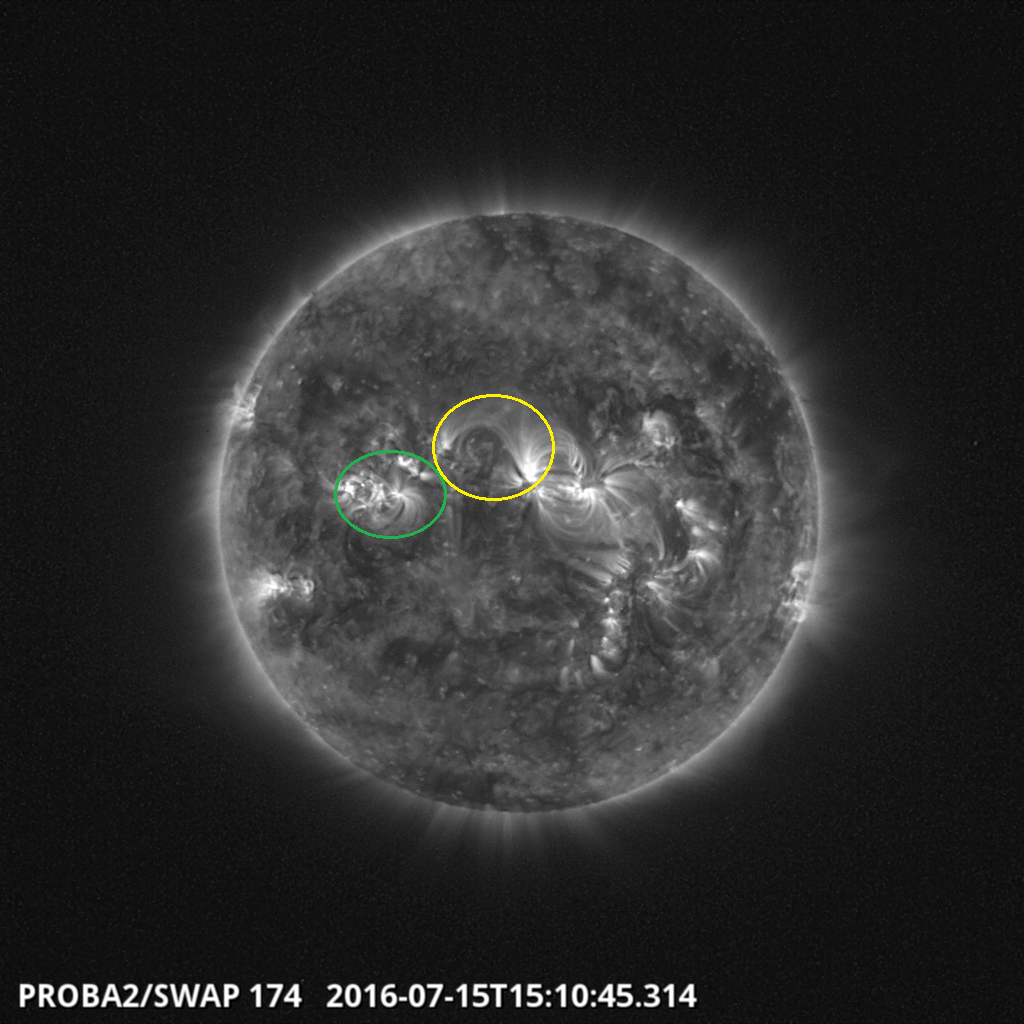
Several B and a few C flares occurred on the North East part of the Sun (NOAA 2567-2565). C-class flaring continued in these regions on Jul 16 and 17. A magnetic interconnection is also visible between the 2564 sunspot group and an unlabeled region, this loop was visible during the entire week - SWAP image
Find a movie of the event here (SWAP movie) http://proba2.oma.be/swap/data/mpg/movies/20160715_swap_movie.mp4
Review of geomagnetic activity
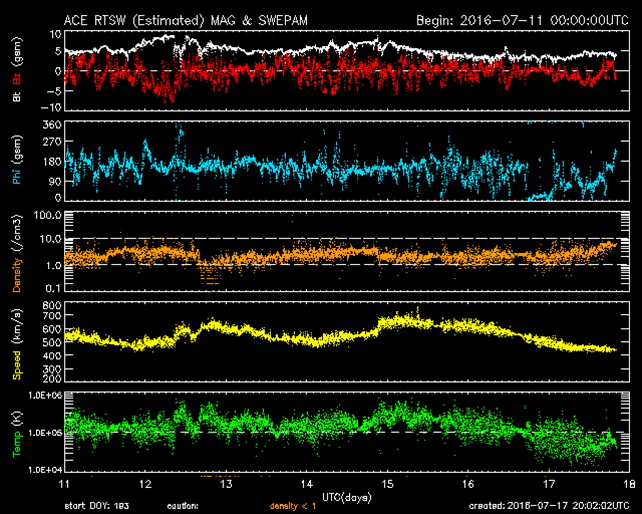
The solar wind speed (yellow curve) has fluctuated between 400 and 700 km/s over the past week. The total magnetic field strength (white curve) has fluctuated between 5 and 10 nT peaking on 12 July 2016. The Bz component (red curve) fluctuated between -8 and +5 nT. Geomagnetic conditions ranged between Kp index 1-5 (NOAA) and local K index 1-4 (Dourbes) over the past week, but remained largely around the 2 and 3 levels. A large northern polar coronal hole began the week in the central longitudes, and slowly rotated across the western hemisphere onto the western limb. The associated high-speed stream (HSS) increased solar wind speeds towards the end of the week, but did not create any significant geomagnetic activity.
Geomagnetic Observations at Dourbes (11 Jul 2016 - 17 Jul 2016)
Review of ionospheric activity (11 Jul 2016 - 17 Jul 2016)
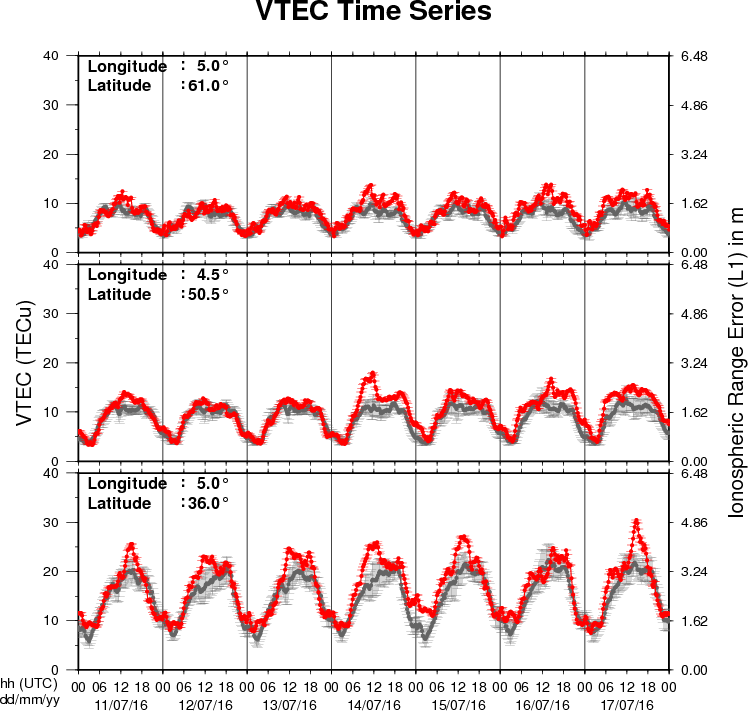
The figure shows the time evolution of the Vertical Total Electron Content (VTEC) (in red) during the last week at three locations:
a) in the northern part of Europe(N61°, 5°E)
b) above Brussels(N50.5°, 4.5°E)
c) in the southern part of Europe(N36°, 5°E)
This figure also shows (in grey) the normal ionospheric behaviour expected based on the median VTEC from the 15 previous days.
The VTEC is expressed in TECu (with TECu=10^16 electrons per square meter) and is directly related to the signal propagation delay due to the ionosphere (in figure: delay on GPS L1 frequency).
The Sun's radiation ionizes the Earth's upper atmosphere, the ionosphere, located from about 60km to 1000km above the Earth's surface.The ionization process in the ionosphere produces ions and free electrons. These electrons perturb the propagation of the GNSS (Global Navigation Satellite System) signals by inducing a so-called ionospheric delay.
See http://stce.be/newsletter/GNSS_final.pdf for some more explanations ; for detailed information, see http://gnss.be/ionosphere_tutorial.php
Future Events
For more details, see http://www.spaceweather.eu/en/event/future
Global Modelling of the Space Weather Chain in Helsinki, Finland
Start : 2016-10-24 - End : 2016-10-28
This event brings together solar, heliospheric, magnetospheric,
and ionospheric communities to discuss the current state and future
challenges in global modelling of the entire space weather chain.
Major developments in forecasting space weather, and understanding
the effects of solar eruptions requires increased communication and
collaboration of these often rather distinct communities. We
welcome submissions from these modelling communities and also
synergetic studies utilising both observations and numerical
models.
Website:
https://pnst.ias.u-psud.fr/sites/pnst/files/global_modelling_space_weather_oct2016.pdf
European Space Weather Week in Ostend, Belgium
Start : 2016-11-14 - End : 2016-11-18
The ESWW is the main annual event in the European Space Weather
calendar. It is the European forum for Space Weather as proven by
the high attendance to the past editions. The agenda will be
composed of plenary/parallel sessions, working meetings and
dedicated events for service end-users. The ESWW will again adopt
the central aim of bringing together the diverse groups in Europe
working on different aspects of Space Weather.
Website:
http://www.stce.be/esww13/
Solar Orbiter Workshop 7: Exploring the solar environs in Granada, Spain
Start : 2017-04-03 - End : 2017-04-06
This event will be hosted by the Instituto de Astrofisica de
Andalucia - CSIC. Please mind that on April 7th the 20th SWT
meeting will take place at the same venue.
Website: Unkown