- Table of Content
- 1.Return of the ...
- 2.PROBA2 Observa...
- 3.Review of sola...
- 4.The Internatio...
- 5.Review of geom...
- 6.Geomagnetic Ob...
- 7.Review of iono...
- 8.Future Events
- 9.New documents ...
2. PROBA2 Observations (19 Sep 2016 - 25 Sep 2016)
3. Review of solar activity
4. The International Sunspot Number
5. Review of geomagnetic activity
6. Geomagnetic Observations at Dourbes (19 Sep 2016 - 25 Sep 2016)
7. Review of ionospheric activity (19 Sep 2016 - 25 Sep 2016)
8. Future Events
9. New documents in the European Space Weather Portal Repository
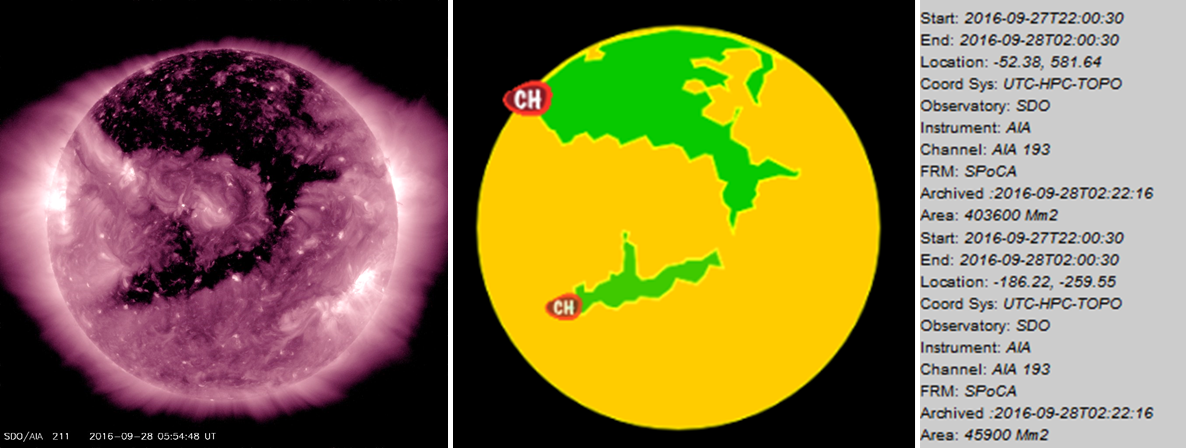
Return of the Behemoth
A huge trans-equatorial coronal hole (CH) is transiting the solar disk. According to the latest data from LMSAL/SPOCA (http://sdowww.lmsal.com/suntoday_v2/index.html?suntoday_date=2016-09-28 ; 28 September), the total coronal hole area is the equivalent of about 880 times the total surface area of the Earth. It is by far the largest CH since the last solar cycle maximum, even dwarfing the large southern polar CH from late 2014 - early 2015 (see the 2014 highlights at http://www.stce.be/news/288/welcome.html ).
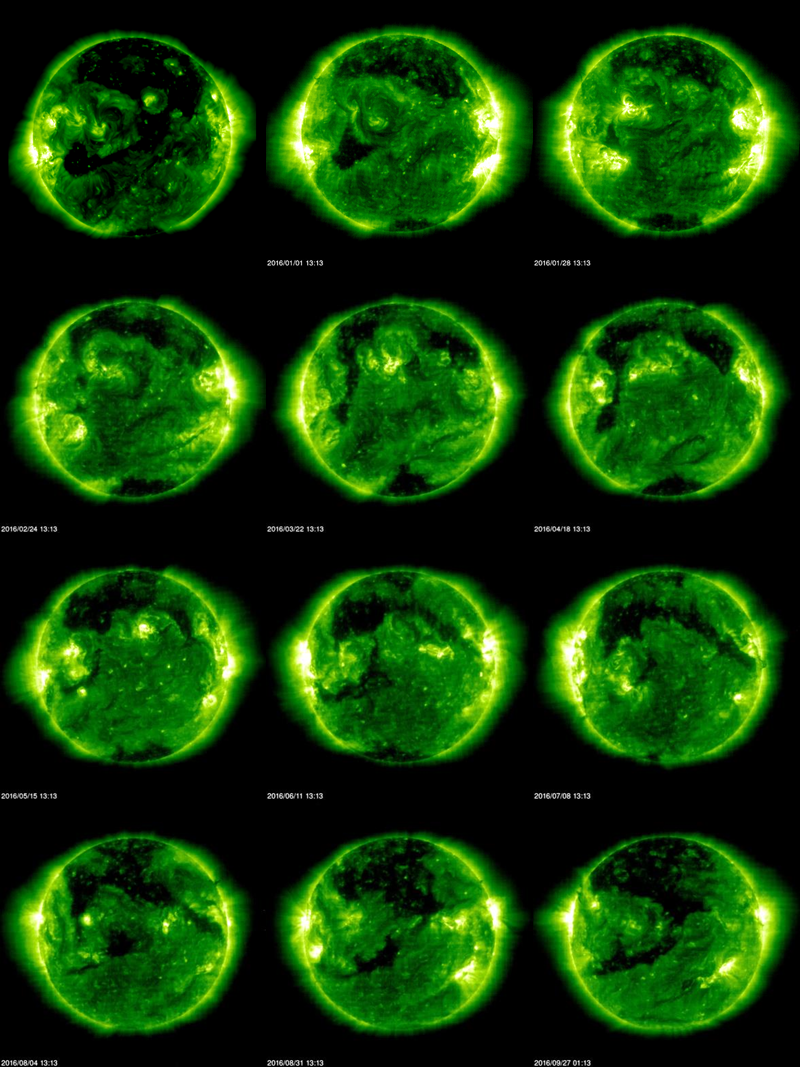
This coronal hole has been around for quite a while now, and has been showing a considerable variation in size and outlook. The main part started to grow from the northern solar pole already during the summer months of 2015, then gradually developing some equatorwards extensions and interacting with more fleeting, smaller equatorial CHs. This can be seen in the collage underneath showing an extreme ultraviolet image of the Sun made by SOHO/EIT 195 (http://sohowww.nascom.nasa.gov/data/realtime-images.html ). It spans the period from 5 December 2015 till 27 September 2016, with one image every 27 days (Bartels solar rotation: see http://wso.stanford.edu/words/Coordinates.html ). It also shows how the first few months of 2016, the full extent of the CH is somewhat hidden as the Sun's north pole is turned away from the Earth. Then, starting the summer months, the north pole is gradually turning again towards Earth showing the behemoth CH in all its glory. Notice also the similarity in outlook between the December 2015 and September 2016 images, and the changes in between.
The changing appearance of the CH also explains the varying geomagnetic influence that the associated wind speed streams have, both in starting time, duration and intensity. This can be seen in the graph underneath, running from 1 January 2015 (top left) till 27 September 2016 (last colored square). For each day, it displays the maximum recorded 3-hour Kp index (see http://www.stce.be/news/243/welcome.html for more information) as obtained from the Kyoto World Data Centre (http://wdc.kugi.kyoto-u.ac.jp/wdc/Sec3.html ), with preliminary data from NOAA/SWPC (http://www.swpc.noaa.gov/products/planetary-k-index ) for the second half of September 2016. Days with quiet to unsettled geomagnetic conditions got a green colored square, active days an orange square, and minor to major storming levels are indicated by red squares. The purple squares represent the two strongest storms so far this solar cycle on 17 March and 22-23 June 2015 (severe storming), both caused by coronal mass ejections (CMEs). The data are again depicted in series of 27 days (Bartels rotation), with the start day indicated on the left. The black line in the middle reflects the transition from 2015 to 2016.
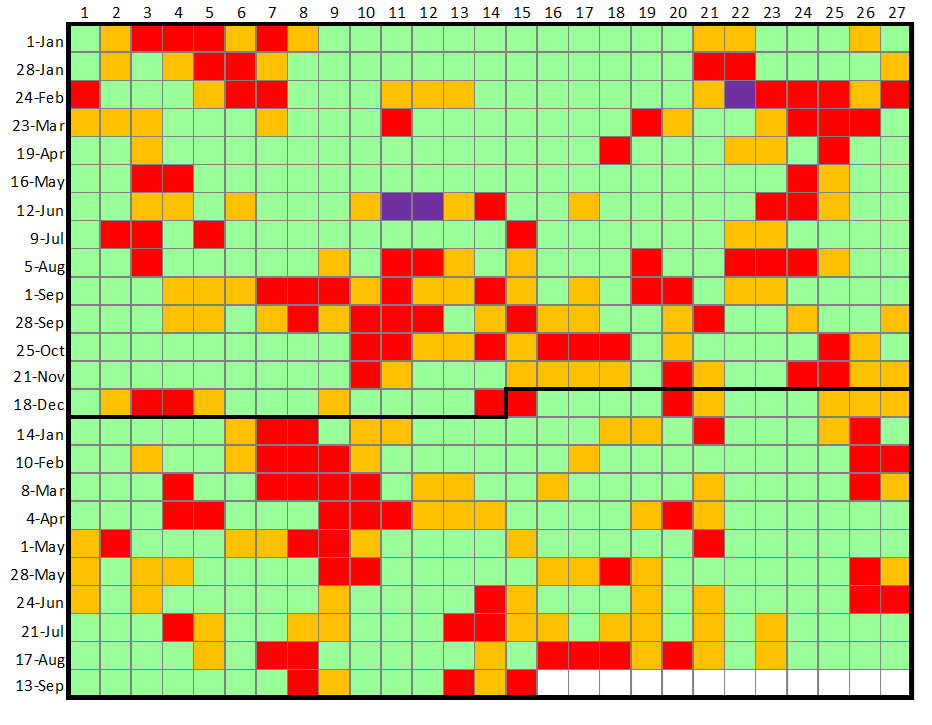
As expected from the above analysis, the influence of the CH wind stream is indeed not a nice reoccuring event starting every 27 days on the same day, or having the same duration and intensity. For example, the December 2015 transit gave only rise to active geomagnetic conditions. Then, for several months, no geomagnetic disturbance at all was detected from this CH (the 1 January storm was due to a CME). Starting during the summer months, as the CH was widening and gradually being inclined again towards Earth, first active conditions were recorded giving gradually way to geomagnetic storming that lasted for several days. This is also the case during this transit, with several days of geomagnetic storming observed and moderate storm levels reached on 27 September. Disturbed geomagnetic conditions are expected to continue for the next few days.
PROBA2 Observations (19 Sep 2016 - 25 Sep 2016)
Solar Activity
Solar flare activity fluctuated between very low and low during the week.
In order to view the activity of this week in more detail, we suggest to go to the following website from which all the daily (normal and difference) movies can be accessed: http://proba2.oma.be/ssa
This page also lists the recorded flaring events.
A weekly overview movie can be found here (SWAP week 339).
proba2.oma.be/swap/data/mpg/movies/weekly_movies/weekly_movie_2016_09_19.mp4
Details about some of this week’s events, can be found further below.
If any of the linked movies are unavailable they can be found in the P2SC movie repository here
http://proba2.oma.be/swap/data/mpg/movies/
Thursday Sep 22
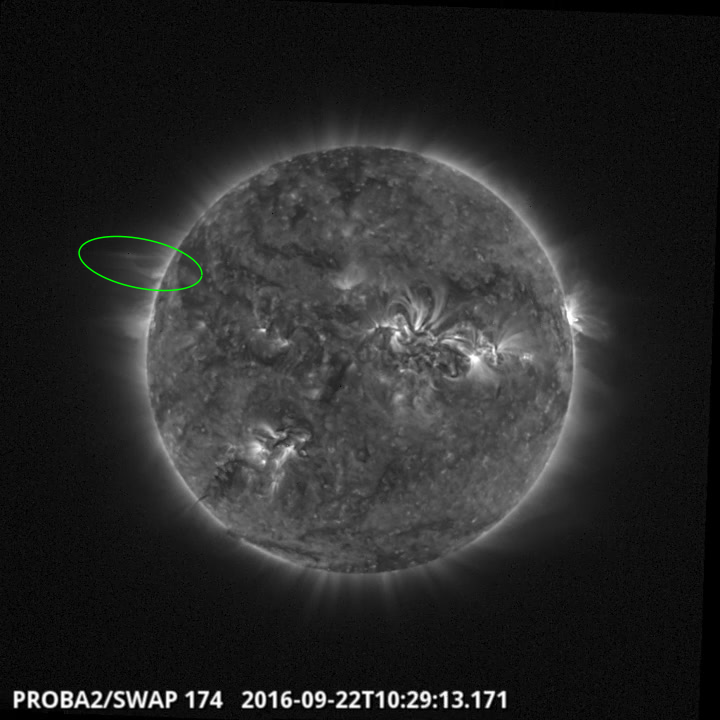
An eruption was observed by SWAP on the east limb of the Sun on 2016-Sep-22 at 10:29 UT
Find a movie of the event here (SWAP movie)
http://proba2.oma.be/swap/data/mpg/movies/20160922_swap_movie.mp4
Friday Sep 23
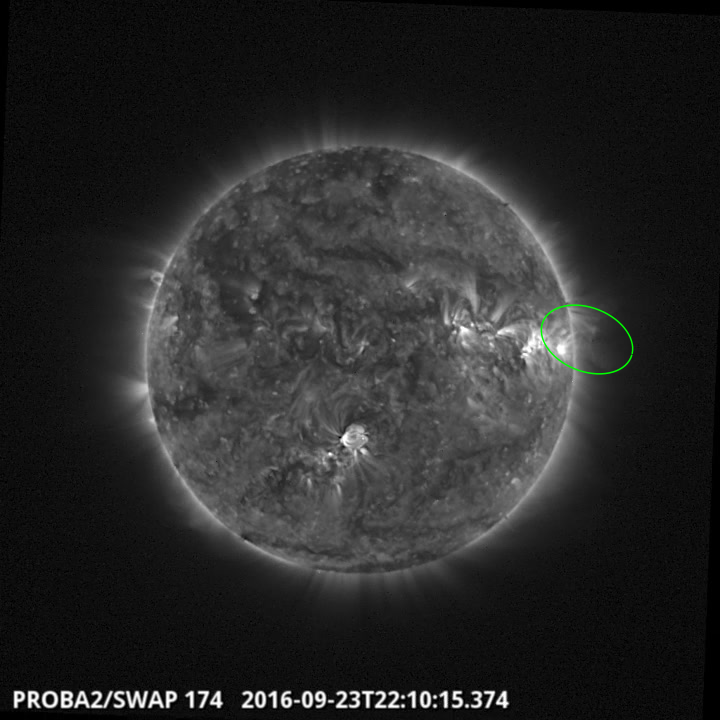
An eruption was observed by SWAP on the west limb of the Sun on 2016-Sep-23 at 22:10 UT
Find a movie of the event here (SWAP movie)
http://proba2.oma.be/swap/data/mpg/movies/20160923_swap_movie.mp4
Review of solar activity
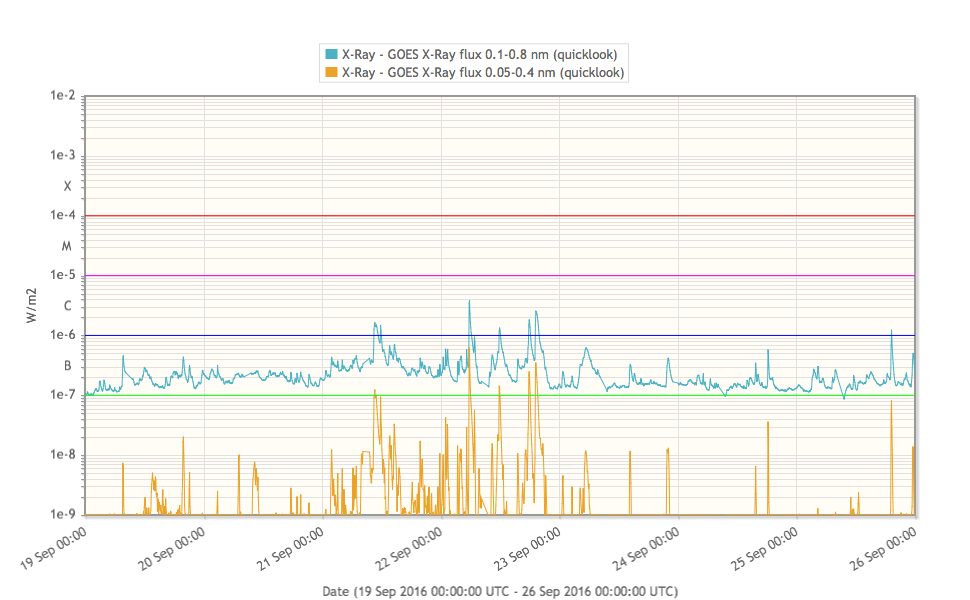
The Sun released 8 C flares during this week. Most of the week was very quiet, with the GOES X ray background at low B level. Apart from a low C flare from beta region NOAA AR 2593 on September 21, all C flares till September 24 were produced by beta region 2595. On September 25, beta-gamma region 2597 produced a low C flare.
The International Sunspot Number
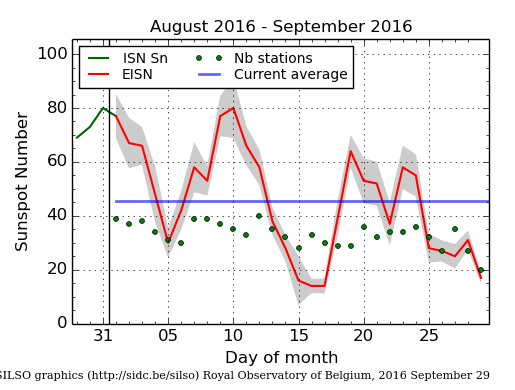
The daily Estimated International Sunspot Number (EISN, red curve with shaded error) derived by a simplified method from real-time data from the worldwide SILSO network. It extends the official Sunspot Number from the full processing of the preceding month (green line). The plot shows the last 30 days (about one solar rotation). The horizontal blue line shows the current monthly average, while the green dots give the number of stations included in the calculation of the EISN for each day.
Review of geomagnetic activity
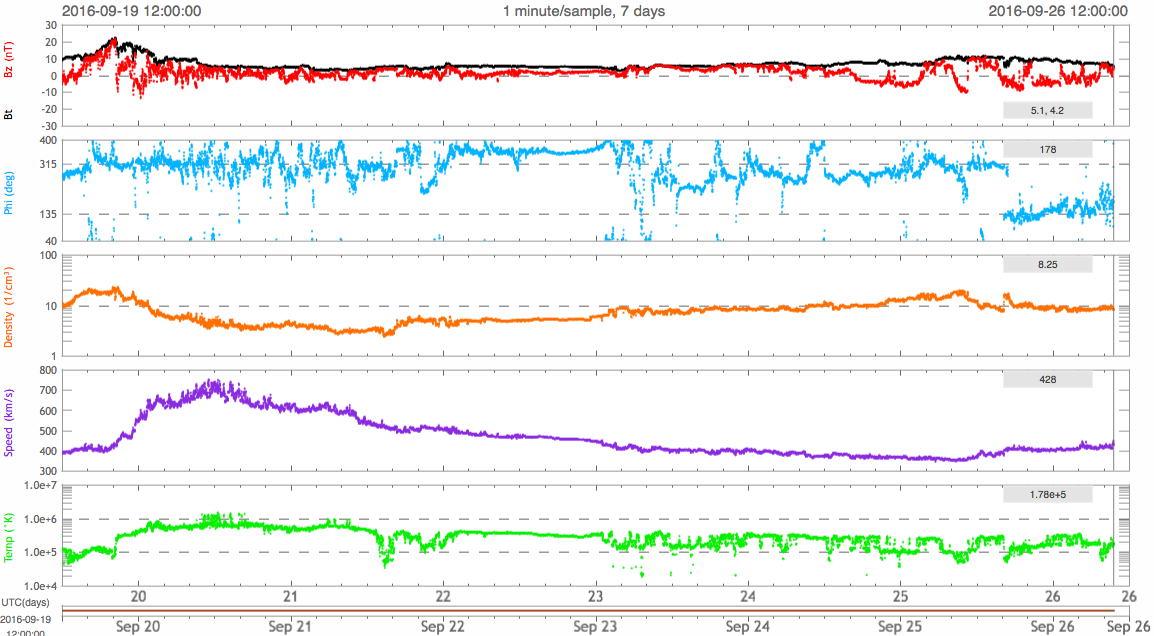
Solar wind speed measured by DSCOVR rose gradually from about 390 to about 720 km/s after the arrival of a negative coronal hole high speed stream around 0h UT on September 20. In the SDO/AIA picture below, the CH is encircled with red.
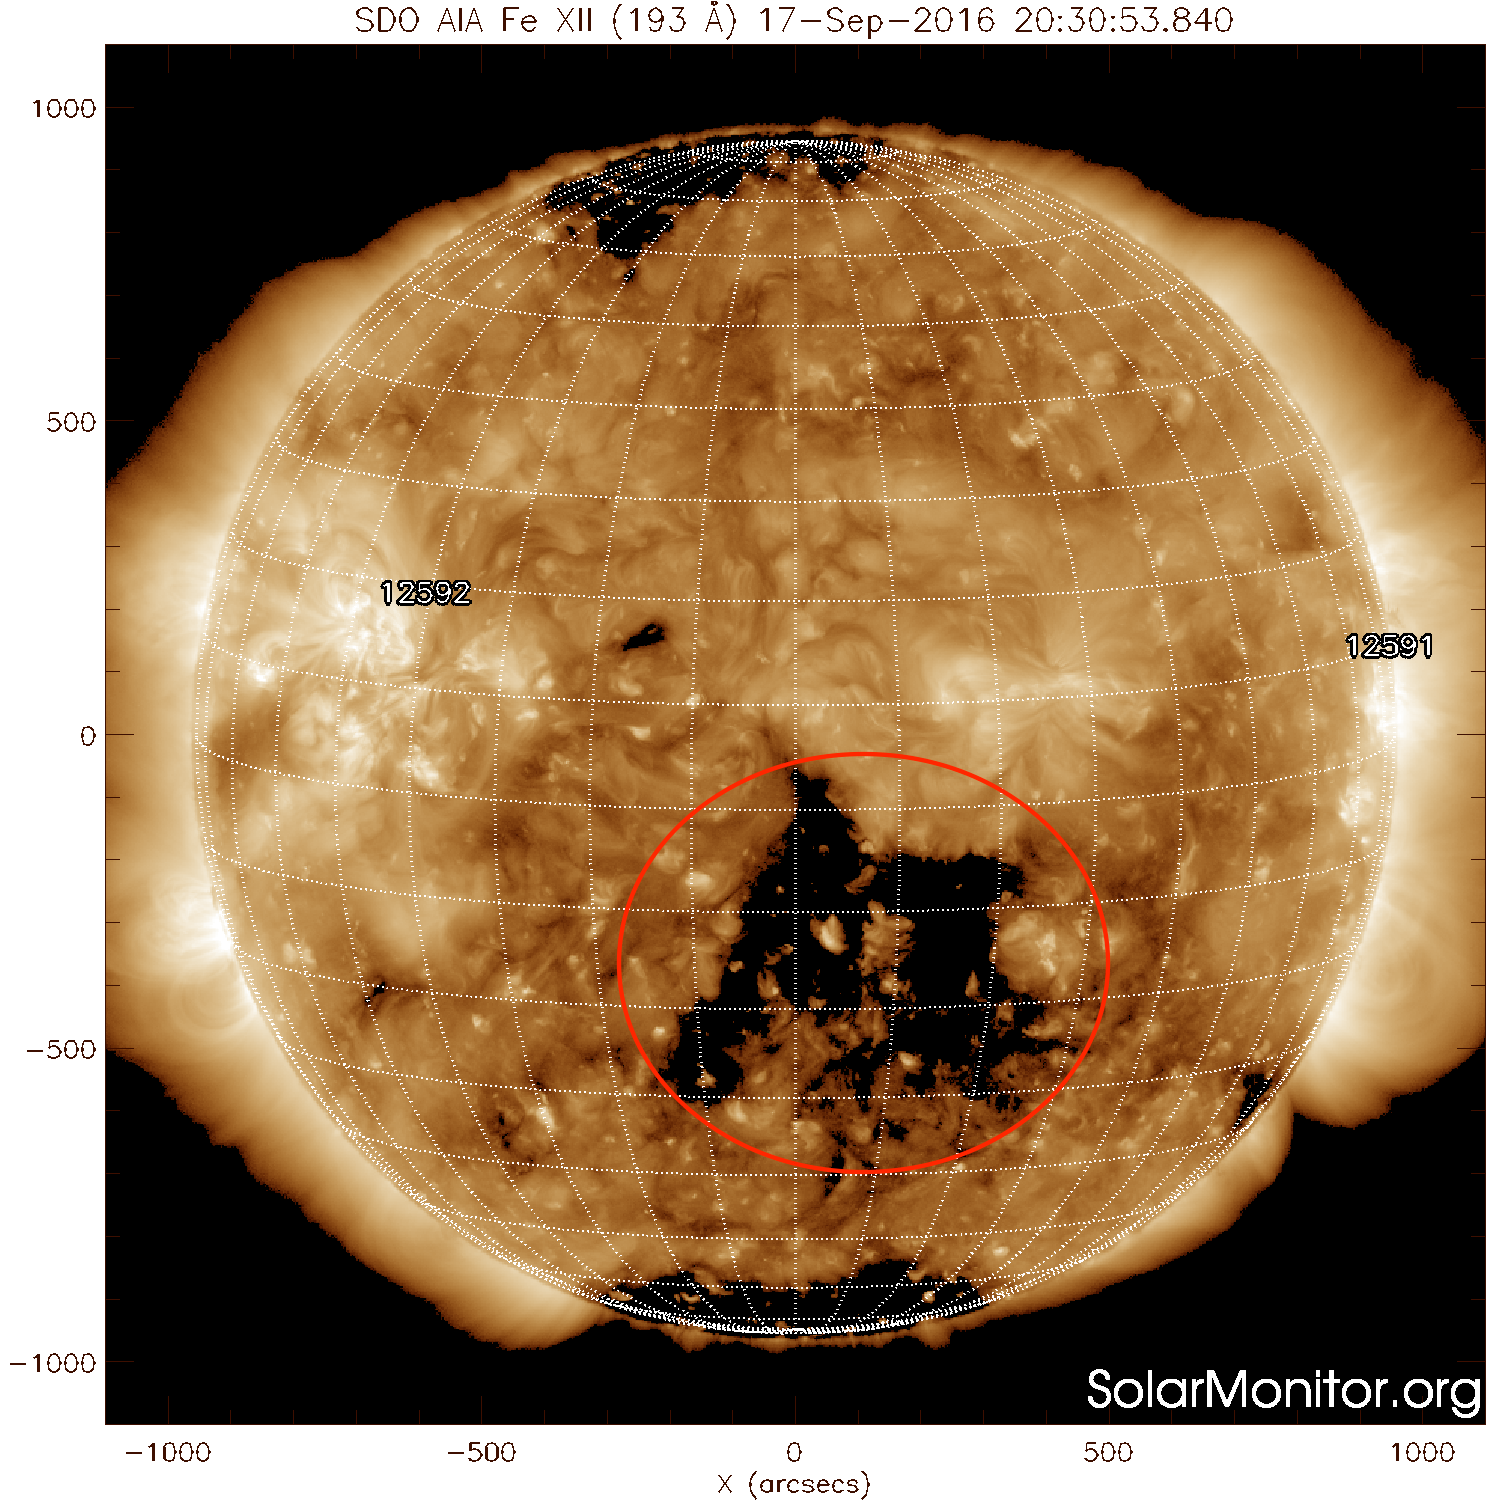
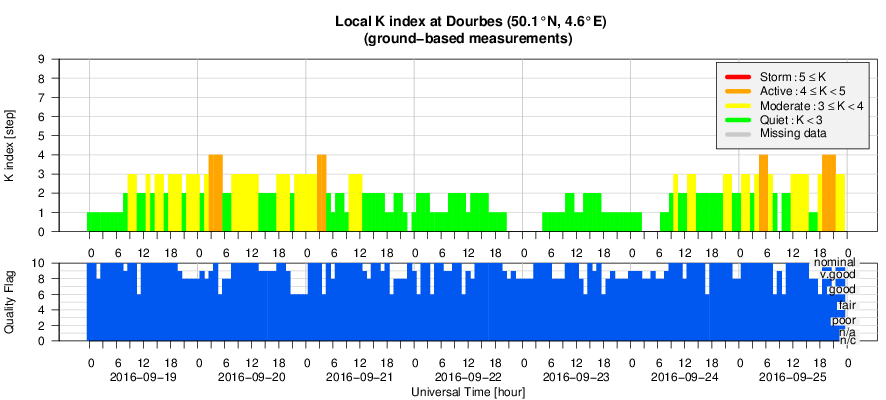
Meanwhile the magnitude of the Interplanetary Magnetic Field increased from about 10 nT to a maximum of about 21 nT around 20:30 UT on September 19. In response, K Dourbes values reached up to 4 and Kp values up to 5 during the first half of September 20.
Around 12h UT on September 20, the magnitude of the Interplanetary Magnetic Field had decreased to regular values around 5 nT while the solar wind speed gradually decreased from then onwards till September 25.
A sector boundary crossing from negative to positive sector occurred around 17h UT on September 25, causing active geomagnetic intervals (K Dourbes = 4).
Geomagnetic Observations at Dourbes (19 Sep 2016 - 25 Sep 2016)
Review of ionospheric activity (19 Sep 2016 - 25 Sep 2016)
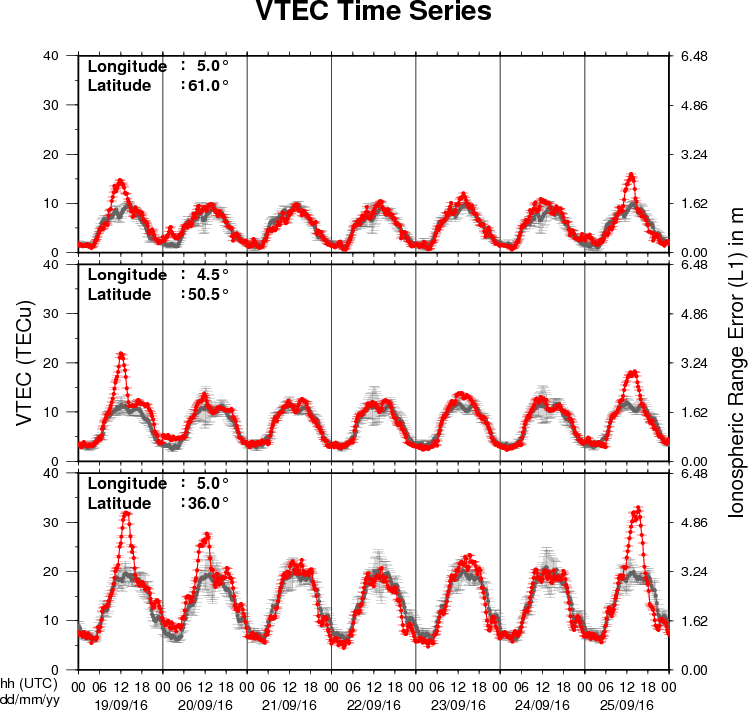
The figure shows the time evolution of the Vertical Total Electron Content (VTEC) (in red) during the last week at three locations:
a) in the northern part of Europe(N61°, 5°E)
b) above Brussels(N50.5°, 4.5°E)
c) in the southern part of Europe(N36°, 5°E)
This figure also shows (in grey) the normal ionospheric behaviour expected based on the median VTEC from the 15 previous days.
The VTEC is expressed in TECu (with TECu=10^16 electrons per square meter) and is directly related to the signal propagation delay due to the ionosphere (in figure: delay on GPS L1 frequency).
The Sun's radiation ionizes the Earth's upper atmosphere, the ionosphere, located from about 60km to 1000km above the Earth's surface.The ionization process in the ionosphere produces ions and free electrons. These electrons perturb the propagation of the GNSS (Global Navigation Satellite System) signals by inducing a so-called ionospheric delay.
See http://stce.be/newsletter/GNSS_final.pdf for some more explanations ; for detailed information, see http://gnss.be/ionosphere_tutorial.php
Future Events
For more details, see http://www.spaceweather.eu/en/event/future
4th Asia Oceania Space Weather Alliance (AOSWA) Workshop, in Jeju, Republic of Korea
Start : 2016-10-24 - End : 2016-10-27
Website:
http://aoswa4.spaceweather.org/index.php
Global Modelling of the Space Weather Chain in Helsinki, Finland
Start : 2016-10-24 - End : 2016-10-28
This event brings together solar, heliospheric, magnetospheric,
and ionospheric communities to discuss the current state and future
challenges in global modelling of the entire space weather chain.
Major developments in forecasting space weather, and understanding
the effects of solar eruptions requires increased communication and
collaboration of these often rather distinct communities. We
welcome submissions from these modelling communities and also
synergetic studies utilising both observations and numerical
models.
Website:
https://pnst.ias.u-psud.fr/sites/pnst/files/global_modelling_space_weather_oct2016.pdf
European Space Weather Week in Ostend, Belgium
Start : 2016-11-14 - End : 2016-11-18
The ESWW is the main annual event in the European Space Weather
calendar. It is the European forum for Space Weather as proven by
the high attendance to the past editions. The agenda will be
composed of plenary/parallel sessions, working meetings and
dedicated events for service end-users. The ESWW will again adopt
the central aim of bringing together the diverse groups in Europe
working on different aspects of Space Weather.
Website:
http://www.stce.be/esww13/
4th SOLARNET Meeting: The Physics of the Sun from the Interior to the Outer Atmosphere, in Lanzarote (Spain)
Start : 2017-01-16 - End : 2017-01-20
The IV SOLARNET MEETING 'The physics of the Sun from the
interior to the outer atmosphere' will take place in Lanzarote
(Spain) from 16th to 20th of January 2017, organized by the
Instituto de AstrofÃsica de Canarias (IAC).
SOLARNET (High-resolution Solar Physics Network) is an EU-FP7
project coordinated by IAC with the aim of bringing together and
integrating the major European research infrastructures in the
field of high-resolution solar physics. SOLARNET involves all
pertinent European research institutions, infrastructures, and data
repositories. Networking activities, access to first-class
infrastructures and joint research and development activities are
being covered under SOLARNET to improve, in quantity and quality,
the service provided by this European community.
The purpose of this conference is to provide a coherent picture
of the Sun as a single physical system playing all the underlying
physical processes measured and observed in the solar atmosphere to
date.
Website:
http://www.iac.es/congreso/solarnet-4meeting/
Solar Orbiter Workshop 7: Exploring the solar environs in Granada, Spain
Start : 2017-04-03 - End : 2017-04-06
This event will be hosted by the Instituto de Astrofisica de
Andalucia - CSIC. Please mind that on April 7th the 20th SWT
meeting will take place at the same venue.
Website: Unkown
New documents in the European Space Weather Portal Repository
See http://www.spaceweather.eu/en/repository
STCE - Het Solar Indices Data analysis Center: De voorspelling van het Ruimteweer
Generalities on Space Weather; SIDC SW forecast team (who, what, how, tools, products).
Given to the solar section of the VVS on 4 June 2016. 20 participants.
http://www.spaceweather.eu/en/repository/show?id=608
STCE - Het nieuwe zonnevlekkengetal: Een kleine samenvatting van een grote verandering
History of the sunspot number; reasons for revision; methodology; major changes and why; consequences on solar cycle and scientific research; group number changes; the new SILSO outlook.
Given to the solar section of the VVS on 4 June 2016. 20 participants.
http://www.spaceweather.eu/en/repository/show?id=609
STCE - Zonneactiviteit en ruimteweer tijdens zonnecyclus 24
General introduction to sunspots, solar cycle, solar eruptions, space weather, major solar storms (history), SIDC and SW prediction, major solar storms during current solar cycle (SC24) and SWx effects.
Given to the VVS / De Sterrenjutters (Koksijde, Belgium) on 2 September 2016. 20 participants.
http://www.spaceweather.eu/en/repository/show?id=610