- Table of Content
- 1.Two active reg...
- 2.The NANOK expe...
- 3.Quo vadis, Eur...
- 4.Review of sola...
- 5.PROBA2 Observa...
- 6.The Internatio...
- 7.Review of geom...
- 8.Geomagnetic Ob...
- 9.The SIDC Space...
- 10.Review of iono...
2. The NANOK expedition in Greenland
3. Quo vadis, European Space Weather community?
4. Review of solar activity
5. PROBA2 Observations (22 Feb 2021 - 28 Feb 2021)
6. The International Sunspot Number by Silso
7. Review of geomagnetic activity
8. Geomagnetic Observations at Dourbes (22 Feb 2021 - 28 Feb 2021)
9. The SIDC Space Weather Briefing
10. Review of ionospheric activity (22 Feb 2021 - 28 Feb 2021)
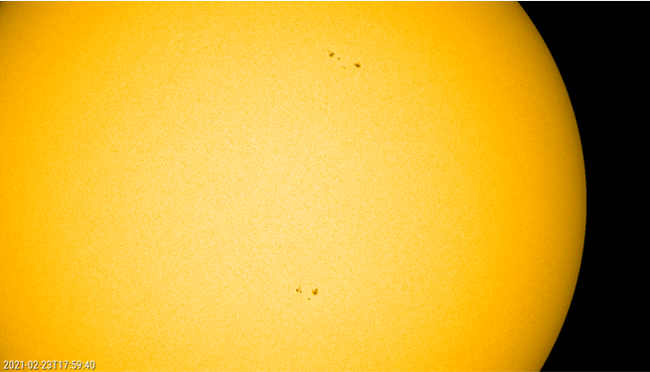
Two active regions, three CMEs
Two sunspot regions were present on the solar surface this week: NOAA 2804 in the northern hemisphere, and NOAA 2805 in the southern hemisphere. Around 23 February, the regions had about the same size and magnetic configuration. NOAA 2805 then gradually decayed becoming spotless by 25 February. NOAA 2804 on the other hand evolved into a somewhat more complex group with a relatively big leading main spot, rounding the west limb late on 28 February. See the SDO/HMI imagery underneath (https://sdo.gsfc.nasa.gov/data/aiahmi/ ).
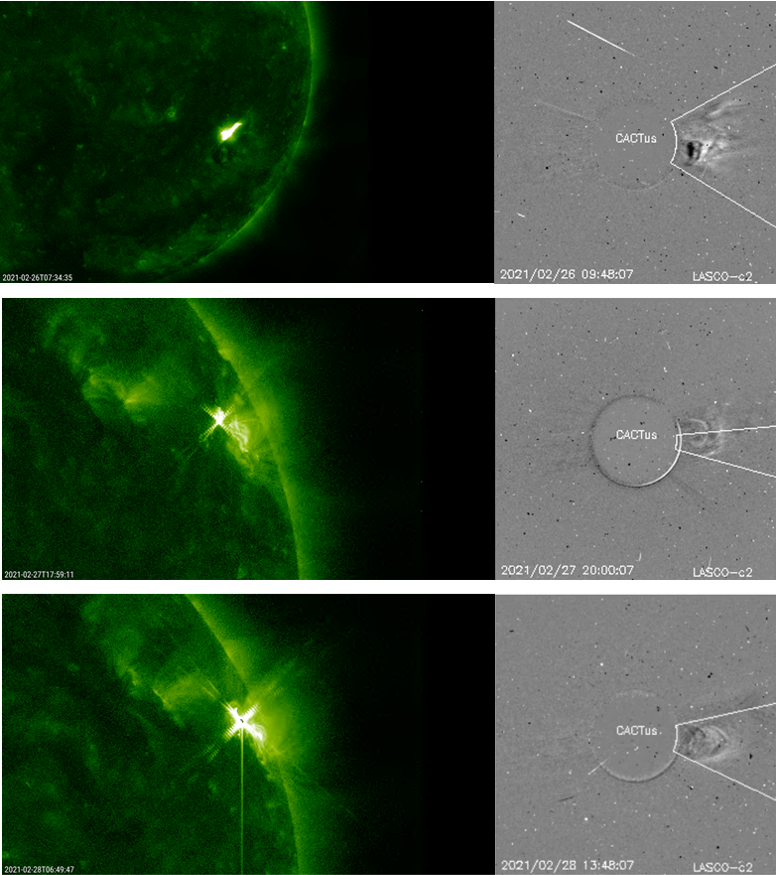
NOAA 2804 was also responsible for two C-class flares: a C2-event on 27 February, and a C3-flare a day later. Extreme ultraviolet (EUV) images show that the eruptions took place in the trailing portion of the group, and that they were associated with some coronal dimming and a coronal wave. The related coronal mass ejections (CMEs) were not directed to Earth (see the SOHO/LASCO C2 images - https://soho.nascom.nasa.gov/ ). NOAA 2805 was the source of a B9-flare on 26 February. Though also this CME did not seem to have an earth-directed component, the CME's potential contribution to the enhanced solar wind conditions and increased geomagnetic activity early on 1 March is still under debate.
The NANOK expedition in Greenland
The Belgians Gilles Denis and Nathan Goffart collaborate with STCE scientists, scientists at the Université libre de Bruxelles (ULB), the Université de Liège (ULiège) and the Geological Survey of Greenland and Denmark (GEUS) for climate research during their sport challenge in Greenland in April 2022.
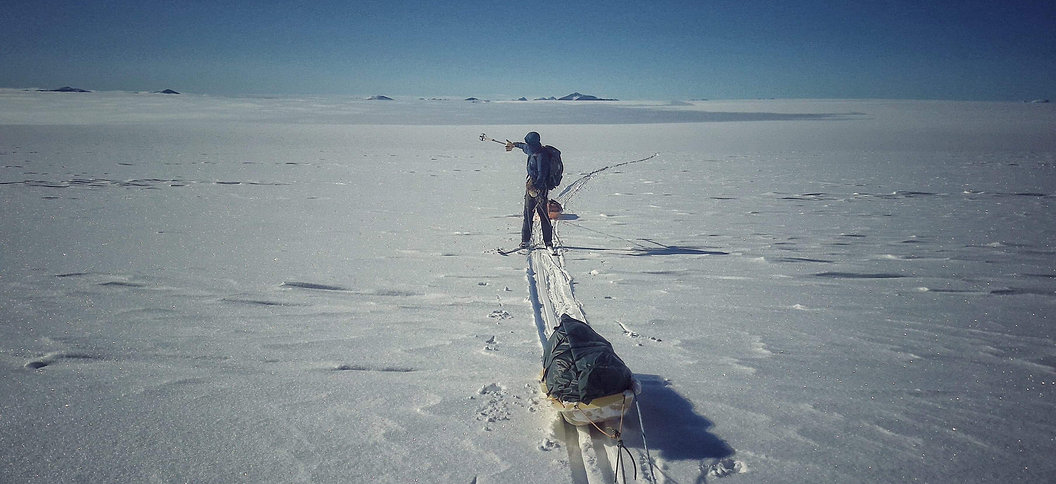
The Nanok Expedition (https://www.nanokexpedition.be) is an untypical triathlon, combining successively a 600 km crossing of the inlandsis with skis and pulka along the Arctic Circle, a 1000 km sea kayaking journey down the east coast and a 1 km vertical rock climbing ascent for the opening of a new route. Nanok is the spirit of the polar bear in Inuit culture, hence the name.
Thanks to a GNSS receiver placed on the adventurer's pulkas during their traverse of the inlandsis, Dr Nicolas Bergeot and his colleagues will gather valuable satellite data. GNSS, an acronym for Global Navigation Satellite Systems, is a satellite system with which precise positions could be determined. Those data will notably be used to calibrate ice sheet elevation models in Greenland.
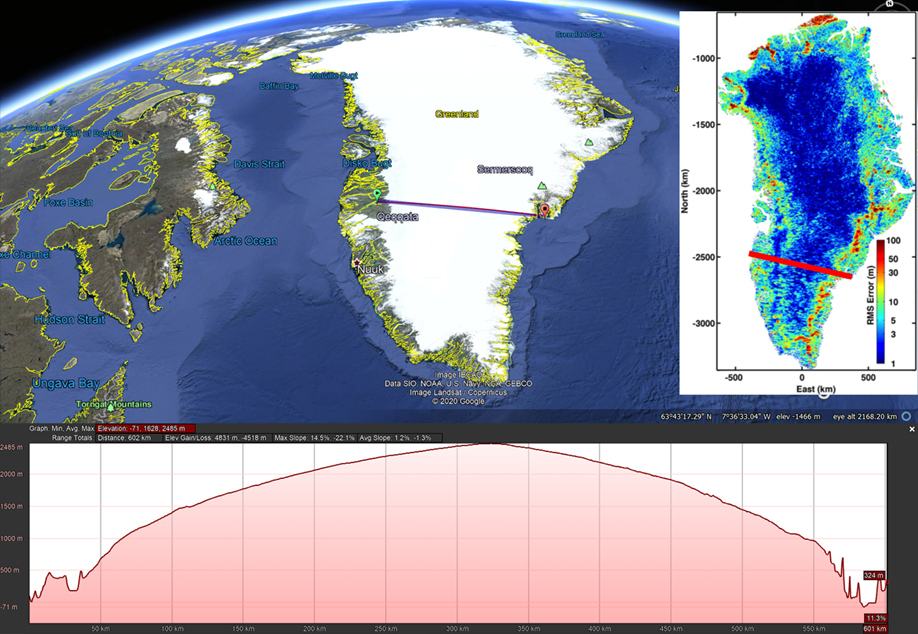
Top - Gilles and Nathan will cross Greenland following the straight line on the map (top - left and right).
Bottom - The height profile of the crossing.
For the ULB, Denis and Nathan will collect snow and cryoconite, a type of crushed stone consisting of dust, soot and microbes that lies on ice and snow. Those samples would help researchers understand the dust contribution to algae growth and extension on the Greenland Ice Sheet and its accelerated melting. Furthermore, ULB scientists will assess the impact of microplastics on remote seawater along the Greenlandic east coast.
For ULiège and the GEUS, they will perform snow pit measurements of winter snowfall accumulation. Those measurements will help to validate the researcher's current modelled surface mass balance on the Greenland Ice Sheet.
On March 12, 2021, the two friends will head back to the North to prepare for this expedition and to test the experimental setups.
Quo vadis, European Space Weather community?
We, a group of European space weather actors, believe that now is the right time to frame the Space Weather and Space Climate discipline in Europe for the coming years. The series of reasons for this have been formulated in an article that has been accepted for publication in the JSWSC. Based on this reflection, we open a discussion on the organisation and sustainability of the European Space Weather community and its assets in the (near) future. More specifically, we identify that the European Space Weather community lacks a uniting organisation to help the community to sustain and further develop the successful efforts made thus far. Our aim is to question our practices and organisation in front of several changes that have occurred in the recent years and to set the ground to make coordinated answers to these questions being posed in Europe, and to discuss them.
This discussion will be organized as:
- A virtual kickoff zoom meeting, on March 17th, 12 UT (13 CET) to present our findings, to make propositions to the European Space Weather community at large (scientists, engineers, forecasters, users, educators ...) for a future organization. A Q and A chat will be open during the presentations.
- A follow-on two months discussion involving the European actors of space weather in order to take concrete actions in the near future.
To participate to the virtual kickoff meeting, please register at http://quo-vadis.iopconfs.org/home
The paper can be downloaded at https://www.swsc-journal.org/articles/swsc/pdf/forth/swsc200098.pdf (JSWSC / "Accepted Manuscripts").
Jean Lilensten, Mateja Dumbović, Luca Spogli, Anna Belehaki, Ronald Van der Linden, Stefaan Poedts, Teresa Barata, Mario M. Bisi, Gaël Cessateur, Erwin De Donder, Antonio Guerrero, Emilia Kilpua, Marianna B. Korsos, Rui F. Pinto, Manuela Temmer, Ioanna Tsagouri, Jaroslav Urbāř, and Francesca Zuccarello.

Review of solar activity
Solar activity was at low levels for the first half of the week.
Three active regions (ARs) were present on the solar disk, NOAA AR 2803 , AR 2804 and AR 2805. NOAA AR 2804 and AR2805 produced multiple B-class flares while AR2804 also produced two C-class flares.
The 10.7cm solar radio flux increased from an initial value of 75 sfu to 80 sfu, decreasing again to 77 by the end of the period.
No Earth directed Coronal Mass Ejections (CME's) have been observed in coronagraph data.
The greater than 10 MeV proton flux was at background values.
The greater than 2 MeV electron flux remained above the 10^3 pfu event threshold while the electron fluence was at moderate levels for the majority of the week.
PROBA2 Observations (22 Feb 2021 - 28 Feb 2021)
Solar Activity
Solar flare activity fluctuated between very low and low during the week.
In order to view the activity of this week in more detail, we suggest to go to the following website from which all the daily (normal and difference) movies can be accessed: https://proba2.oma.be/ssa
This page also lists the recorded flaring events.
A weekly overview movie can be found here (SWAP week 570): https://proba2.sidc.be/swap/data/mpg/movies/weekly_movies/weekly_movie_2021_02_22.mp4
Details about some of this week's events can be found further below.
If any of the linked movies are unavailable they can be found in the P2SC movie repository here: https://proba2.oma.be/swap/data/mpg/movies/
Sunday Feb 28
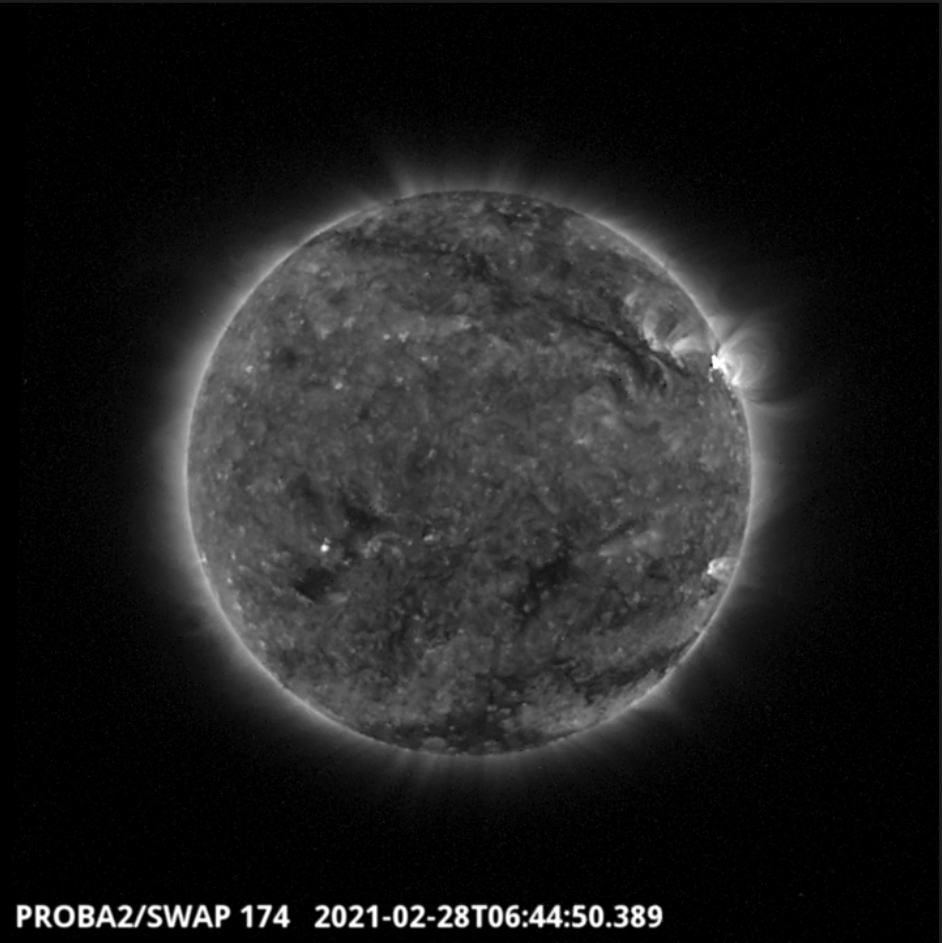
The largest flare of the week was a C3.7 flare, which was observed by SWAP and LYRA on 2021-Feb-28. The flare occurred near the north-western limb of the solar disk, as shown in the SWAP image above taken at 06:44 UT.
Find a movie of the event here: https://proba2.sidc.be/swap/movies/20210228_swap_movie.mp4 (SWAP movie)
The International Sunspot Number by Silso
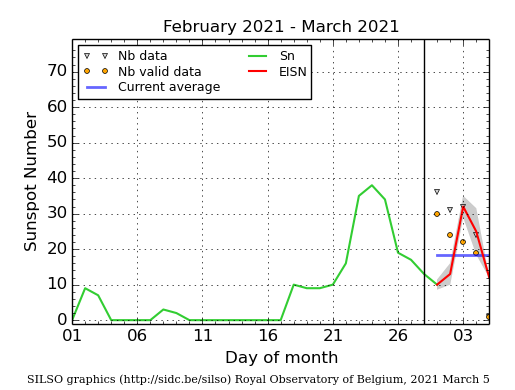
The daily Estimated International Sunspot Number (EISN, red curve with shaded error) derived by a simplified method from real-time data from the worldwide SILSO network. It extends the official Sunspot Number from the full processing of the preceding month (green line), a few days more than one solar rotation. The horizontal blue line shows the current monthly average. The yellow dots gives the number of stations that provided valid data. Valid data are used to calculate the EISN. The triangle gives the number of stations providing data. When a triangle and a yellow dot coincide, it means that all the data is used to calculate the EISN of that day.
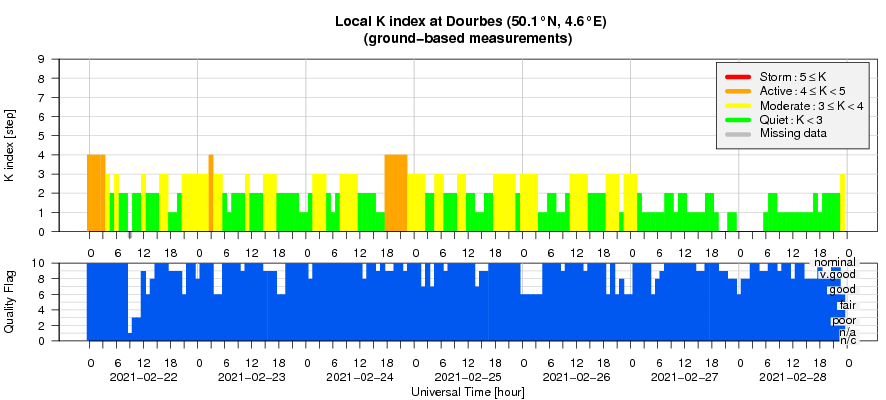
Review of geomagnetic activity
The solar wind conditions (based on DSCOVR data, DSCOVR is located in the L1 point ) were elevated on Feb 21-23 under the influence of a high speed stream (HSS) emanating from the negative polarity southern coronal holes.
On Feb 23rd a possible glancing blow of the sides of the CME from Feb 20th was seen in L1 solar wind data.
For the rest of the week, the solar wind parameters decreased towards nominal levels. Solar wind speed ranged between 345 and 640 km/s, with Bz (the component of the interplanetary magnetic field (IMF) perpendicular to the ecliptic plane) varying between -8 and +8 nT. The IMF was predominately directed towards the sun (the negative sector) at the beginning of the week, varying in the middle of the week and was predominately directed away from the sun (the positive sector) at the end of the week.
Geomagnetic activity was quiet to unsettled, with multiple active events on Feb 21-23, as response to the high speed stream associated with negative polarity southern coronal holes and on Feb 24-25, possibly as response to a glancing blow from the CME on Feb 20th.
Geomagnetic Observations at Dourbes (22 Feb 2021 - 28 Feb 2021)
The SIDC Space Weather Briefing
The Space Weather Briefing presented by the forecaster on duty from Feb 21 to 28. It reflects in images and graphs what is written in the Solar and Geomagnetic Activity report.

A pdf-version: https://www.stce.be/briefings/20210301_SWbriefing.pdf
The movie: https://www.stce.be/briefings/20210301_SWbriefing.m4v
Review of ionospheric activity (22 Feb 2021 - 28 Feb 2021)
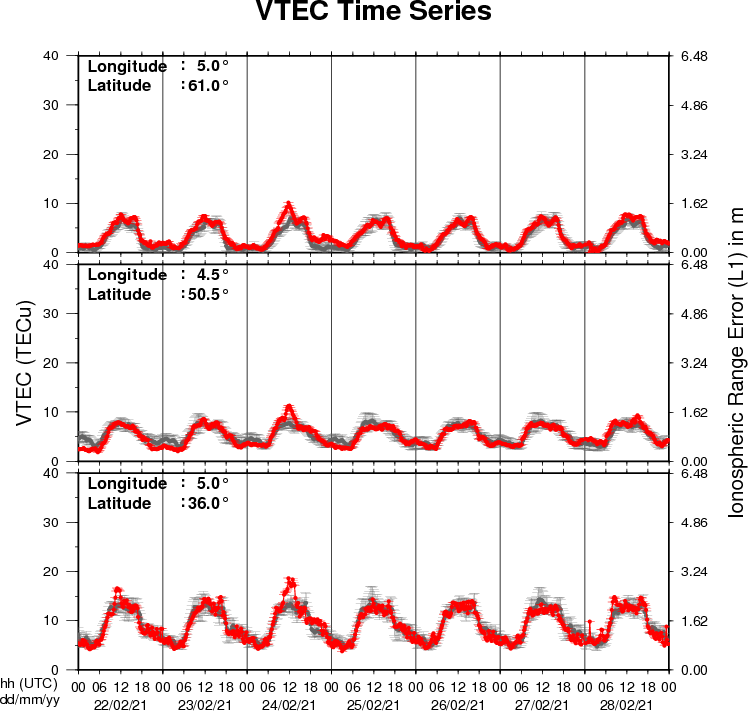
The figure shows the time evolution of the Vertical Total Electron Content (VTEC) (in red) during the last week at three locations:
a) in the northern part of Europe(N61°, 5°E)
b) above Brussels(N50.5°, 4.5°E)
c) in the southern part of Europe(N36°, 5°E)
This figure also shows (in grey) the normal ionospheric behaviour expected based on the median VTEC from the 15 previous days.
The VTEC is expressed in TECu (with TECu=10^16 electrons per square meter) and is directly related to the signal propagation delay due to the ionosphere (in figure: delay on GPS L1 frequency).
The Sun's radiation ionizes the Earth's upper atmosphere, the ionosphere, located from about 60km to 1000km above the Earth's surface.The ionization process in the ionosphere produces ions and free electrons. These electrons perturb the propagation of the GNSS (Global Navigation Satellite System) signals by inducing a so-called ionospheric delay.
See http://stce.be/newsletter/GNSS_final.pdf for some more explanations ; for detailed information, see http://gnss.be/ionosphere_tutorial.php