- Table of Content
- 1.The Sun's fars...
- 2.Review of sola...
- 3.PROBA2 Observa...
- 4.The Internatio...
- 5.Review of geom...
- 6.Geomagnetic Ob...
- 7.The SIDC Space...
- 8.Review of iono...
2. Review of solar activity
3. PROBA2 Observations (22 Mar 2021 - 28 Mar 2021)
4. The International Sunspot Number by Silso
5. Review of geomagnetic activity
6. Geomagnetic Observations at Dourbes (22 Mar 2021 - 28 Mar 2021)
7. The SIDC Space Weather Briefing
8. Review of ionospheric activity (22 Mar 2021 - 28 Mar 2021)
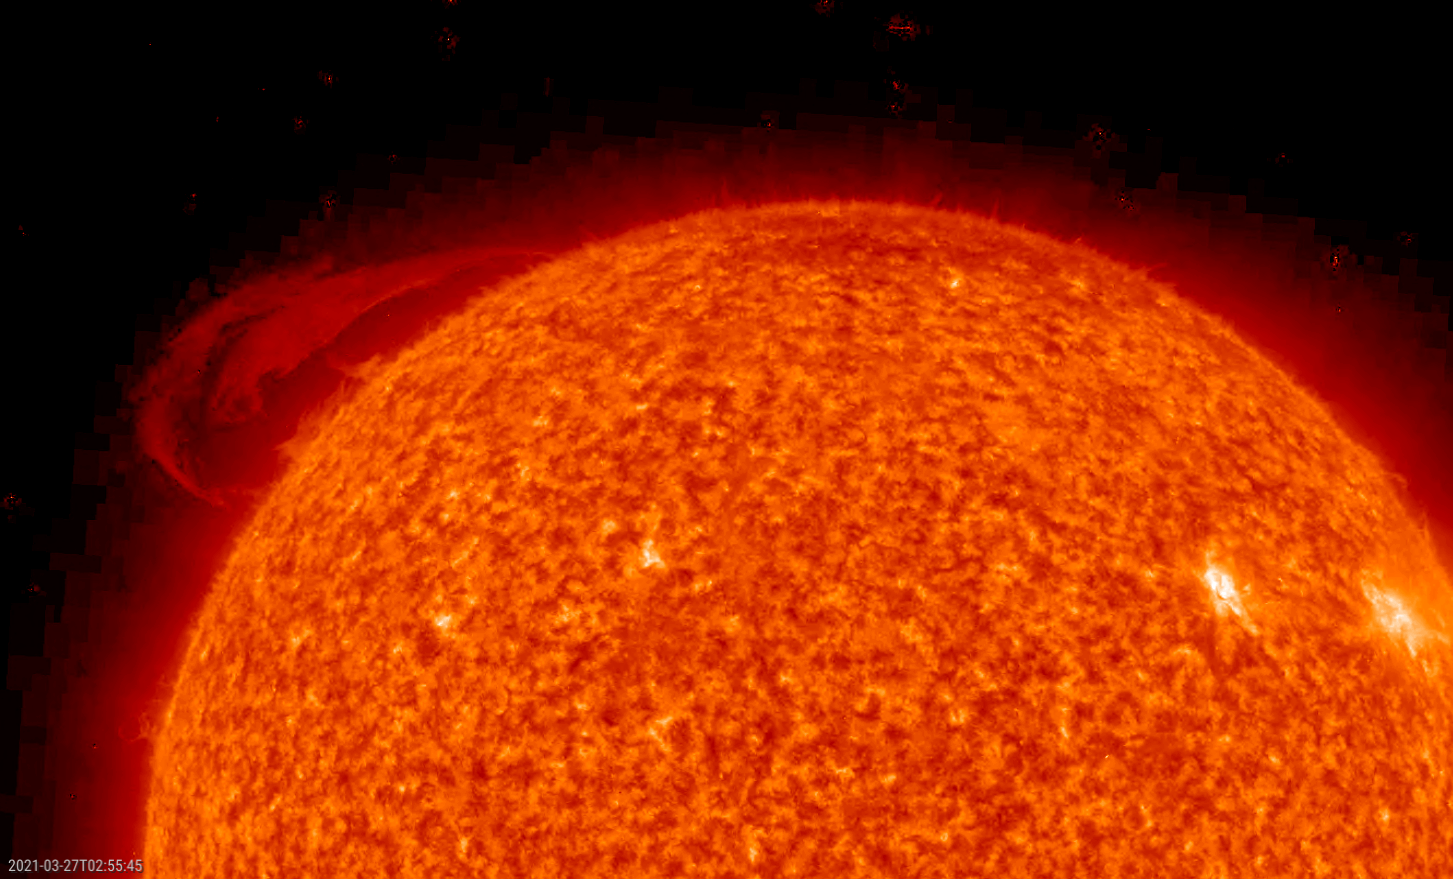
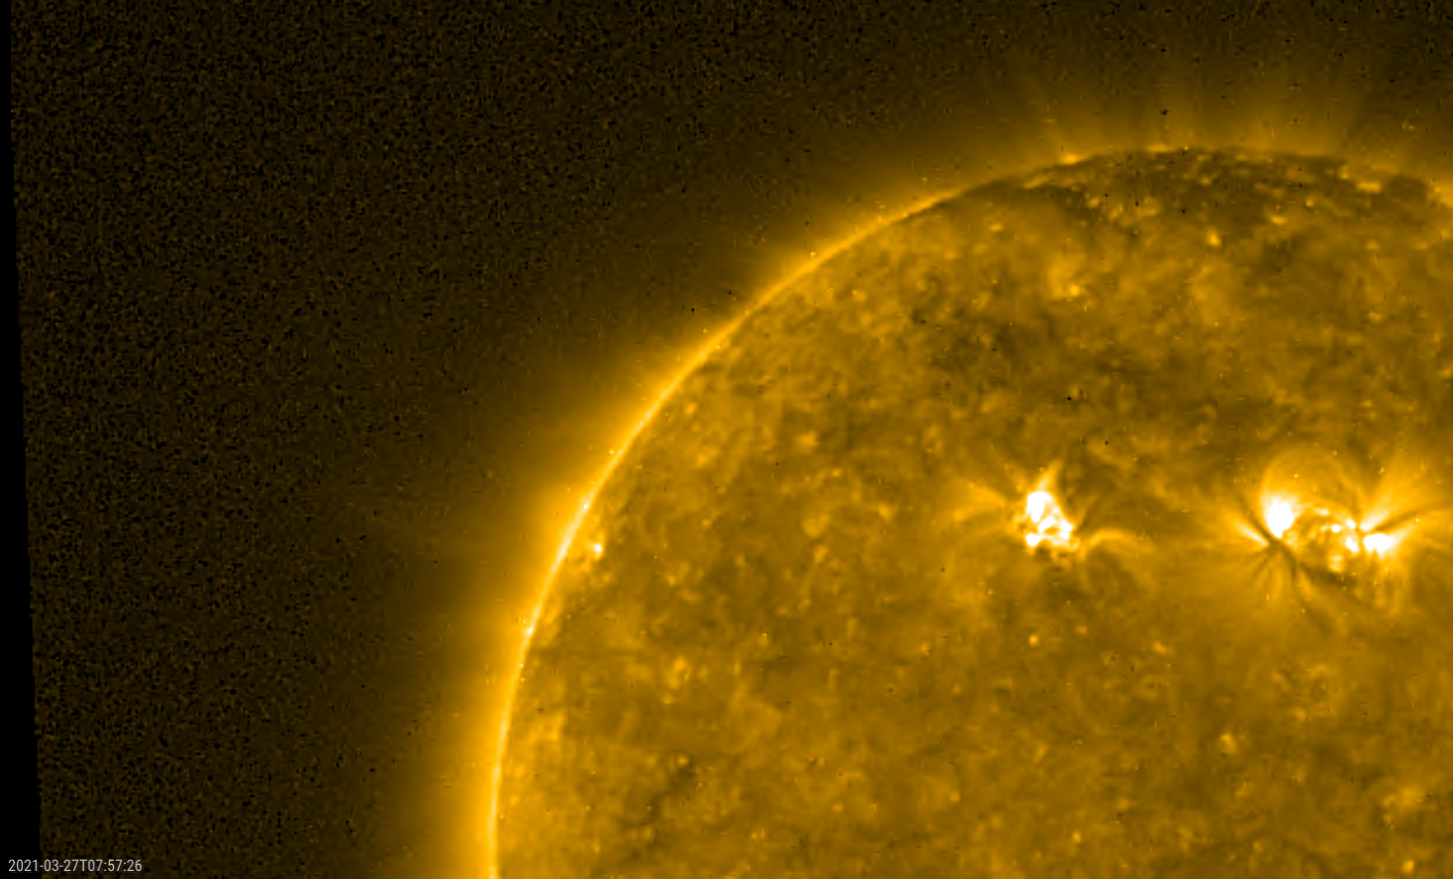
The Sun's farside joins the party!
On 26 and 27 March, extreme ultraviolet (EUV) imagery by the STEREO-A spacecraft showed a dynamic prominence near its northeast solar limb. Solar prominences are clouds of charged particles ("plasma") above the solar surface squeezed between regions of opposite magnetic polarity. Being cooler and denser than the plasma underneath and their surroundings, they appear as bright blobs when seen near the solar limb. STEREO-A is currently trailing the Earth by about 54 degrees, hence the prominence being at its east limb clearly shows this was a farside event as seen from Earth. At its maximum extent, the projected length of the prominence reached at least 360.000 km, that is basically the Earth-Moon distance. Also, it towered high enough above the solar surface to be even visible from the Earth, in part due to its relatively high latitude (between approximately 35 and 65 degrees). The pictures underneath show the prominence activity on 26-27 March, one as seen by STEREO-A (EUVI 304, i.e. at temperatures near 80.000 degrees), the other as seen by PROBA2 (SWAP 174, i.e. at temperatures near 1 million degrees). Clips are available in the online version of this newsitem at https://www.stce.be/news/520/welcome.html
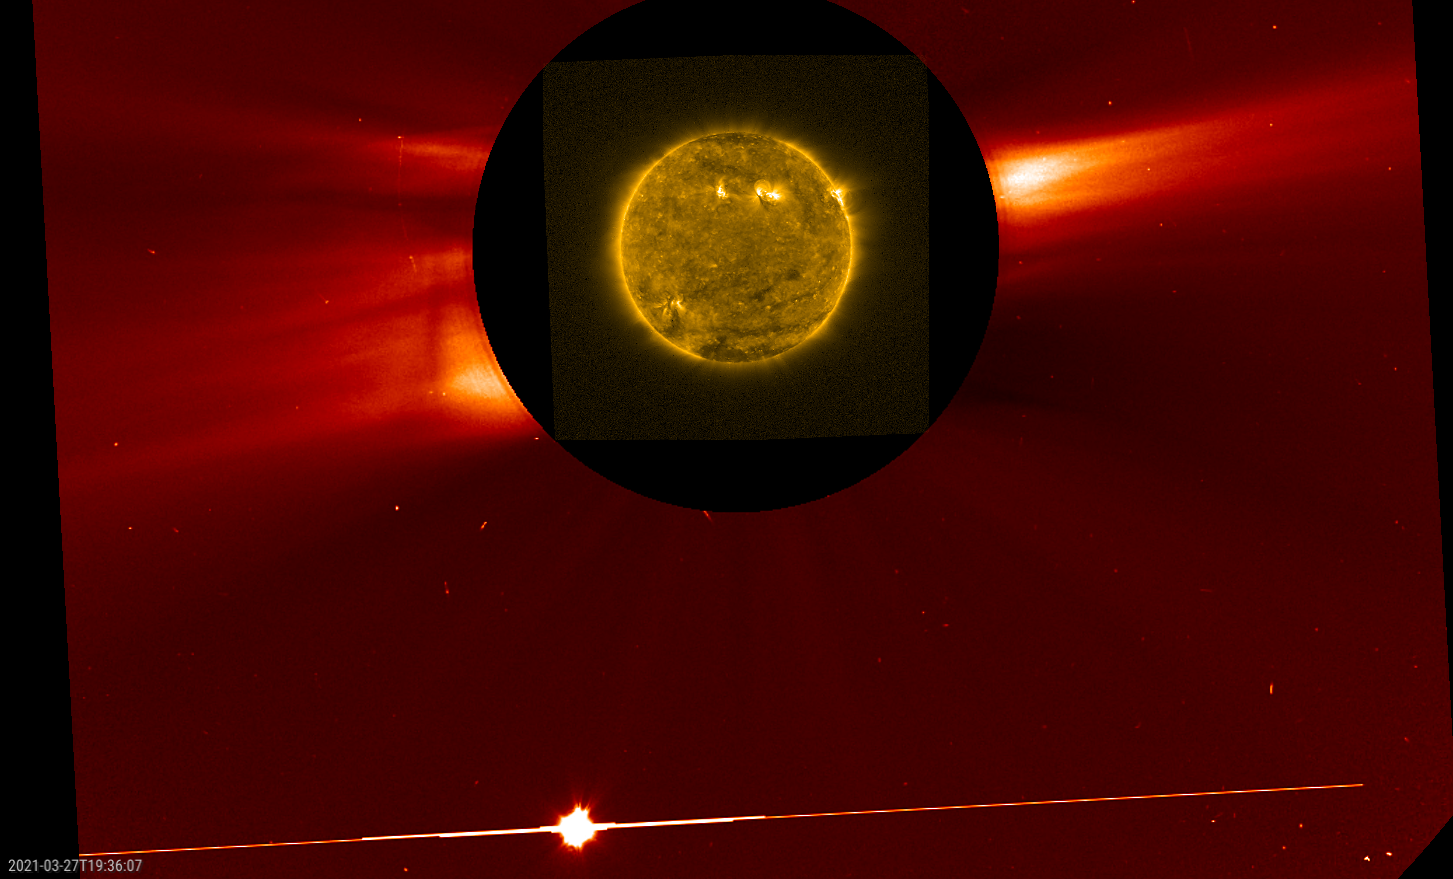
Contrary to the impressive prominence activity, the associated coronal mass ejection (CME) was a lot less spectacular. Coronagraphs from both STEREO-A and SOHO show only a very faint and ragged structure leaving the Sun. Seen from Earth, the CME was directed mostly towards the east and northeast, obviously without any earth-directed component. The bright dot in the coronagraphic images by SOHO to the south of the Sun, is the planet Venus, which had its superior conjunction with the Sun on 26 March (meaning it was located directly at the other side of the Sun as seen from Earth).
Review of solar activity
Solar activity was at very low levels. Three active regions (ARs) were visible on the solar disk, NOAA AR 2810 to 2812. The biggest flare was a B8.3 at 25/3 15:07 UT produced by NOAA 2812.
An Earth-directed corona mass ejections (CMEs) was observed on 22/3 01:10 UT. A back sided partial halo CME was observed on 26/3 (without consequences for the Earth).
The greater than 10 MeV proton flux was at nominal levels or below throughout the week.
The greater than 2 MeV electron flux exceeded the 1000 pfu threshold between 22/3 and 24/3.
The greater than 2 MeV electron fluency was at moderate levels between 21/3 and 24/3 and then reduced to nominal levels for the rest of the week.
PROBA2 Observations (22 Mar 2021 - 28 Mar 2021)
Solar Activity
Solar flare activity was very low during the week.
In order to view the activity of this week in more detail, we suggest to go to the following website from which all the daily (normal and difference) movies can be accessed: https://proba2.oma.be/ssa
This page also lists the recorded flaring events.
A weekly overview movie can be found here: https://proba2.sidc.be/swap/data/mpg/movies/weekly_movies/weekly_movie_2021_03_22.mp4 (SWAP week 574).
Details about some of this week's events can be found further below.
If any of the linked movies are unavailable they can be found in the P2SC movie repository here: https://proba2.oma.be/swap/data/mpg/movies/
Thursday Mar 25
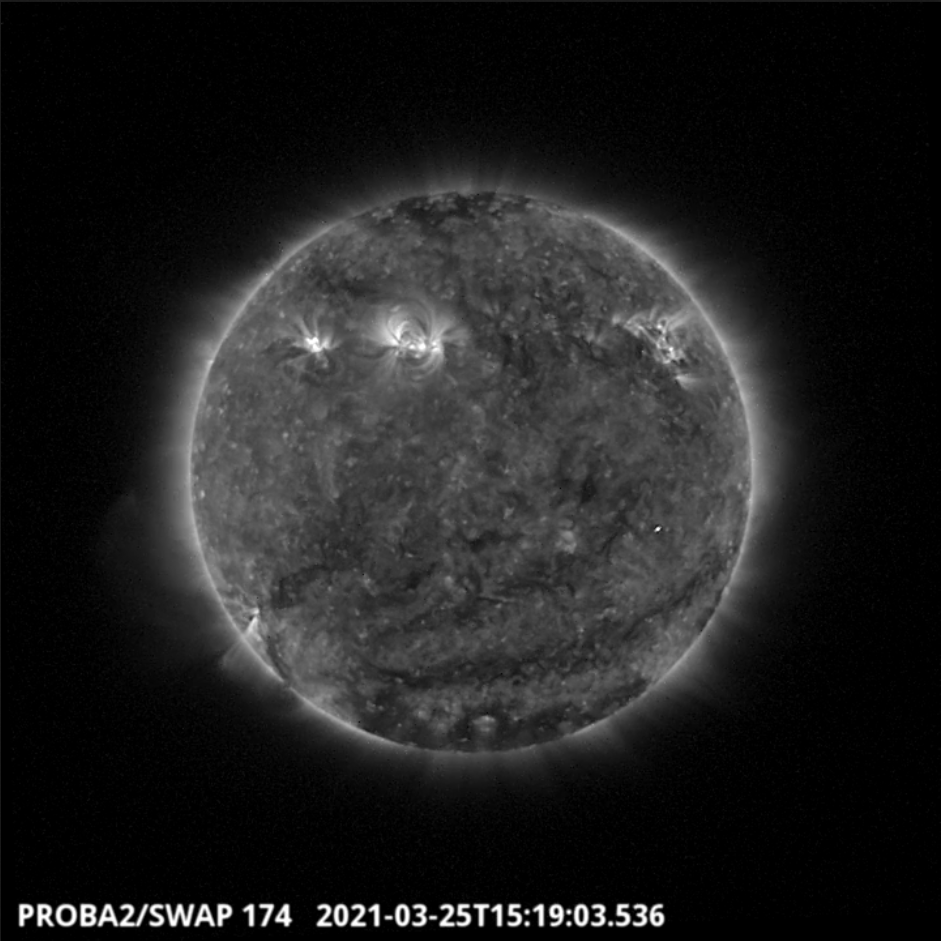
The largest flare of the week, a B8.3 flare associated with NOAA Active region 2812, was observed by SWAP and LYRA on 2021-Mar-25. The flare occurred in the north-eastern quadrant of the solar disk, as shown in the SWAP image above taken at 15:19 UT.
Find a movie of the event here: https://proba2.sidc.be/swap/movies/20210325_swap_movie.mp4 (SWAP movie)
The International Sunspot Number by Silso
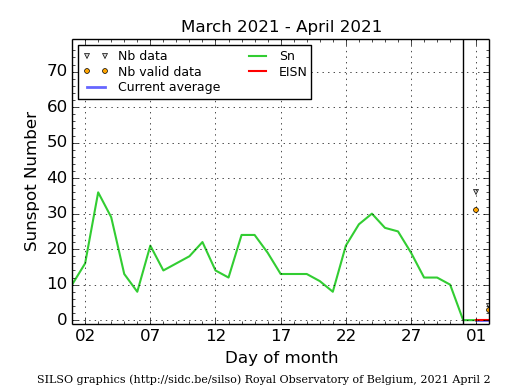
The daily Estimated International Sunspot Number (EISN, red curve with shaded error) derived by a simplified method from real-time data from the worldwide SILSO network. It extends the official Sunspot Number from the full processing of the preceding month (green line), a few days more than one solar rotation. The horizontal blue line shows the current monthly average. The yellow dots gives the number of stations that provided valid data. Valid data are used to calculate the EISN. The triangle gives the number of stations providing data. When a triangle and a yellow dot coincide, it means that all the data is used to calculate the EISN of that day.
Review of geomagnetic activity
Solar wind conditions were effected from 20/3 until 25/2 by a high-speed stream associated with the negative polarity coronal hole. The highest solar wind speeds were 680 km/s and were recorded on 20/3 and 21/3. The speed gradually decreased from 22/3, reaching 340 km/s on 27/3. The magnetic field strength varied between 1 nT and 7 nT from 20 to 27/3. The Bz showed a similar variation with values varying from -7 nT to 7 nT in this period.
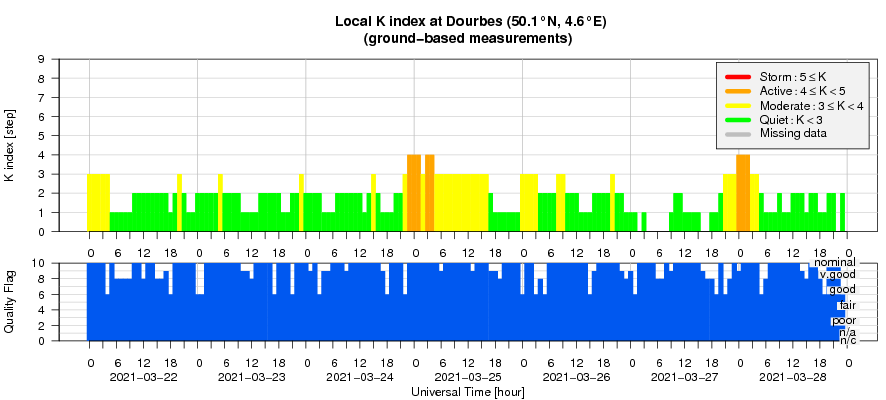
Geomagnetic activity reached minor storm levels (Kp 5) on 21/3 due to the high-speed stream arriving at the beginning of the week.
Two Interplanetary Coronal Mass Ejections arrived to the Earth: on 24/3, corresponding to a CME from 20/3 and a second one arriving on 27/3, related to the CME from the 22/3. They both caused active geomagnetic conditions (KDourbes and Kp = 4). The first one caused even a minor geomagnetic storm at the planetary level: Kp=5.
Geomagnetic Observations at Dourbes (22 Mar 2021 - 28 Mar 2021)
The SIDC Space Weather Briefing
The Space Weather Briefing presented by the forecaster on duty from March 21 to 28. It reflects in images and graphs what is written in the Solar and Geomagnetic Activity report.

A pdf-version:https://www.stce.be/briefings/20210329_SWbriefing.pdf
The movie: 20210329_SWbriefing.m4v
Review of ionospheric activity (22 Mar 2021 - 28 Mar 2021)
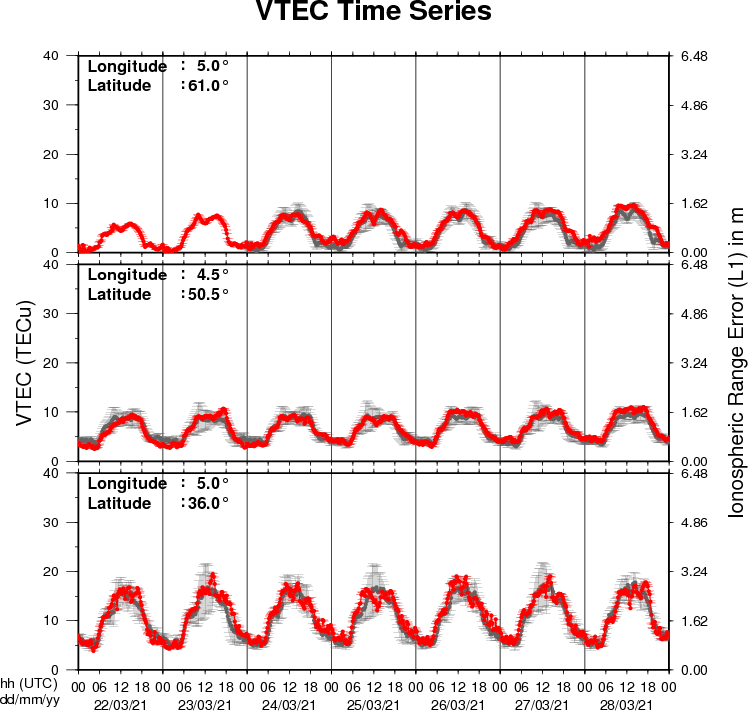
The figure shows the time evolution of the Vertical Total Electron Content (VTEC) (in red) during the last week at three locations:
a) in the northern part of Europe(N61°, 5°E)
b) above Brussels(N50.5°, 4.5°E)
c) in the southern part of Europe(N36°, 5°E)
This figure also shows (in grey) the normal ionospheric behaviour expected based on the median VTEC from the 15 previous days.
The VTEC is expressed in TECu (with TECu=10^16 electrons per square meter) and is directly related to the signal propagation delay due to the ionosphere (in figure: delay on GPS L1 frequency).
The Sun's radiation ionizes the Earth's upper atmosphere, the ionosphere, located from about 60km to 1000km above the Earth's surface.The ionization process in the ionosphere produces ions and free electrons. These electrons perturb the propagation of the GNSS (Global Navigation Satellite System) signals by inducing a so-called ionospheric delay.
See http://stce.be/newsletter/GNSS_final.pdf for some more explanations ; for detailed information, see http://gnss.be/ionosphere_tutorial.php