- Table of Content
- 1.SWx acronyms
- 2.Review of sola...
- 3.The Internatio...
- 4.PROBA2 Observa...
- 5.Review of geom...
- 6.Geomagnetic Ob...
- 7.The SIDC Space...
- 8.Review of iono...
2. Review of solar activity
3. The International Sunspot Number by Silso
4. PROBA2 Observations (5 Jul 2021 - 11 Jul 2021)
5. Review of geomagnetic activity
6. Geomagnetic Observations at Dourbes (5 Jul 2021 - 11 Jul 2021)
7. The SIDC Space Weather Briefing
8. Review of ionospheric activity (5 Jul 2021 - 11 Jul 2021)
SWx acronyms
In papers and documents on solar-terrestrial research, it is not always straightforward to immediately grasp the meaning of sentences such as "The EU funded project HELCATS established ready-to-use databases for analyzing STEREO 3D CME characteristics and HI CME tracks on a statistical basis." Quite a few would need a second reading of statements such as "Noticeable but less intense GMSs occur from the impact of ICMEs that had DSFs located in quiescent regions outside ARs as their source."
In order to help understand what researchers and space weather authors are writing, the STCE has compiled a non-exhaustive list of acronyms (https://www.stce.be/educational/acronym ) that are in use in the solar-terrestrial domain. It currently contains nearly 1500 entries. This list is primarily based on existing listings from the Space Weather Introductory Course (SWIC - https://www.stce.be/SWEC ) and the STCE Annual Reports (2011-present - https://www.stce.be/annualReport ), and further expanded with a few listings from publications and reviews. This acronym list is considered to be dynamical, i.e. there are still many space weather (SWx) acronyms out there, and new projects, satellites and research papers with their own specific acronyms are created everyday. These will drive systematic updates of this webpage. Also, feel free to send us (swec@stce.be) any acronym you find relevant for SWx, and you might retrieve it in any of the future updates of the STCE's SWx acronym list. Enjoy!
Review of solar activity
Solar activity was at low levels. Seven Active Regions (AR) were present on the solar disk facing Earth over the course of the week. In the first half of the week, NOAA AR 2835 was responsible for most of the flaring activity, producing a number of low-level C-class flares between July 04 and 06. In the second half of the week, NOAA AR 2840 emerged near the west limb and produced three C-class flares after it rotated beyond the limb, including a C7 flare that peaked at 1050UT July 09. By the end of the week, only two magnetically simple ARs remained on the solar disk (NOAA AR2841 and AR2842).
No Earth directed Coronal Mass Ejections (CMEs) were detected in the available coronagraph imagery.
The greater than 10 MeV proton flux was at nominal levels.
The greater than 2 MeV electron flux remained below the 1000 pfu alert threshold and the 24h electron fluence was at nominal levels.
The International Sunspot Number by Silso
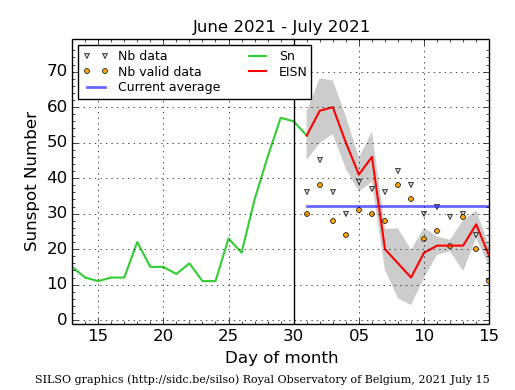
The daily Estimated International Sunspot Number (EISN, red curve with shaded error) derived by a simplified method from real-time data from the worldwide SILSO network. It extends the official Sunspot Number from the full processing of the preceding month (green line), a few days more than one solar rotation. The horizontal blue line shows the current monthly average. The yellow dots gives the number of stations that provided valid data. Valid data are used to calculate the EISN. The triangle gives the number of stations providing data. When a triangle and a yellow dot coincide, it means that all the data is used to calculate the EISN of that day.
PROBA2 Observations (5 Jul 2021 - 11 Jul 2021)
Solar Activity
Solar flare activity fluctuated from very low to low during the week.
In order to view the activity of this week in more detail, we suggest to go to the following website from which all the daily (normal and difference) movies can be accessed: https://proba2.oma.be/ssa
This page also lists the recorded flaring events.
A weekly overview movie can be found here (SWAP week 589): https://proba2.sidc.be/swap/data/mpg/movies/weekly_movies/weekly_movie_2021_07_05.mp4
Details about some of this week's events can be found further below.
If any of the linked movies are unavailable they can be found in the P2SC movie repository here: https://proba2.oma.be/swap/data/mpg/movies/
Friday Jul 09
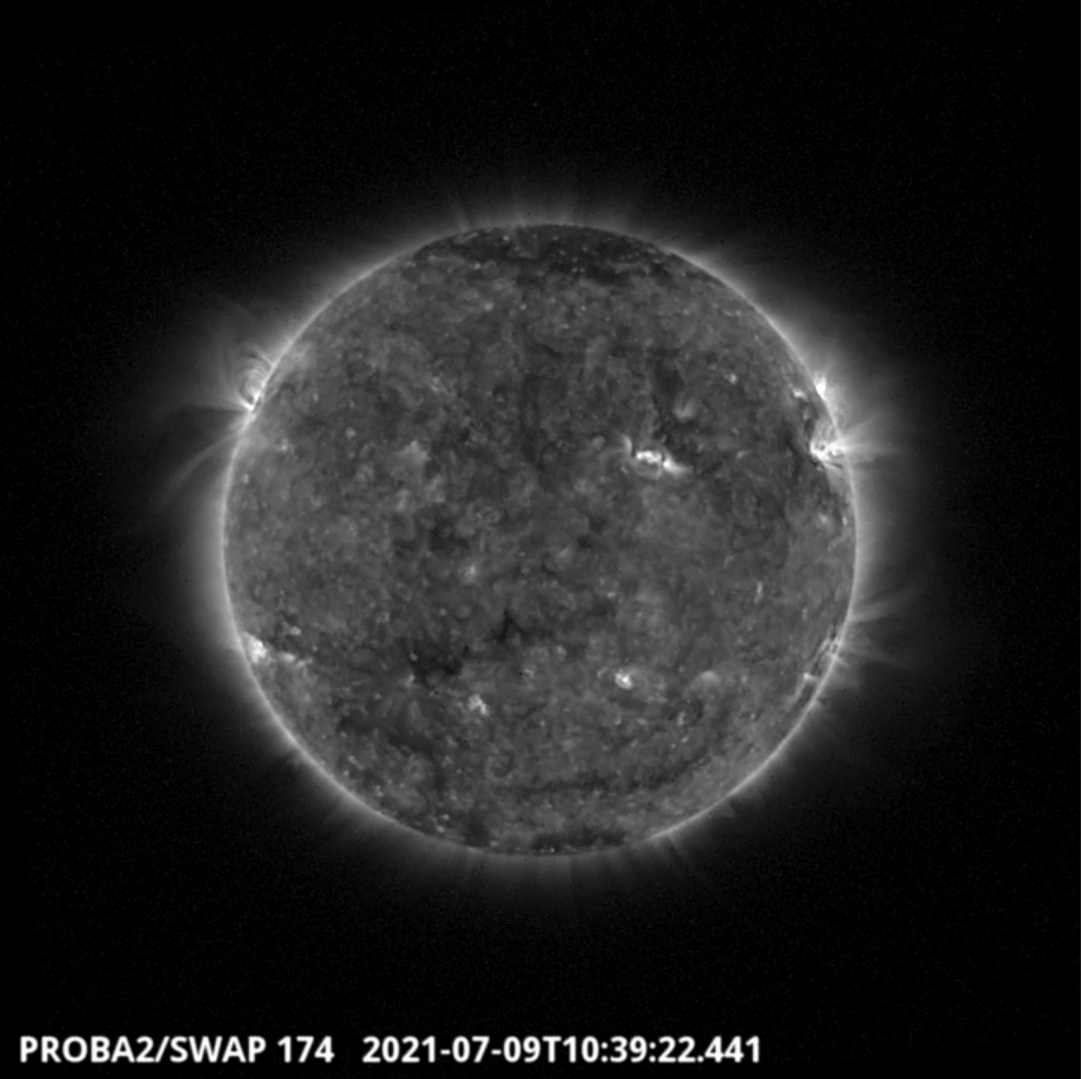
The largest flare of the week, a C7 flare, was observed by SWAP and LYRA. The flare and associated eruption is visible on the north-west limb of the solar disk on 2021-Jul-09, as shown in the SWAP image above taken at 10:39 UT.
Find a movie of the event here (SWAP movie): https://proba2.sidc.be/swap/movies/20210709_swap_movie.mp4
Review of geomagnetic activity
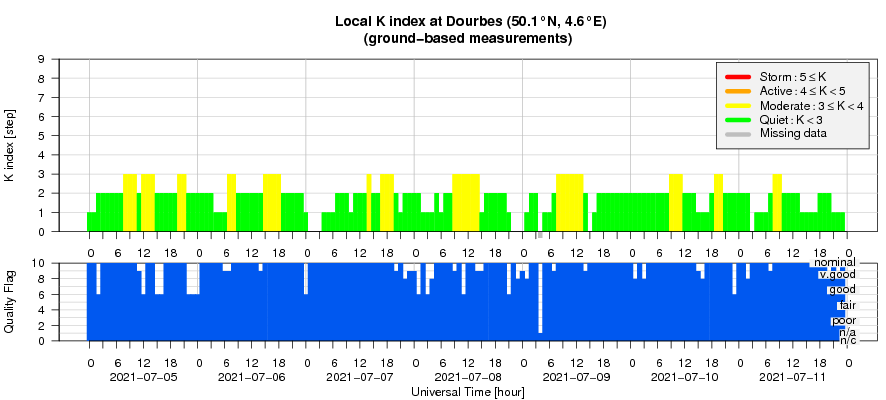
The Earth was under the influence of the slow solar wind for the majority of the week. The solar wind speed varied between 300 and 400 km/s for the first half of the week, increasing on July 10 to values up to 450 km/s before then decreasing again. The magnetic field was slightly enhanced with values up to 12 nT. The Bz varied between -9 and +8 nT. The interplanetary magnetic field phi angle varied for the first half of the week but was predominantly in the positive sector (directed away from the Sun) from Jul 07.
Geomagnetic conditions were quiet to unsettled (NOAA Kp and local K Dourbes 0-3).
Geomagnetic Observations at Dourbes (5 Jul 2021 - 11 Jul 2021)
The SIDC Space Weather Briefing
The Space Weather Briefing presented by the forecaster on duty from July 4 to 11. It reflects in images and graphs what is written in the Solar and Geomagnetic Activity report.

A pdf-version: https://www.stce.be/briefings/20210712_SWbriefing.pdf
The movie: https://www.stce.be/briefings/20210712_SWbriefing.m4v
Review of ionospheric activity (5 Jul 2021 - 11 Jul 2021)
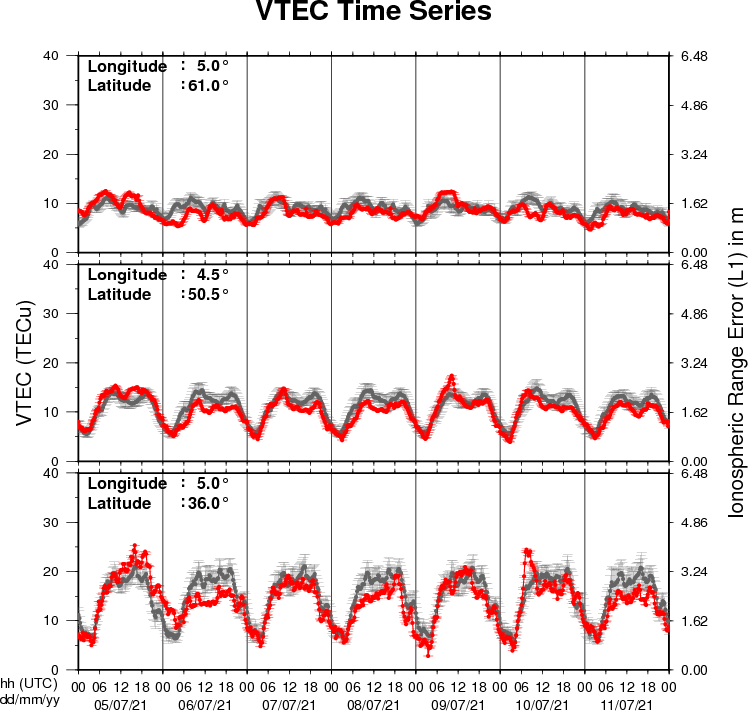
The figure shows the time evolution of the Vertical Total Electron Content (VTEC) (in red) during the last week at three locations:
a) in the northern part of Europe(N61°, 5°E)
b) above Brussels(N50.5°, 4.5°E)
c) in the southern part of Europe(N36°, 5°E)
This figure also shows (in grey) the normal ionospheric behaviour expected based on the median VTEC from the 15 previous days.
The VTEC is expressed in TECu (with TECu=10^16 electrons per square meter) and is directly related to the signal propagation delay due to the ionosphere (in figure: delay on GPS L1 frequency).
The Sun's radiation ionizes the Earth's upper atmosphere, the ionosphere, located from about 60km to 1000km above the Earth's surface.The ionization process in the ionosphere produces ions and free electrons. These electrons perturb the propagation of the GNSS (Global Navigation Satellite System) signals by inducing a so-called ionospheric delay.
See http://stce.be/newsletter/GNSS_final.pdf for some more explanations ; for detailed information, see http://gnss.be/ionosphere_tutorial.php