- Table of Content
- 1.Increasing sun...
- 2.Review of sola...
- 3.PROBA2 Observa...
- 4.The Internatio...
- 5.Review of geom...
- 6.Geomagnetic Ob...
- 7.The SIDC Space...
- 8.Review of iono...
2. Review of solar activity
3. PROBA2 Observations (30 Aug 2021 - 5 Sep 2021)
4. The International Sunspot Number by Silso
5. Review of geomagnetic activity
6. Geomagnetic Observations at Dourbes (30 Aug 2021 - 5 Sep 2021)
7. The SIDC Space Weather Briefing
8. Review of ionospheric activity (30 Aug 2021 - 5 Sep 2021)
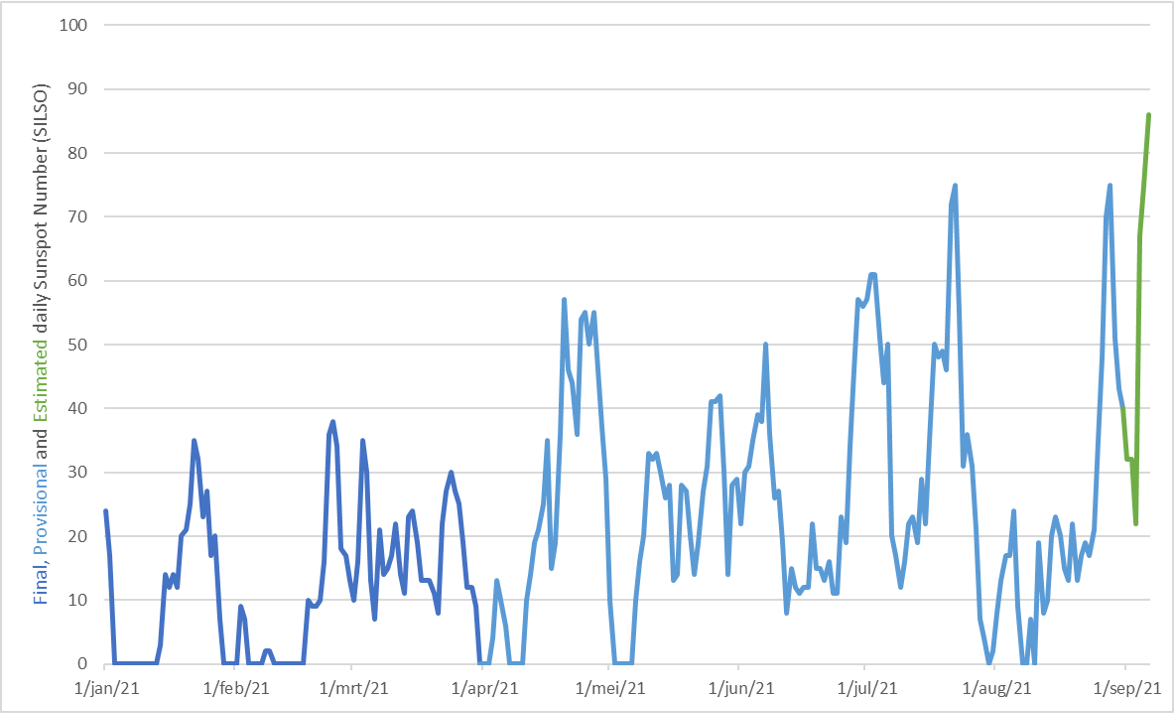
Increasing sunspot numbers
After a few days of low sunspot numbers, late last week (from 5 September onwards) saw suddenly a flurry of relatively well-sized sunspot groups. These concerned not the ususal sunspot groups consisting only of small featureless sunspots such as McIntosh A- and B-types (see the STCE's SWx Classification page at https://www.stce.be/educational/classification#sunspot ), but regions with a fair amount of individual sunspots (D-type with mature main sunspots). Thus, the estimated sunspot numbers rose again to values of 70 and higher, and may possibly be the highest of the year so far. The graph underneath shows the daily sunspot numbers from 1 January till 6 September, as taken from the SILSO website at https://wwwbis.sidc.be/silso/home The provisional daily sunspot numbers do usually not differ very much from the final ones, hence the almost identical colour. The estimated numbers (in green) concern the first 6 days of September, are often based on a smaller number of observations than the final ones, and so may differ a bit more from the final daily sunspot numbers. Nonetheless, one can see that the recent September sunspot numbers are at least similar to other peaks in the daily sunspot numbers seen earlier this year, and may potentially be even the highest so far in 2021. Despite their size, the active regions remained fairly flare inactive.
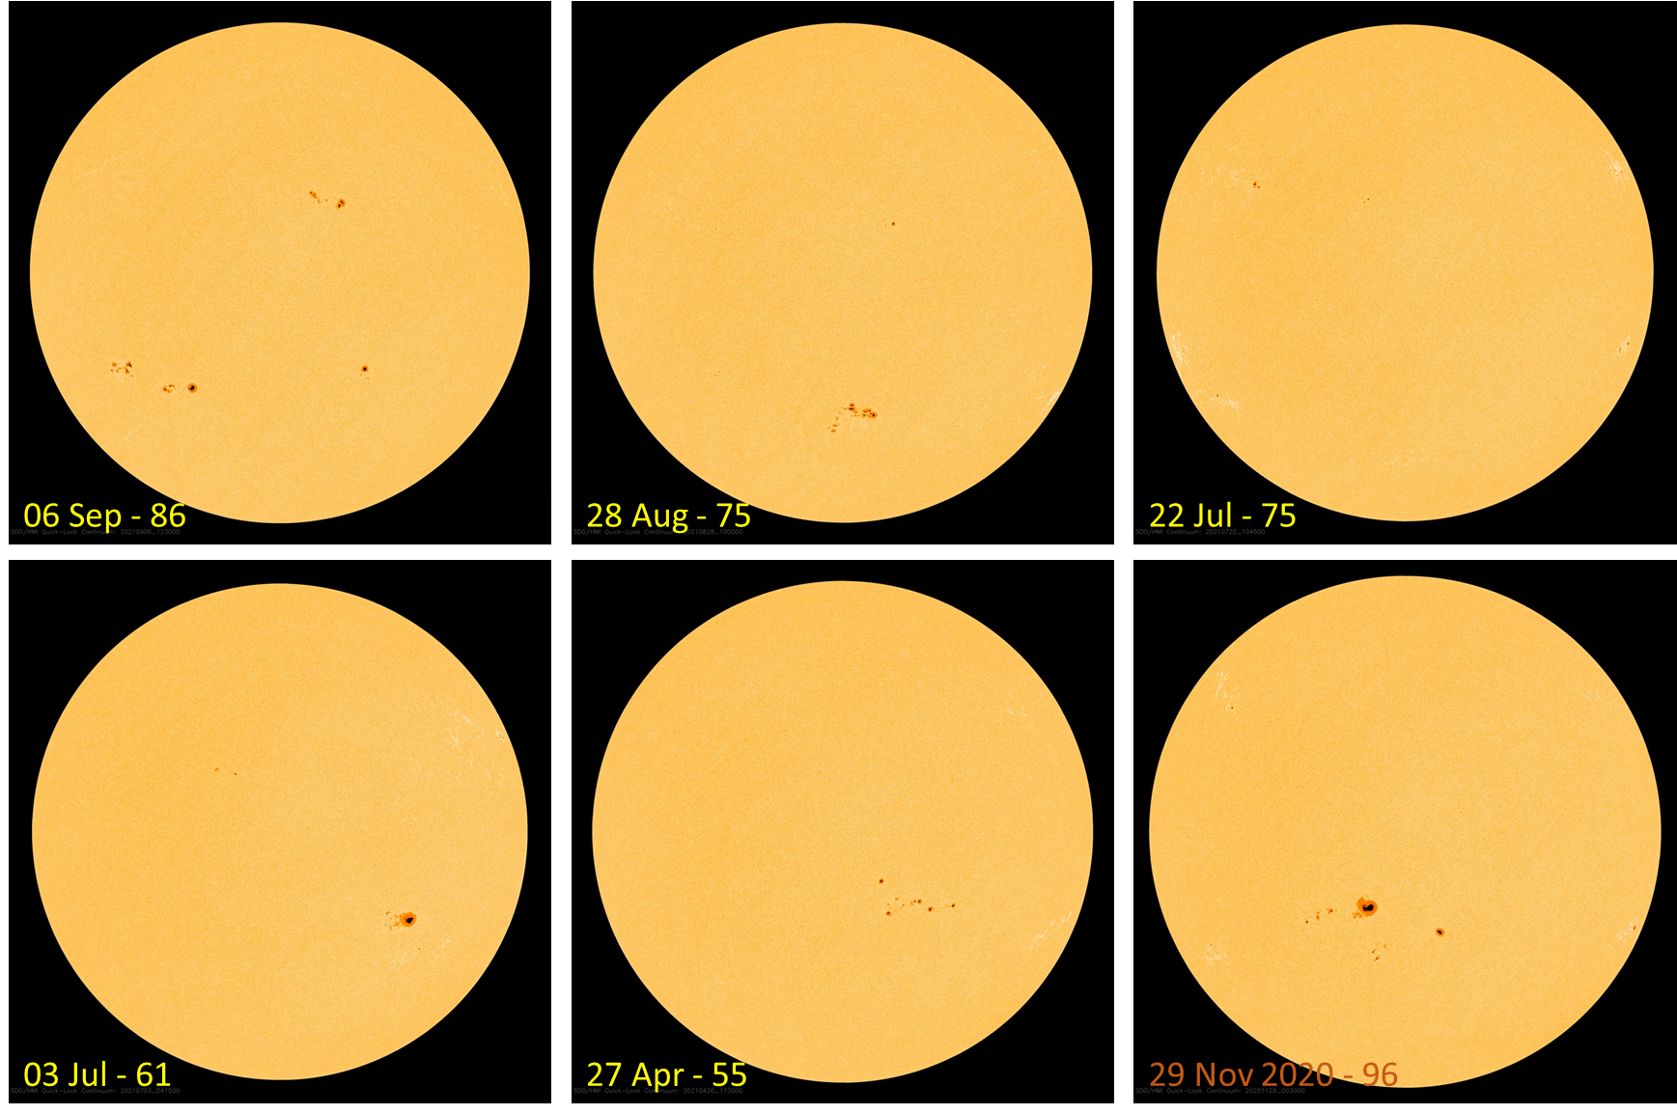
The interesting enhancement of sunspot activity can also be seen when comparing solar white light imagery. On 5 and 6 September, there were 4 well-sized groups, with mature main spots and many small spots in the intermediate portions. The difference with previous peak days of enhanced sunspot activity can be seen in the SDO/HMI images (https://sdo.gsfc.nasa.gov/data/aiahmi/ ) underneath, where mostly it concerns 1 big group with a few small groups (barely visible), or several (5-6) small sunspot regions. For comparison, the image to the lower right was taken on 29 November last year, which is -currently- the day with the highest sunspot number so far this solar cycle. All images have the date and sunspot number on the lower left.
Review of solar activity
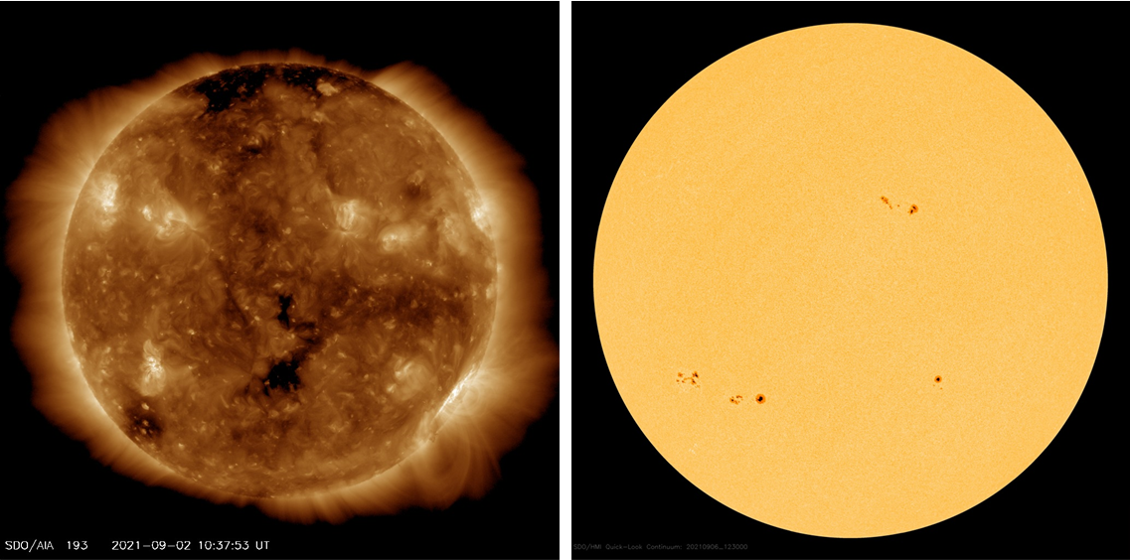
Catania sunspot group 32 (NOAA active region 2860) was of beta-gamma magnetic type at the start of the week but continued to only produce low level C-class flares. It then started to shrink and reduced in complexity as it rotated towards the southwest solar limb. The only other region on disc at the start of the week was Catania group 33 (NOAA active region 2859), which was simple and inactive. By the end of the week several new regions developed on disc, some of which were only shortlived. By the end of the week there were 4 bipolar regions on disc (SDO/HMI image lower right), none of them appearing particularly complex. X-ray flux remained below C level over the last days of the week.
A dimming and EUV wave could be seen to the south of active region 2864 starting around 20:07UT September 4. While this is indicative of a coronal mass ejection (CME) initiation that could have an earth-directed component, no such traces were seen in SoHO/LASCO coronagraph images. STEREO-A/COR2 coronagraph images show only a slow and narrow CME and any possible arrival to Earth should cause only weak effects. No other earth-directed CMEs were observed in available coronagraph data.
The greater than 10 MeV proton flux was at background levels throughout the week. The greater than 2 MeV electron flux reached above the 1000 pfu threshold during most of the diurnal maxima. The 24h electron fluence was at normal to moderate levels with an overall decaying trend.
A negative polarity coronal hole in the southern hemisphere that started transiting the central meridian on September 1 (SDO/AIA 193 image lower left) could possibly lead to mild solar enhancements from September 5 onwards.
PROBA2 Observations (30 Aug 2021 - 5 Sep 2021)
Solar Activity
Solar flare activity fluctuated from very low to low during the week.
In order to view the activity of this week in more detail, we suggest to go to the following website from which all the daily (normal and difference) movies can be accessed: https://proba2.oma.be/ssa
This page also lists the recorded flaring events.
A weekly overview movie can be found here (SWAP week 597): https://proba2.sidc.be/swap/data/mpg/movies/weekly_movies/weekly_movie_2021_08_30.mp4
No strong solar activity was observed this week. The strongest flare measured by LYRA was a C3 flare peaking at 21:34 UT on August 30. SWAP observed filament activity on September 1 and an EUV wave on September 5.
Details about some of this week's events can be found further below.
If any of the linked movies are unavailable they can be found in the P2SC movie repository here: https://proba2.oma.be/swap/data/mpg/movies/ .
Monday Aug 30
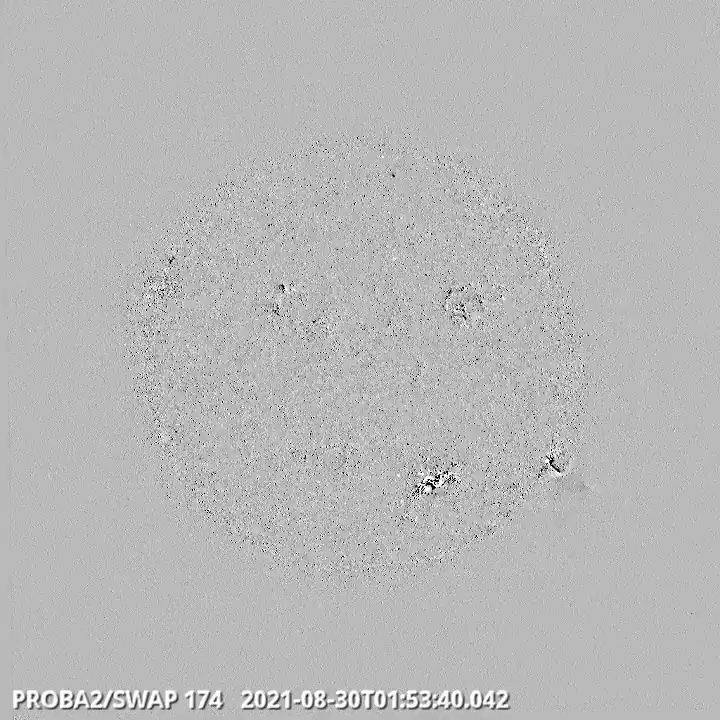
Nearly simultaneous eruptions in the south-western hemisphere starting around 01:40UT associated with C-class flaring are shown in this SWAP difference image.
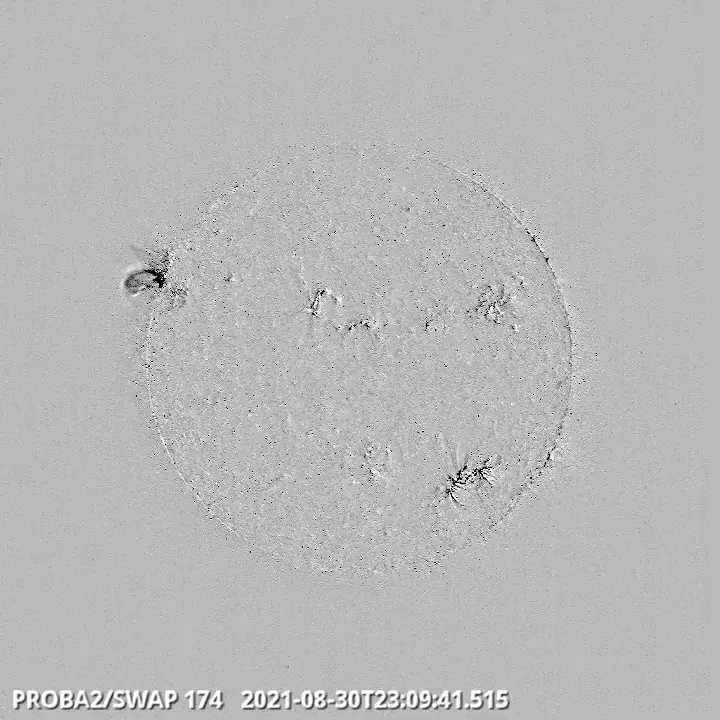
Eruption towards the north-east around 23UT - SWAP difference image.
Find a movie of the events here (SWAP difference movie): http://proba2.sidc.be/swap/data/mpg/movies/20210830_swap_diff.mp4
Wednesday September 1
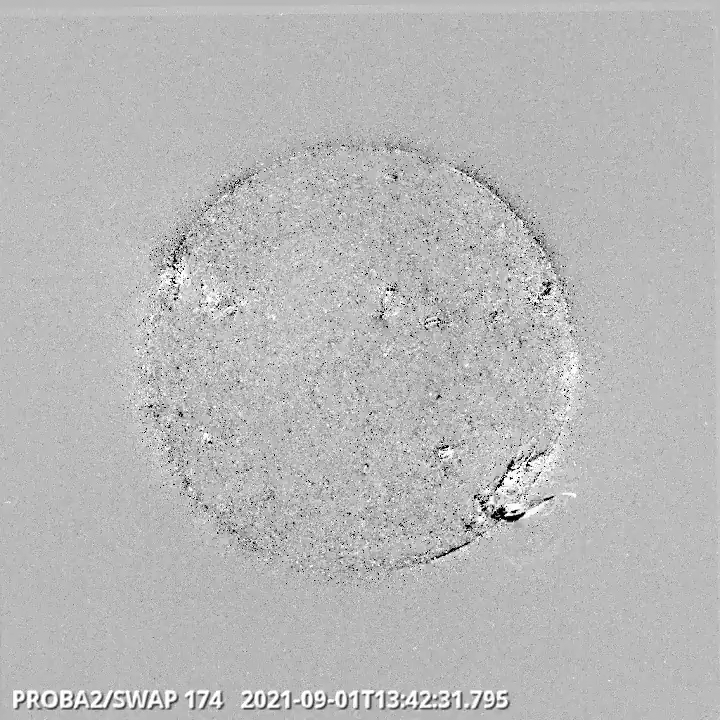
Filament brightening in the south-west around 13:40UT, no associated coronal mass ejection was observed - SWAP difference image
Find a movie of the event here (SWAP difference movie): https://proba2.sidc.be/swap/data/mpg/movies/20210901_swap_diff.mp4
Sunday September 5
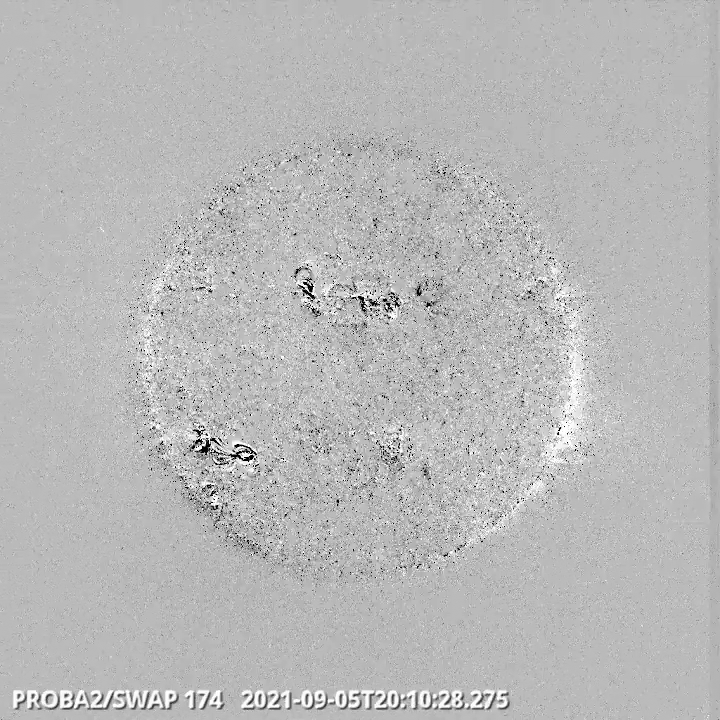
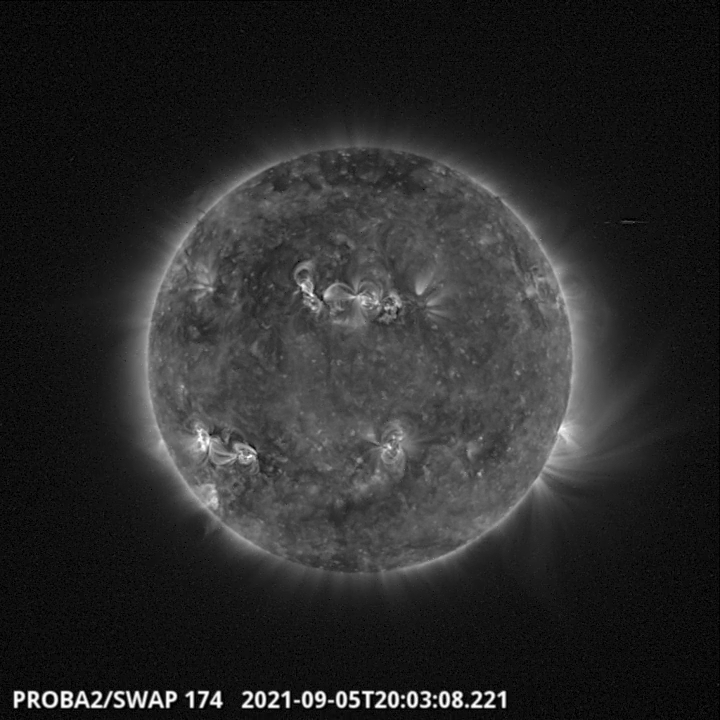
An EUV dimming and EUV wave can be seen in the northern hemisphere starting around 20UT. This is indicative of a CME initiation. No strong flare was associated with this eruption.
Find movies of the event here:
https://proba2.sidc.be/swap/data/mpg/movies/20210901_swap_diff.mp4 (SWAP difference movie)
http://proba2.sidc.be/swap/data/mpg/movies/20210905_swap_movie.mp4 (SWAP regular movie)
The International Sunspot Number by Silso
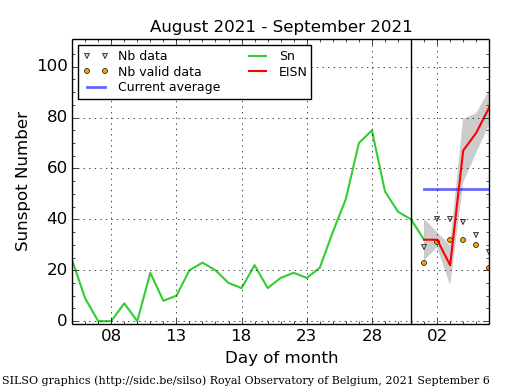
The daily Estimated International Sunspot Number (EISN, red curve with shaded error) derived by a simplified method from real-time data from the worldwide SILSO network. It extends the official Sunspot Number from the full processing of the preceding month (green line), a few days more than one solar rotation. The horizontal blue line shows the current monthly average. The yellow dots gives the number of stations that provided valid data. Valid data are used to calculate the EISN. The triangle gives the number of stations providing data. When a triangle and a yellow dot coincide, it means that all the data is used to calculate the EISN of that day.
Review of geomagnetic activity
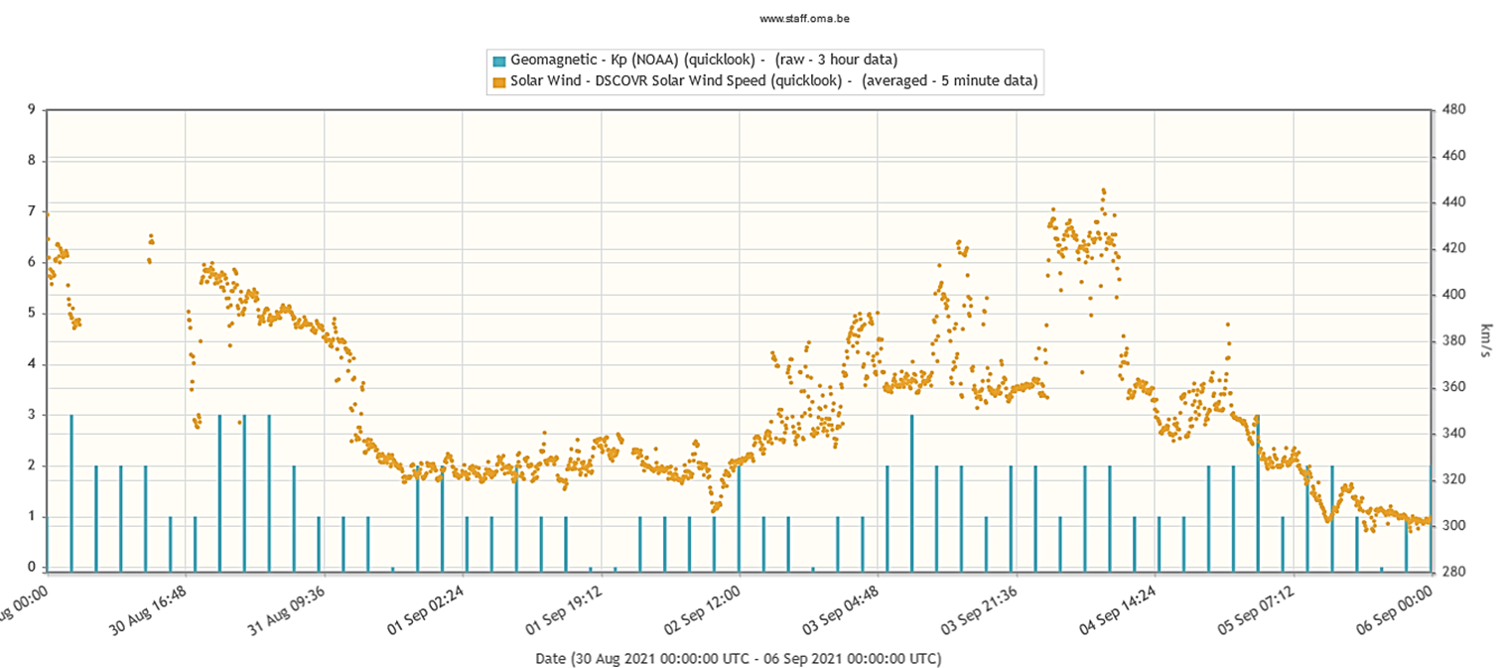
A slow solar wind regime was recorded throughout the week. Solar wind speed was in the the 300-450 km/s range and total magnetic field was essentially around a nominal 5nT with an unremarkable Bz component. There were no clear indications of the possible arrivals of the CMEs from August 26 or August 28.
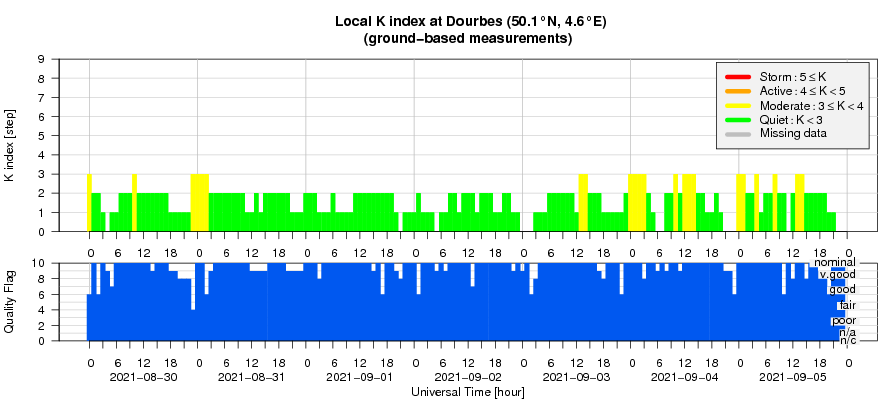
Geomagnetic conditions were quiet to unsettled (NOAA Kp and local K Dourbes mainly 0-3) with only a short local episode of active conditions (local K Dourbes reaching 4).
The graph underneath was created with STAFF (http://www.staff.oma.be/ ) and shows the evolution of the solar wind speed and the Kp-index during the reporting period.
Geomagnetic Observations at Dourbes (30 Aug 2021 - 5 Sep 2021)
The SIDC Space Weather Briefing
The Space Weather Briefing presented by the forecaster on duty from August 30 till September 05. It reflects in images and graphs what is written in the Solar and Geomagnetic Activity reports.
A pdf-version: https://www.stce.be/briefings/20210906_SWbriefing.pdf
The movie: https://www.stce.be/briefings/20210906_SWbriefing.wmv
Review of ionospheric activity (30 Aug 2021 - 5 Sep 2021)
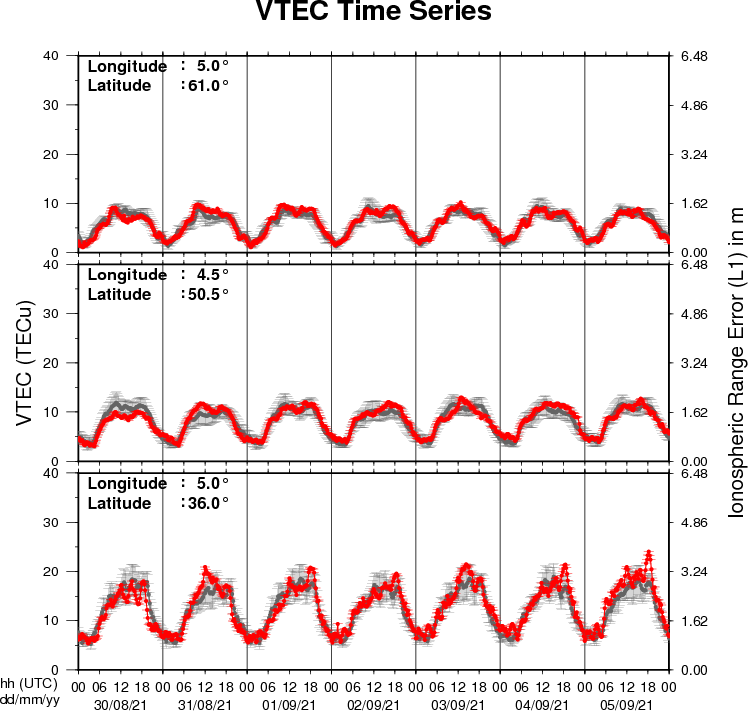
The figure shows the time evolution of the Vertical Total Electron Content (VTEC) (in red) during the last week at three locations:
a) in the northern part of Europe(N61°, 5°E)
b) above Brussels(N50.5°, 4.5°E)
c) in the southern part of Europe(N36°, 5°E)
This figure also shows (in grey) the normal ionospheric behaviour expected based on the median VTEC from the 15 previous days.
The VTEC is expressed in TECu (with TECu=10^16 electrons per square meter) and is directly related to the signal propagation delay due to the ionosphere (in figure: delay on GPS L1 frequency).
The Sun's radiation ionizes the Earth's upper atmosphere, the ionosphere, located from about 60km to 1000km above the Earth's surface.The ionization process in the ionosphere produces ions and free electrons. These electrons perturb the propagation of the GNSS (Global Navigation Satellite System) signals by inducing a so-called ionospheric delay.
See http://stce.be/newsletter/GNSS_final.pdf for some more explanations ; for detailed information, see http://gnss.be/ionosphere_tutorial.php