- Table of Content
- 1.Three announce...
- 2.Sun, Space, ST...
- 3.The largest so...
- 4.Review of sola...
- 5.PROBA2 Observa...
- 6.The Internatio...
- 7.Review of geom...
- 8.Geomagnetic Ob...
- 9.The SIDC Space...
- 10.Review of iono...
2. Sun, Space, STCE, and Sangria! (27 Sep 2021 - 3 Oct 2021)
3. The largest solar flare
4. Review of solar activity
5. PROBA2 Observations (27 Sep 2021 - 3 Oct 2021)
6. The International Sunspot Number by Silso
7. Review of geomagnetic activity
8. Geomagnetic Observations at Dourbes (27 Sep 2021 - 3 Oct 2021)
9. The SIDC Space Weather Briefing
10. Review of ionospheric activity (27 Sep 2021 - 3 Oct 2021)
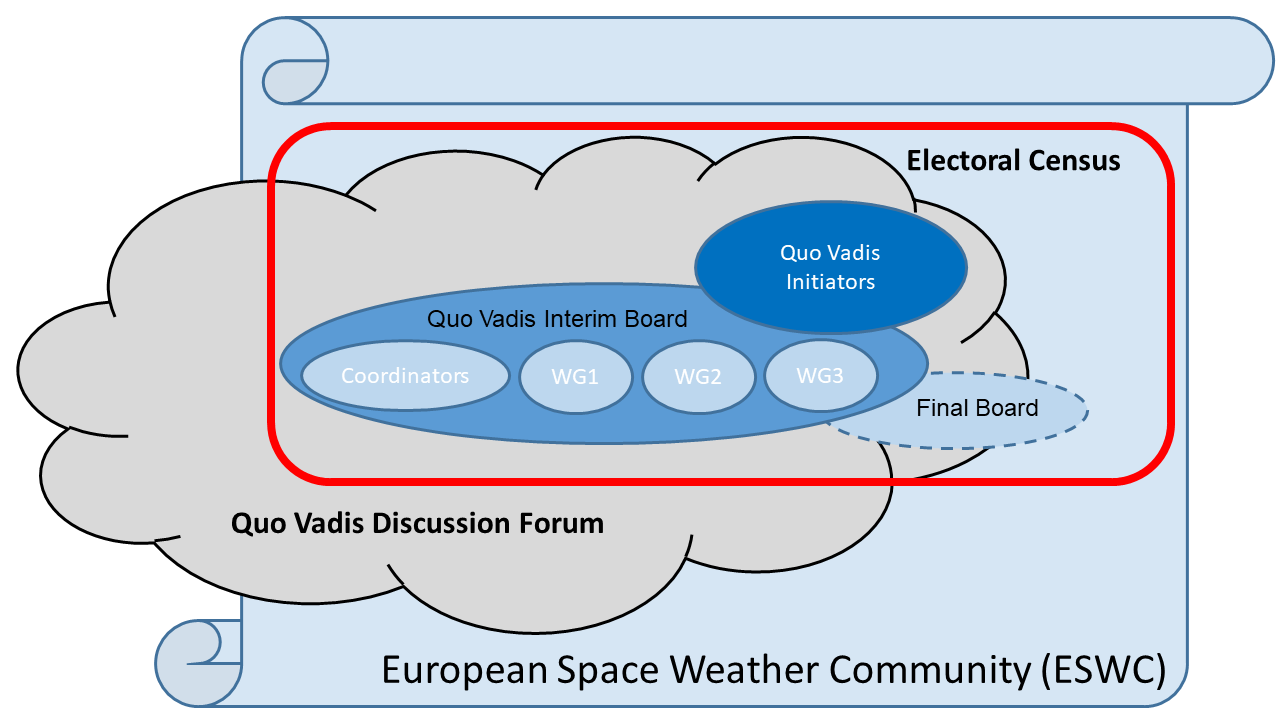
Three announcements from the Quo Vadis initiative
Dear colleagues,
We would like to draw your attention to the Quo Vadis European Space Weather initiative and make the following three announcements:
------------------------------------------------------------------------------------------------------------------------
#1 Announcement regarding the vote for the name of the new Association
------------------------------------------------------------------------------------------------------------------------
We are currently collecting suggestions for the name of the new association via QuoVadis Slack workspace. Please submit your suggestions on QuoVadis Slack or by email to quovadis@space-weather.eu by Friday 8 October. On 11th - 15th October a poll will be launched on QuoVadis Slack workspace to select the top five names.
On 20th - 22nd October a final vote will be organised via online form to select the final name for the future association. All QuoVadis Slack workspace participants and all those who requested to vote for the first QuoVadis vote (28-30 June 2021) will automatically be invited to vote. If you wish to vote and did not register to the first vote please make sure to register to the QuoVadis Slack Workspace on https://quovadis.aeronomie.be/discussion/discussion-registration-form by 15 October. The results of the vote will be announced during SWWT session of ESWW on October 27th 2021.
------------------------------------------------------------------------------------------------------------------------
#2 Announcement of the Layout and Statutes of the new Association
------------------------------------------------------------------------------------------------------------------------
We are opening a public discussion on the QuoVadis Slack workspace regarding the layout and the Statutes of the new Association as proposed by the Interim board of the Quo Vadis initiative. The draft version of the Statutes is available at our website (https://quovadis.aeronomie.be/discussion/discussion-topics/6-statutes). You are invited to provide feedback on these draft statutes on the QuoVadis Slack workspace or by email to quovadis@space-weather.eu.
------------------------------------------------------------------------------------------------------------------------
#3 Announcement of the Topical discussion meeting at the ESWW2021
------------------------------------------------------------------------------------------------------------------------
We invite you to the topical discussion meeting "Quo Vadis European Space Weather and Space Climate Community?" (http://esww17.iopconfs.org/t07 ) at ESWW 2021 scheduled for Friday, 29 October 2021 11:15-12:30 local time (i.e. 12:15-13:30 CEST). In the scope of this TDM the efforts of the Quo Vadis initiative will be shortly presented and open for discussion and suggestions.
xxxxxxxxxxxxxxxxxxxxxxxxxxxxxxxxxxxxxxxxxxxxxxxxxxxxxxxxxxxxxxxxxxxxxxxxxxxxxxxxxxxxxx
ABOUT QUO VADIS INITIATIVE:
This initiative is organised by the Interim Board, a group of volunteers from the space weather and space climate community in Europe under the name "Quo Vadis European Space Weather Community?" (short: "QuoVadis") with the role to coordinate the efforts so that the space weather and space climate European community can:
1) Organise itself
2) Elect people to represent them
Those unaware of this initiative are invited to study the links at the end of this announcement. The future organisation of the European Space Weather Community will be open to everyone whose professional activity is in some way related to the Space Weather and Space Climate, stakeholders and many others.
More information on the initiative is available on the website:
https://quovadis.aeronomie.be
This discussion follows a white paper:
https://www.swsc-journal.org/articles/swsc/pdf/2021/01/swsc200098.pdf
To register for the QuoVadis Slack workspace, please use the registration form available on our website under 'Discussion'.
Sun, Space, STCE, and Sangria! (27 Sep 2021 - 3 Oct 2021)
The Solar-Terrestrial Centre of Excellence that combines research on sun, space and earth at the Belgian Space Pole will be present at the 4th Symposium on Space Educational Activities (SSEA), a European Space Agency-led congress that will be hosted by the Universitat Politecnica de Catalunya - BarcelonaTech in April in Barcelona. SSEA provides a forum for university students, professionals working in education, and other young professionals to present and discuss their experiences organising, running and/or participating in educational activities related to Space.
Sponsoring this event, STCE will promote its educational and outreach activities, with a special focus on the Space Weather Introductory Course (SWIC). This course familiarises space weather advisory staff, both military and civilian, with the science behind space weather as well as the services offered by our forecaster centre.
SSEA is an annual world congress for the young promises of the space sector. Anyone from undergraduate and graduate students, to postdocs and professors are welcome to present their works in space related fields. This is meant to be a student-focused conference, so student projects are strongly encouraged. Note that there are different scholarships available for students.
The event will take place next April 27-29th 2022 in Barcelona (Spain). A long-awaited opportunity to catch up with colleagues in person, after the pandemic outbreak. Join the STCE and don't miss the opportunity to discuss your research in a world-landmark as Barcelona! Social events will include interesting and cultural activities, to further enrich your experience.
Everyone interested is invited to submit abstracts. The Call for Abstracts will be open from 14th June to 1st November 2021. More information can be found in the conference website: https://sseasymposium.org/.
The Organising Committee and the STCE will welcome you there with enthusiasm!
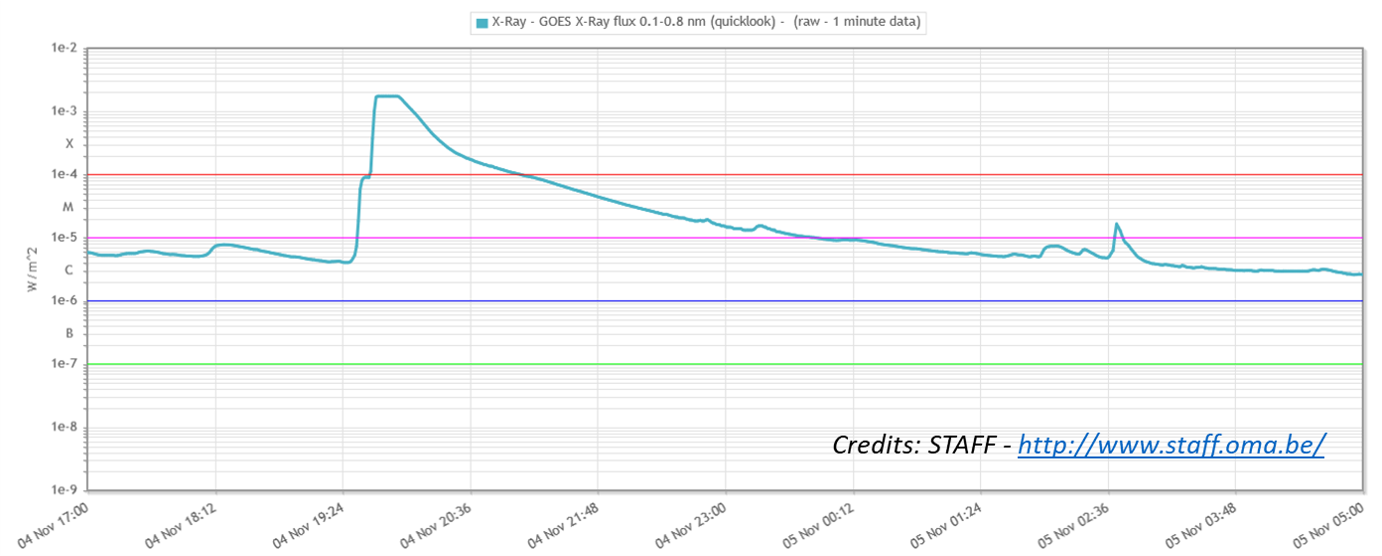
The largest solar flare
Solar flares can be ranked according to their peak energy output in x-ray (0.1-0.8 nm ; See the STCE's SWx classification scheme at https://www.stce.be/educational/classification#xray ). The scheme is labeled "CMX": C, M, and X stand for small (or "Common"), Medium, and large (or "eXtreme") flares. The range is logarithmic, each class being 10 times stronger than the previous one, and within each category ranging from 1 to 9 (e.g. a C9 flare, an M3 flare,...). The strongest solar flare since the start of the GOES measurements in 1976 took place on 4 November 2003. The eruption saturated the GOES x-ray sensor at X17.4, but subsequent analysis has put the most likely peak strength near X35 +/-5. The evolution of the flare can be seen in the graph underneath and was generated using the online STAFF tool (http://www.staff.oma.be/ ). Notice the saturation at X17.4 for 12 minutes, thus requiring some statistical methodologies to infer the most likely peak flux. The peak x-ray flux for the Carrington event is thought to have been X45 +/-5, but of course there were no GOES satellites to measure this flare back then (see the Cliver and Dietrich (2013) article in JSWSC at https://ui.adsabs.harvard.edu/abs/2013JSWSC...3A..31C/abstract ).
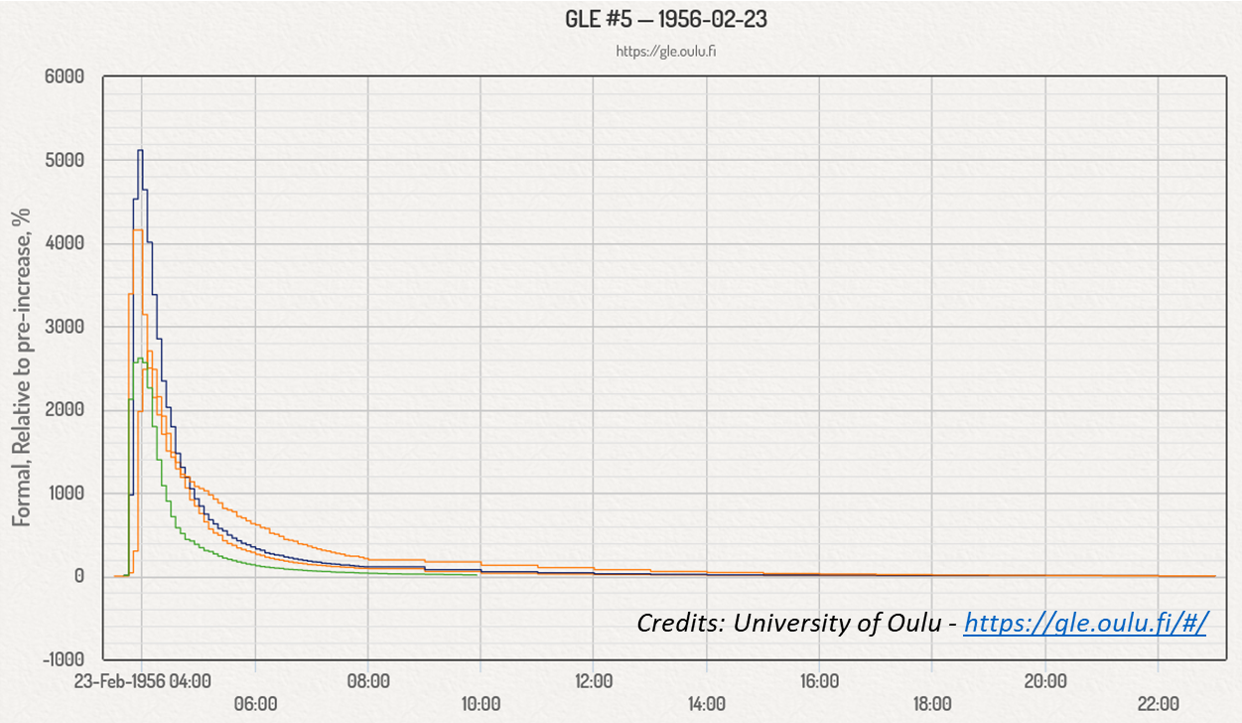
During strong solar eruptions, it can also (but not always) happen that protons are accelerated to energies ranging from as low as 1 MeV to as high as 100 GeV (see the SWx acronym list at https://www.stce.be/educational/acronym for units). When the greater than 10 MeV proton flux reaches a threshold of 10 pfu (proton flux units), it is called a proton event. Since systematic GOES measurements started in 1976, only 268 proton events have been registered, an average of about 60 events per decade. During this period, the largest event took place in March 1991 and reached a peak of 43.000 pfu. Protons interact with particles in the Earth's upper atmosphere. When the protons have energies greater than 430 MeV, the secondary particles that are created from these interactions can reach the Earth's surface and be measured by neutron monitors such as in Dourbes (see the NMDB at https://www.nmdb.eu/ ). These are called Ground Level Enhancements (GLEs) and are very rare. In fact, since the first measurements started in 1942, only 72 GLEs have been recorded, an average of not even 1 per decade. The largest GLE recorded by modern instrumentation is the 23 February 1956 event, which had a greater than 430 MeV fluence (i.e. accumulated number of protons over the event) about 2.5 times as large as the second strongest event on the list, an episode of five strong GLEs from August through October 1989. Underneath is a graph created from the Oulu GLE webpage at https://gle.oulu.fi/#/ showing the evolution of the 1956 GLE compared to the pre-event values. Other GLEs have much lower intensities or are much spikier (i.e. short-lived).
The secondary particles responsible for the GLEs may also deposit themselves in trees and ice. Increases in Carbon-14 concentrations in tree rings as well as increases in Beryllium-10 and nitrate in ice cores have been attributed to (solar and galactic) cosmic-ray events. In 2012, Dr Miyake from the Nagoya University in Japan and her collaborators made an important discovery (see the article in Nature at https://ui.adsabs.harvard.edu/abs/2012Natur.486..240M/abstract ). From measurements in Japanese tree rings, they found a truly astonishing increase in Carbon-14 concentration in 774-775AD. Analysis and modeling of the energies of the associated particles revealed that the 774-775AD event scaled up being 30 to 70 times larger than the 1956 GLE. An initial analysis seemed to rule out a solar flare as the culprit for this gargatuan GLE. Possible causes that were investigated were a galactic short-duration gamma burst, or a nearby supernova amongst other. However, in the subsequent years the event was also detected in other tree samples and ice cores, and also the discovery of two similar increases as the one in 774-775AD (in 993-994AD and in 660BC) argued against these other potential causes.

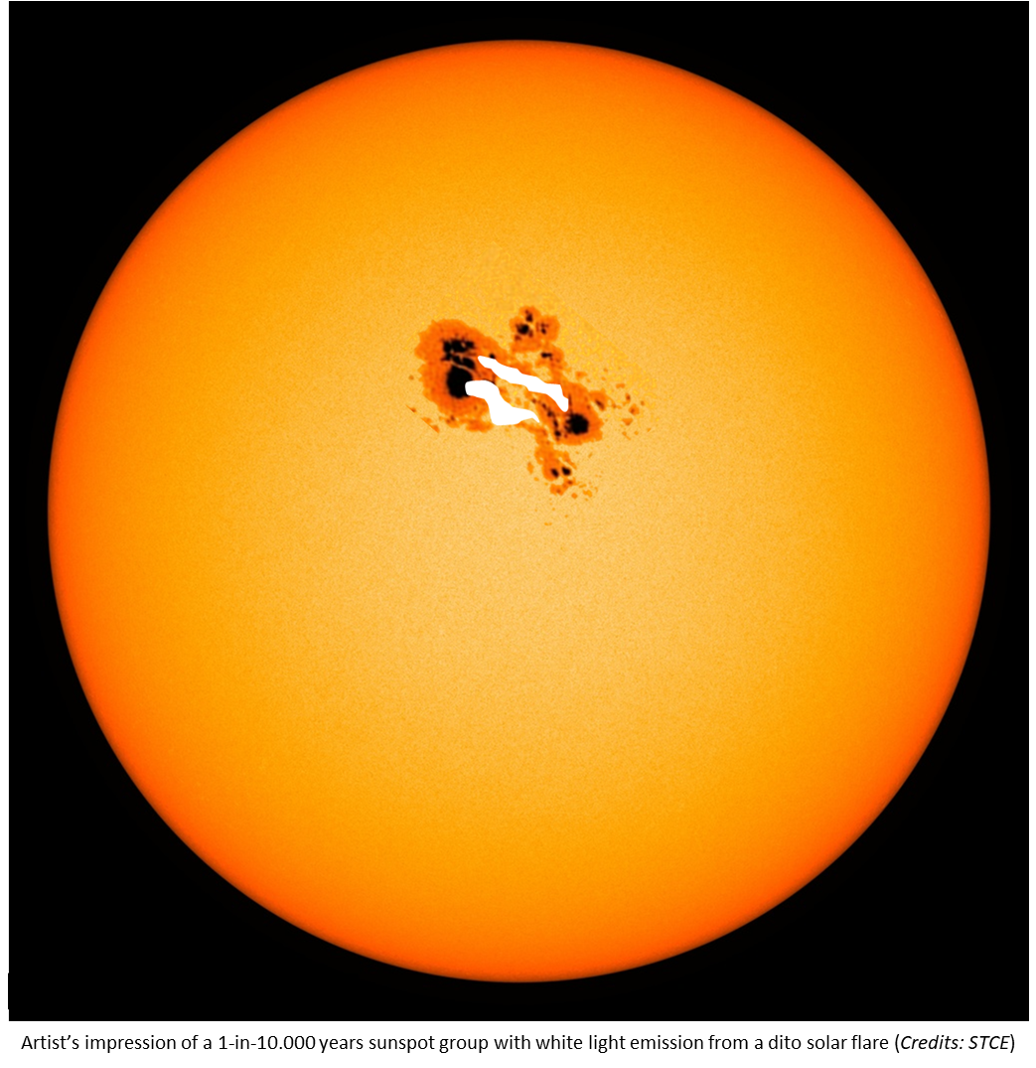
Last week, the XVIIth Hvar Astrophysical Colloquium took place in Hvar, Croatia. One of the keynote lectures was given by Dr Cliver from the National Solar Observatory (USA). The presentation is online at https://oh.geof.unizg.hr/index.php/en/meetings/xvii-hac/programme From a statistical analysis of the sunspot groups available since 1874 (see the Solar Cycle Science webpage at http://solarcyclescience.com/ ), he and his collaborators concluded that there's a 1-in-10.000 years chance on a sunspot group with an area up to 11.000 or 26.000 MH (millionths of a solar hemisphere), pending the methodology used. For comparison, the largest group over the last 150 years was visible in April 1947 and reached an area of 6132 MH. A similar analysis applied on the GOES solar flare data since 1976 indicated that the Sun can produce a flare peaking at X200 or X310, again depending on the statistics used. Comparing with previous work from other research teams, it was concluded that the Sun, in its current state, would be able to produce an X400 +/-200 flare, and that this was a conservative estimate.
But would the solar flare of 774-775AD fit within these peak constraints? To evaluate this, Cliver and his team first derived a peak range for the flare responsible for the colossal 1956 GLE. Though there are of course no GOES measurements available for that time, there are H-alpha, white-light, radio, indirect soft x-ray observations (via sudden ionospheric disturbances) available that can help to constrain the size of the 1956 flare. After careful consideration, they settled for a value in the range X10-X30. Then, based on the existing high-energy proton fluence data (energies greater than 430 MeV, greater than 200 MeV), using the 1956 data as a bridge, and taking into account that the 774-775AD and 1956 GLEs had a much harder "spectrum" (i.e. consisted of more energetic protons) than the modern day era events, they inferred a peak of X285 +/-140 for the flare responsible for the 774-775AD event. The intensity of the flare may be even a bit lower, if there were multiple flaring events involved similar as what happened during the August-October 1989 period. Three X140 +/-70 flares or 2 X180 +/-90 flares may result in a similar fluence for the 774-775AD event as a single X285 flare.
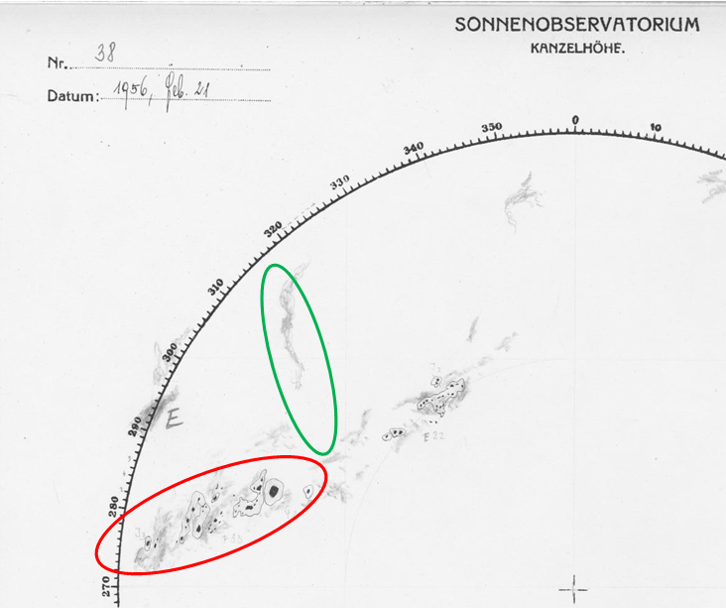
Finally, the inferred strength of the source flare may also be a bit lower than calculated if there were pre-existing conditions favoring the acceleration of protons, such as e.g. an elevated proton background from earlier proton events from the same active region. Also, recently, researchers such as Kong et al. (2019 - https://ui.adsabs.harvard.edu/abs/2019ApJ...883...49K/abstract ) have drawn attention to the potential importance of the magnetic field topology in the vicinity of an eruptive flare. Simulations showed that particles were accelerated more efficiently at high energies when a laterally propagating shock encountered a streamer rather than a simple radial field. The acceleration of particles to more than 100 MeV mainly occurs in the shock-streamer interaction region, due to the perpendicular shock geometry and the trapping effect of closed magnetic fields. Interestingly, the February 1956 event seems to represent such a case, as can be seen in the annotated Kanzelhöhe drawing underneath (21 February - http://cesar.kso.ac.at/ ), with the filament highlighted by the green ellipse and the source region of the event marked by the red ellipse.
The details of the research can be found in the online article: Cliver, E.W.; Hayakawa, H.; Love, J.J.; Neidig, D.F. 2020. On the Size of the Flare Associated with the Solar Proton Event in 774 AD. The Astrophysical Journal, 903, 1, 41. https://doi.org/10.3847/1538-4357/abad93
The related presentation at the XVIIth Hvar Conference is at https://oh.geof.unizg.hr/index.php/en/meetings/xvii-hac/programme (Extreme solar and solar-terrestrial events).
Review of solar activity
At the beginning of the week, NOAA regions 2871 (beta-gamma magnetic field configuration), 2872 (beta), 2877 (beta) and 2878 (beta) were present on the side of the Sun facing Earth. NOAA AR 2880 (beta) and 2881 (alpha) appeared on 29 September. Solar activity was low, only minor C-class flaring was observed from ARs 2871, 2877 and 2880. Only AR 2880 was still visible at the end of the week.
An Earth directed partial halo Coronal Mass Ejection (CME) was observed on 28 September at 07:00 UT by LASCO-C2. The CME was related to the C1.6 flare from AR2871. The speed of the CME was calculated to be 934 km/s, with an expected arrival time to the Earth on 30 September around 18:00 UT.
No relevant coronal holes were observed this week. The southern extension of the north polar coronal hole had crossed the central meridian the previous week on 22 September.
The greater than 10 MeV proton flux was below the threshold the full week. The greater than 2 MeV electron flux remained below the 1000 pfu during the week. The 24-hour electron fluence was at normal levels during the whole week.
PROBA2 Observations (27 Sep 2021 - 3 Oct 2021)
Solar Activity
Solar flare activity fluctuated from very low to low during the week.
In order to view the activity of this week in more detail, we suggest to go to the following website from which all the daily (normal and difference) movies can be accessed: https://proba2.oma.be/ssa
This page also lists the recorded flaring events.
A weekly overview movie can be found here (SWAP week 601). https://proba2.oma.be/swap/data/mpg/movies/weekly_movies/weekly_movie_2021_09_27.mp4
Details about some of this week's events can be found further below.
If any of the linked movies are unavailable they can be found in the P2SC movie repository here https://proba2.oma.be/swap/data/mpg/movies/
Wednesday Sep 29
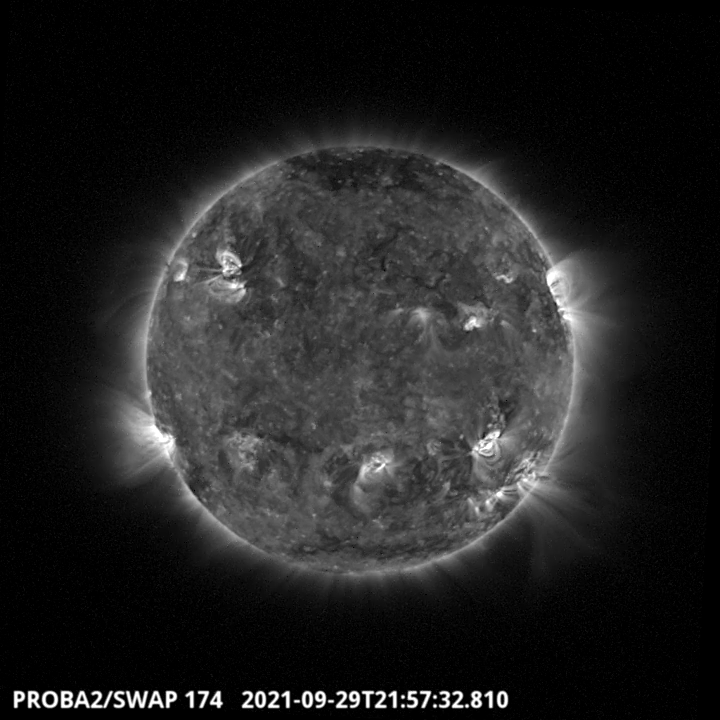
The largest flare of the week, a C2.8 flare, was observed by SWAP and LYRA. The flare is visible in the South-West quadrant of the Sun on 2021-Sep-29, as shown in the SWAP image above taken at 21:57 UT. Find a movie of the event here (SWAP movie). https://proba2.oma.be/swap/data/mpg/movies/20210929_swap_movie.mp4
The International Sunspot Number by Silso
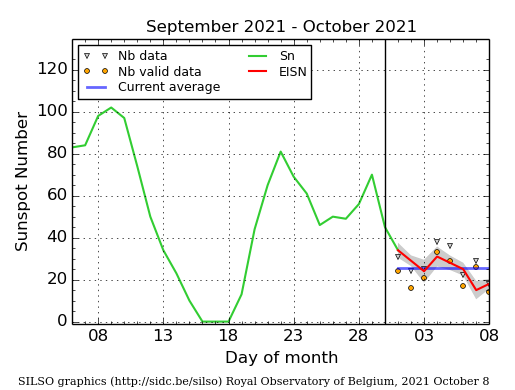
The daily Estimated International Sunspot Number (EISN, red curve with shaded error) derived by a simplified method from real-time data from the worldwide SILSO network. It extends the official Sunspot Number from the full processing of the preceding month (green line), a few days more than one solar rotation. The horizontal blue line shows the current monthly average. The yellow dots gives the number of stations that provided valid data. Valid data are used to calculate the EISN. The triangle gives the number of stations providing data. When a triangle and a yellow dot coincide, it means that all the data is used to calculate the EISN of that day.
Review of geomagnetic activity
An ICME (corresponding to the CME from 23 September) arrived to the Earth on 27 September, with a speed around 400 km/s and a magnetic field slightly above 10 nT (with positive Bz). It was followed a few hours later by a high speed stream from the low latitudinal extension of the northern polar coronal hole, with speeds up to 550 km/s.
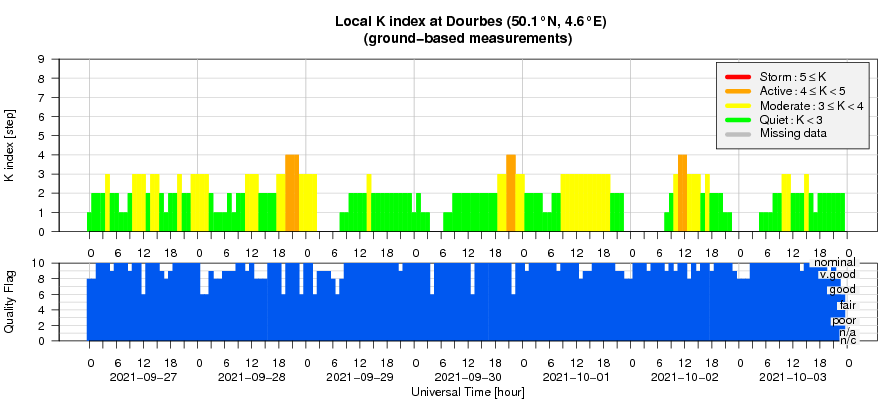
A period of active conditions was observed locally at Dourbes in response (K Dourbes = 4).
A second ICME, corresponding to the CME from 28 September, arrived to the Earth on 30 September, with a magnetic field up to 15 nT and speed up to 550 km/s. After a long sheath region, a flux rope was observed (WNE orientation).
Since Bz was positive, only active conditions were observed (Kp and K dourbes up to 4).
Geomagnetic Observations at Dourbes (27 Sep 2021 - 3 Oct 2021)
The SIDC Space Weather Briefing
The Space Weather Briefing presented by the forecaster on duty from Sept 26 to Oct 3. It reflects in images and graphs what is written in the Solar and Geomagnetic Activity report.
A pdf-version: https://www.stce.be/briefings/20211004_SWbriefing.pdf
The movie: https://www.stce.be/briefings/20211004_SWbriefing.m4v
Review of ionospheric activity (27 Sep 2021 - 3 Oct 2021)
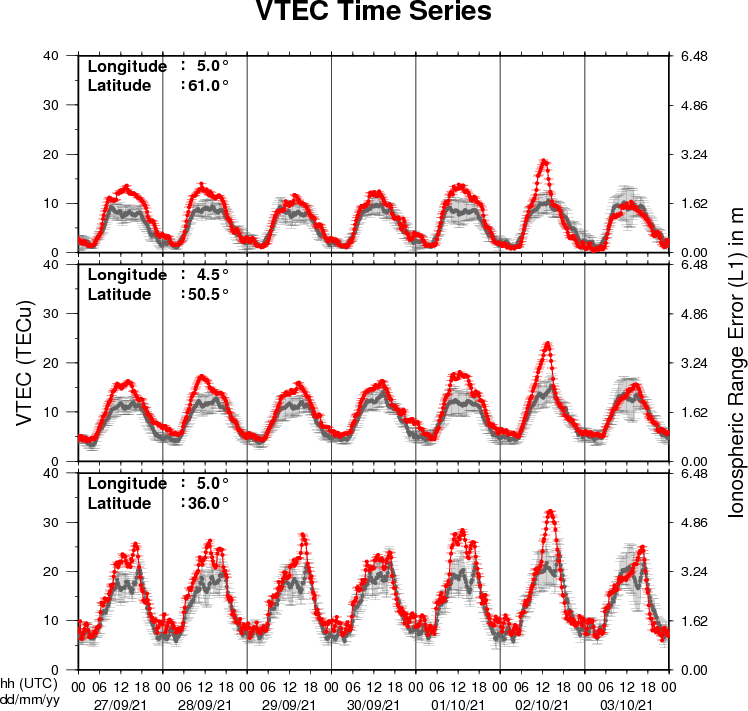
The figure shows the time evolution of the Vertical Total Electron Content (VTEC) (in red) during the last week at three locations:
a) in the northern part of Europe(N61°, 5°E)
b) above Brussels(N50.5°, 4.5°E)
c) in the southern part of Europe(N36°, 5°E)
This figure also shows (in grey) the normal ionospheric behaviour expected based on the median VTEC from the 15 previous days.
The VTEC is expressed in TECu (with TECu=10^16 electrons per square meter) and is directly related to the signal propagation delay due to the ionosphere (in figure: delay on GPS L1 frequency).
The Sun's radiation ionizes the Earth's upper atmosphere, the ionosphere, located from about 60km to 1000km above the Earth's surface.The ionization process in the ionosphere produces ions and free electrons. These electrons perturb the propagation of the GNSS (Global Navigation Satellite System) signals by inducing a so-called ionospheric delay.
See http://stce.be/newsletter/GNSS_final.pdf for some more explanations ; for detailed information, see http://gnss.be/ionosphere_tutorial.php