- Table of Content
- 1.The Day After....
- 2.Review of sola...
- 3.PROBA2 Observa...
- 4.The Internatio...
- 5.Noticeable Sol...
- 6.Review of geom...
- 7.Geomagnetic Ob...
- 8.The SIDC Space...
- 9.Review of iono...
- 10.Action!
2. Review of solar activity
3. PROBA2 Observations
4. The International Sunspot Number by Silso
5. Noticeable Solar Events (8 Nov 2021 - 14 Nov 2021)
6. Review of geomagnetic activity
7. Geomagnetic Observations in Belgium
8. The SIDC Space Weather Briefing
9. Review of ionospheric activity
10. Action!
The Day After...
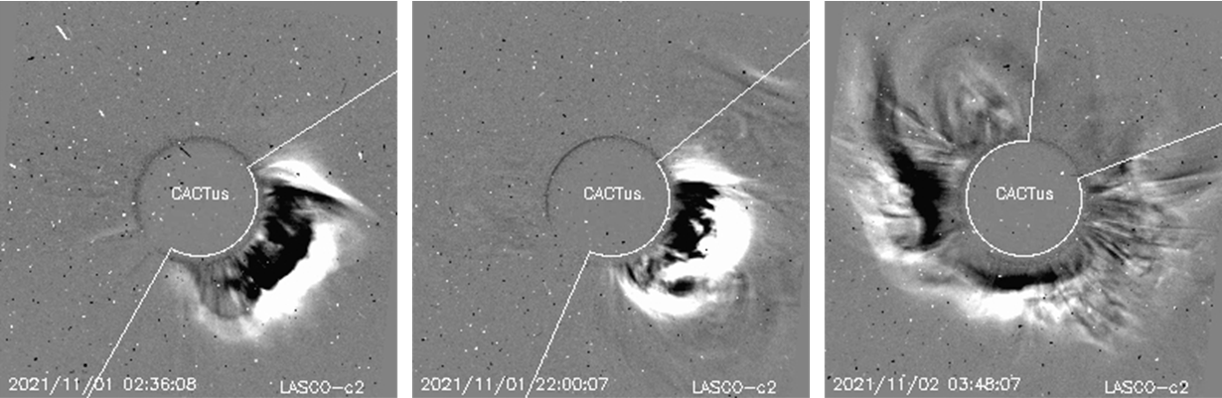
Solar activity was enhanced late October and early November, with the 2nd X-class flare, the 2nd proton event and the first Ground Level Enhancement (GLE) of the current solar cycle (SC25) - as extensively discussed in this Newsitem at https://www.stce.be/news/558/welcome.html Several coronal mass ejections (CMEs) were associated with the flaring activity during this period, as can be seen in the SOHO/LASCO (CACTus - https://wwwbis.sidc.be/cactus/catalog.php ) coronagraphic imagery underneath. In particular, a fast earth-directed CME associated with flaring activity in NOAA 2891 on 2 November was thought to catch up with slower CMEs related to flaring events in NOAA 2887 on 1 November. This type of CME is called a cannibal CME as it overtakes the slower CMEs in front of it, thus creating more complex and enhanced magnetic fields which may result in stronger geomagnetic storms than one would expect.
The catching-up and subsequent propagation towards Earth can be seen in images made by the Heliospheric Imager 2 (HI-2) onboard the STEREO-A spacecraft (https://stereo-ssc.nascom.nasa.gov/ ), which is currently trailing the Earth by about 37 degrees. The HI-2 instrument has a 70 degrees field of view and is off-pointed from the Sun direction by 53.7 degrees, with its optical axis aligned in the ecliptic plane. This arrangement provides coverage by HI-2 over solar elongation angles from 18.7 to 88.7 degrees at the viewpoints of the spacecraft, thereby allowing the observation of Earth-directed CMEs along the Sun�Earth line to the vicinity of the Earth and beyond (Eyles et al. 2009, https://link.springer.com/article/10.1007/s11207-008-9299-0 ). The difference images (one image subtracted from the previous) underneath show - in the plane-of-the-sky as seen by STEREO-A - how the "slow" CME gets gobbled up by mainly the southern portion of the "fast" CME which then continues its transit towards the Earth. A clip is available in the online version of this article at https://www.stce.be/news/561/welcome.html
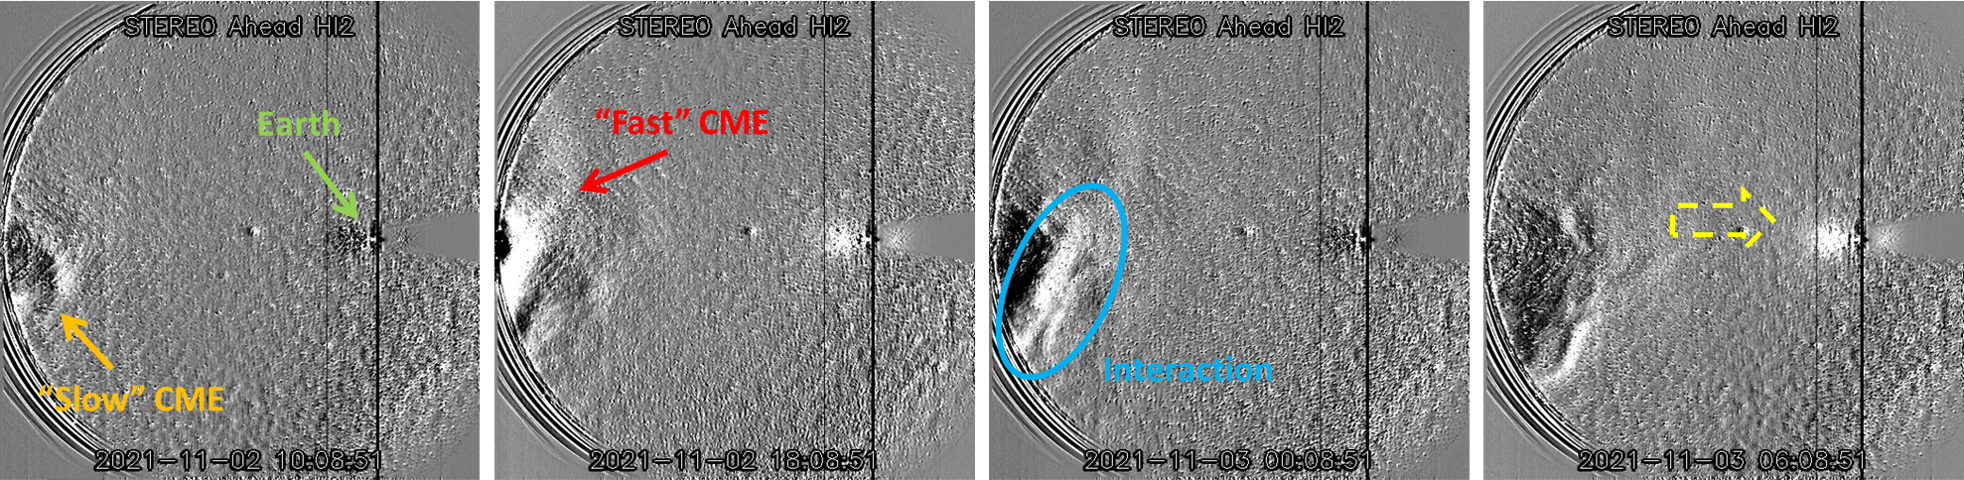
The interplanetary CME (ICME) arrived at 19:24UT on 3 November when a shock was observed in the solar wind. The shock drove the greater than 10 MeV proton flux back above the alert threshold of 10 pfu (20:55UT), but too briefly (only one single 5-minutes data point...) to be recognized as a genuine proton event. Solar wind speed went up well over 700 km/s with some periods of significant and sustained southward magnetic field orientation, Bz getting as low as -18 nT. This resulted in a strong geomagnetic storm with the Dst index reaching -115 nT and as such descending for the first time this solar cycle under -100 nT (Kyoto World Data Center, http://wdc.kugi.kyoto-u.ac.jp/dst_realtime/202111/index.html ). The magnetic shielding provided by this strong ICME resulted in a significant decrease in the harmful cosmic rays, as recorded by neutron monitors around the world (a so-called "Forbush decrease"). The neutron monitor in Oulu, Finland (http://cosmicrays.oulu.fi/ ) showed a brief but sharp decrease of 11% in the 1-hour count rates compared to undisturbed levels (see graph below).
In response to these particular solar wind conditions, the high-energy (greater than 2 MeV) electron flux didn't take long to also start an increase, although the fluxes remained relatively modest. Measured by the GOES satellites in their geostationary orbit, which is located in the Earth�s outer radiation belt, these electrons are associated with a type of spacecraft charging referred to as deep-dielectric charging. The electrostatic discharges that may occur between the electronic components may cause anomalous satellite behavior which may in turn result in a temporal or complete impairment of a satellite. Hence their nickname "killer electrons". See the SWx Classification page at https://www.stce.be/educational/classification#electrons and this STCE Newsitem at https://www.stce.be/news/513/welcome.html for more info. In this case though, the mild fluxes that were recorded did not harm any satellite.
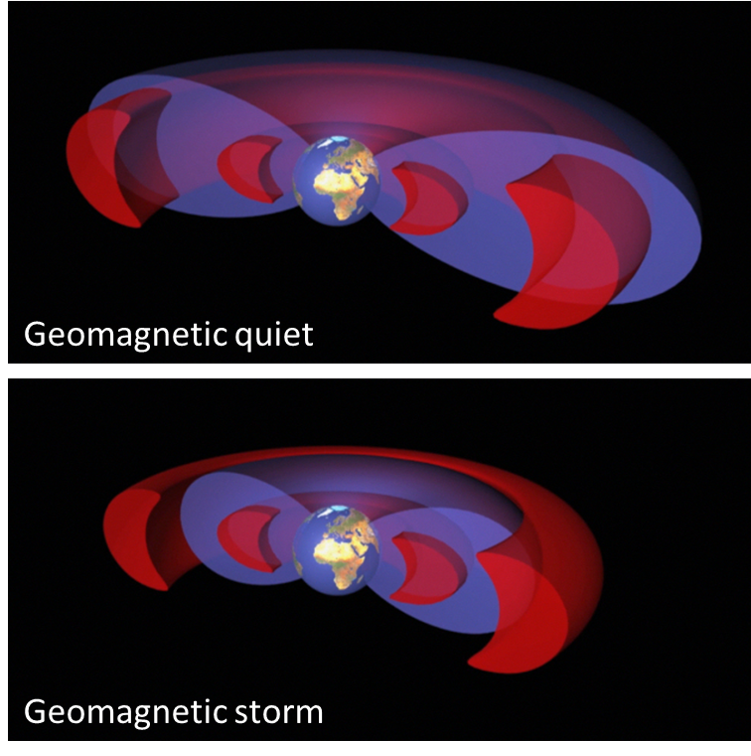
Interestingly, also a mild excursion of the outer radiation belt into the slot region was observed. This is a region between the inner and outer radiation belt which is usually devoid of high-energy particles and a kind of safe haven for satellites. In fact, the electrons that are present there belong to the plasmasphere, a doughnut-shaped region of low energy charged particles (cold plasma) centred around the planet's equator and rotating along with it. The ESA sketch above (https://sci.esa.int/web/cluster/-/52831-earth-plasmasphere-and-the-van-allen-belts ) shows for geomagnetically quiet (top) and disturbed (bottom) conditions the radiation belts in red and the plasmasphere in blue.
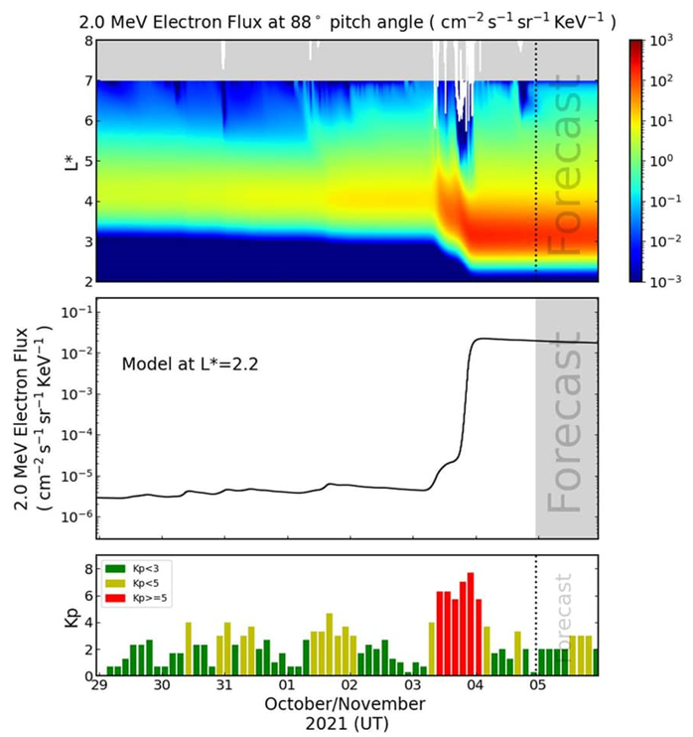
The gentle movement by the outer radiation belt into part of the slot region started on 3-4 November, as suggested by the observations-driven Radiation Belt Model from the British Antarctic Survey (BAS-RBM ; https://www.bas.ac.uk/science/research-models/bas-radiation-belt-model-bas-rbm/), available at the ESA/SSA website (SSA: Space Situational Awareness; https://swe.ssa.esa.int/sarif-federated ). The top chart below shows from 29 October till 5 November the evolution of the 2 MeV electron flux (colored) in the slot region and outer radiation belt, characterized by the L*-shell (vertical axis) which -for the purpose of this article- can be understood as the distance to the Earth's centre expressed in earth radii. The middle graph shows the electron flux at L*=2.2 proper, while the lower graph shows the Kp index for the same period.
As the ICME arrived late on 3 November and the strong geomagnetic storm developed (Kp ranging from 5 to 7), the number of high-energy electrons started to increase (orange) and the outer radiation belt moved closer to Earth into the slot region. This situation persisted for a few days before recovering to the nominal state. Further analysis revealed that, whilst the model suggested that the slot region had been filled, in-orbit data from missions such as ARASE (https://www.isas.jaxa.jp/en/missions/spacecraft/current/erg.html ) indicate that this was probably not the case in this particular event. Regardless, the event itself and the output that models such as the BAS-RBM provide, are an exciting insight into what we can expect as Solar Cycle 25 progresses towards its maximum. We truly have a front row seat now to watch future developments of this dynamic portion in the magnetosphere!
This article was written with the kind contribution from Dave Pitchford (SES).
Review of solar activity
Solar activity was very low to moderate. Active region NOAA 2895 (beta) produced a C1.2 flare, peak on Nov 8, 07:51 UTC and a C1.0 flare, peak on Nov 8, 09:30 UTC. A long-duration M2-flare was measured on Nov 09th. NOAA AR 2891 was presumably the source. At the moment of the flare, it was still behind the solar limb. Flaring activity dropped after these events, besides a C1.2flare (peak time 08:43 UTC on Nov 13th) produced by active region NOAA 2895. This flare happened while a transient trailing spot developed behind this active region. It shortly increased its magnetic complexity to beta-gamma.
No Earth-directed coronal mass ejections (CMEs) were detected.
The greater than 10 MeV proton flux was enhanced on Nov 09th to Nov 10th due to the long-duration M-class flaring. The greater than 10 MeV proton flux was at background levels for the rest of the week.
The greater than 2 MeV electron flux was oscillating above the 1000 pfu threshold in the beginning and towards the end of the week. The electron fluence was at moderate levels at the beginning of the week, returned to nominal levels in the middle of the week and stayed at the border of nominal to moderate levels towards the end of the week.
PROBA2 Observations
Solar Activity
Solar flare activity fluctuated from very low to moderate during the week.
In order to view the activity of this week in more detail, we suggest to go to the following website from which all the daily (normal and difference) movies can be accessed: https://proba2.oma.be/ssa
This page also lists the recorded flaring events.
A weekly overview movie can be found here (SWAP week 607). https://proba2.oma.be/swap/data/mpg/movies/weekly_movies/weekly_movie_2021_11_08.mp4
Details about some of this week's events can be found further below.
If any of the linked movies are unavailable they can be found in the P2SC movie repository here https://proba2.oma.be/swap/data/mpg/movies/
Tuesday 9 Nov
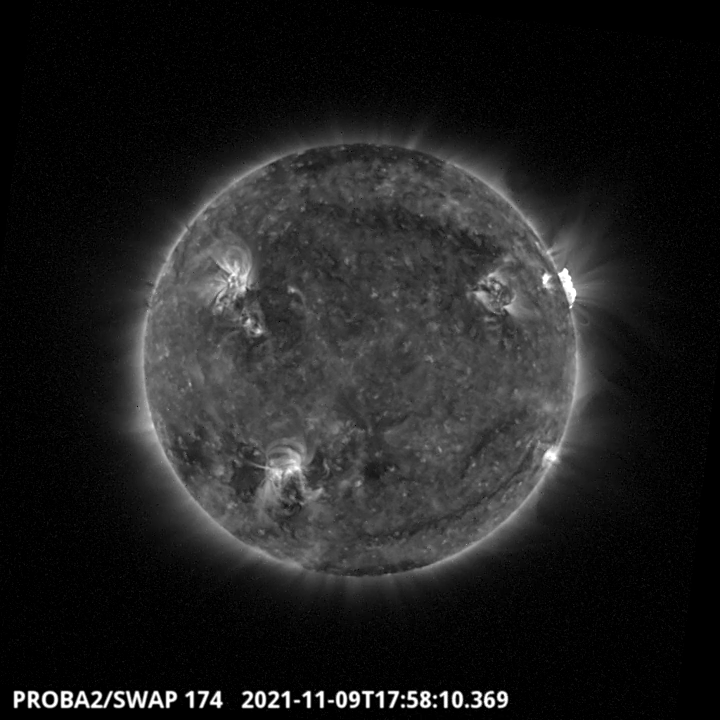
Post flare loops, i.e. magnetic structures which are formed after solar flares, can be seen on the SWAP image above around 17:58 UT. The active region located just behind the Sun's northwestern limb erupted as a long duration M2-class solar flare. This region has been labelled 2891 by NOAA. Find a movie of the events here (SWAP movie) https://proba2.oma.be/swap/data/mpg/movies/20211109_swap_movie.mp4
The International Sunspot Number by Silso
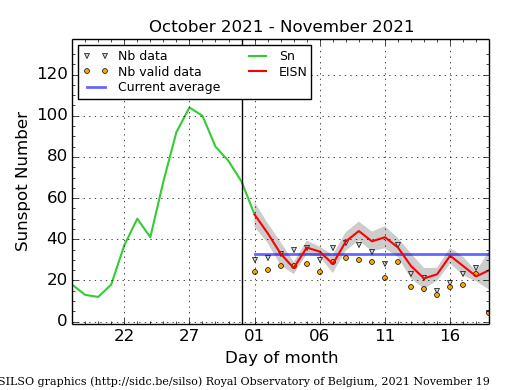
The daily Estimated International Sunspot Number (EISN, red curve with shaded error) derived by a simplified method from real-time data from the worldwide SILSO network. It extends the official Sunspot Number from the full processing of the preceding month (green line), a few days more than one solar rotation. The horizontal blue line shows the current monthly average. The yellow dots gives the number of stations that provided valid data. Valid data are used to calculate the EISN. The triangle gives the number of stations providing data. When a triangle and a yellow dot coincide, it means that all the data is used to calculate the EISN of that day.
Noticeable Solar Events (8 Nov 2021 - 14 Nov 2021)
| DAY | BEGIN | MAX | END | LOC | XRAY | OP | 10CM | TYPE | Cat | NOAA |
| 09 | 1547 | 1702 | 1737 | M2.0 | 2891 |
| LOC: approximate heliographic location | TYPE: radio burst type |
| XRAY: X-ray flare class | Cat: Catania sunspot group number |
| OP: optical flare class | NOAA: NOAA active region number |
| 10CM: peak 10 cm radio flux |
Review of geomagnetic activity
The solar wind parameters (based on DSCOVR and ACE data) reflected slow solar wind conditions. The maximum total magnetic field strength was at 7.2 nT with a lowest Bz value of -6.4 nT. The solar wind velocity started at values of up to 480 km/s at the beginning of the week and gradually decreased down to 291 km/s at the end of the week.
The geomagnetic conditions were mostly quiet. The passage of a faint dense solar wind structure late on Nov 08th caused globally unsettled and locally active geomagnetic conditions for the interval of 21:00 till midnight UTC. More unsettled periods were observed around midnight on Nov 10th and early morning of Nov 11th following the prolonged intervals with negative Bz.
Geomagnetic Observations in Belgium
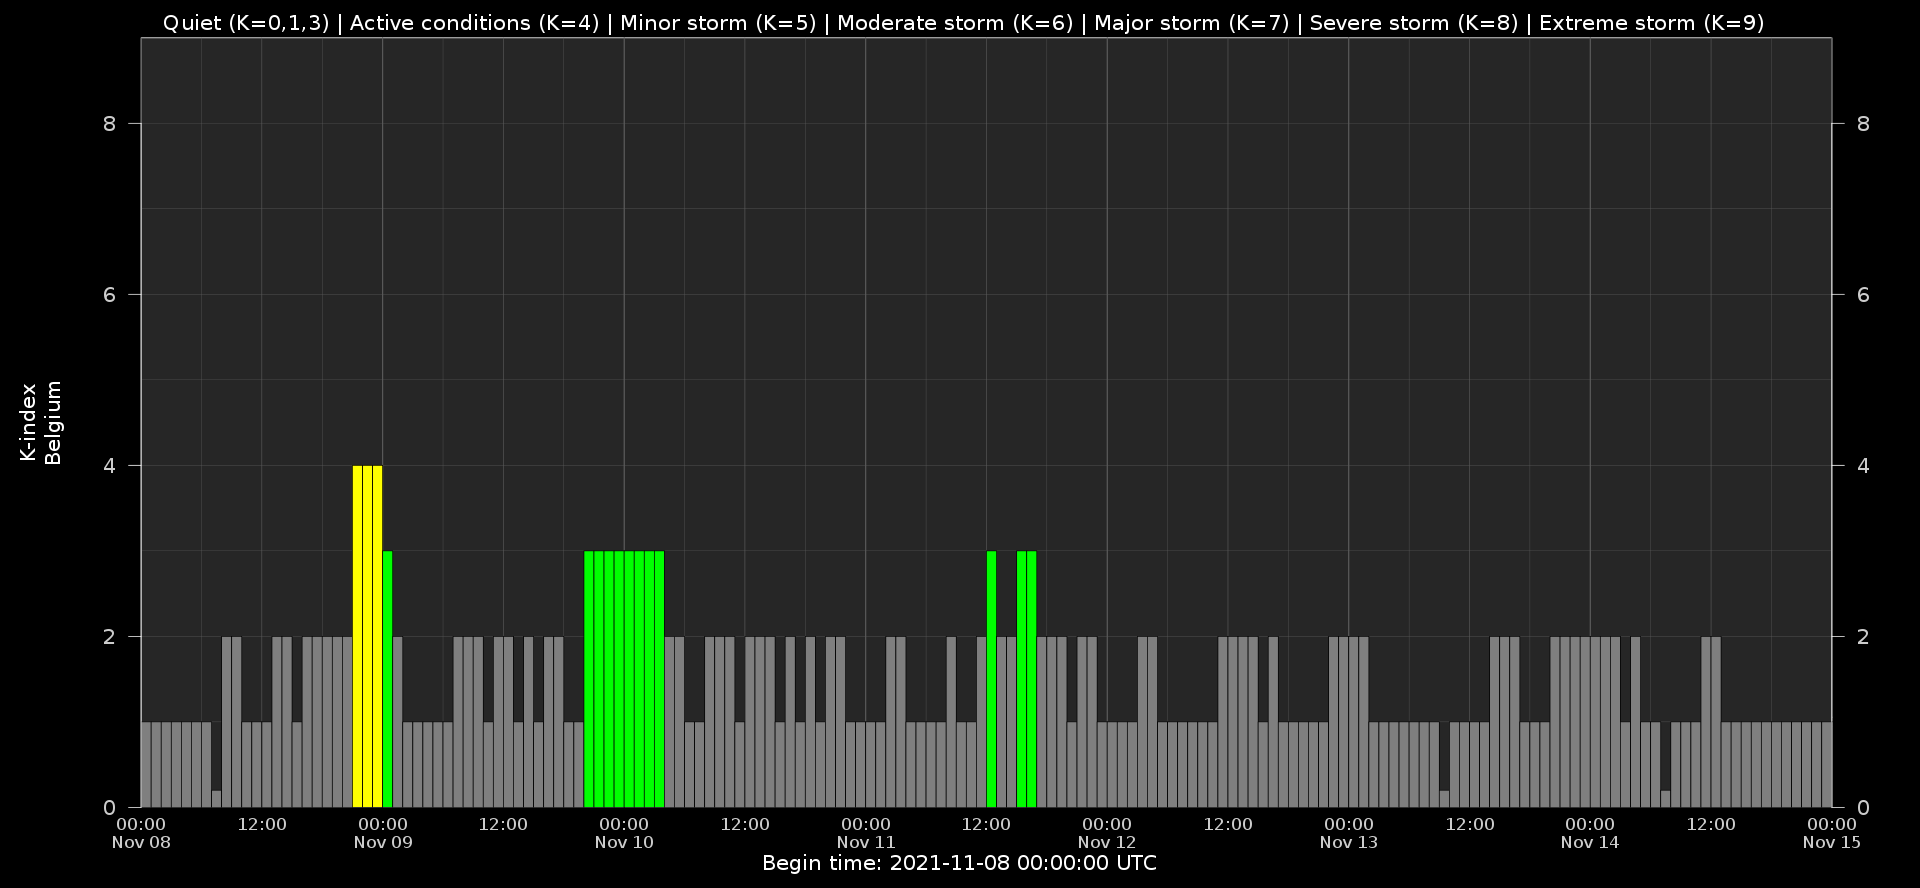
Local K-type magnetic activity index for Belgium based on data from Dourbes (DOU) and Manhay (MAB). Comparing the data from both measurement stations allows to reliably remove outliers from the magnetic data. At the same time the operational service availability is improved: whenever data from one observatory is not available, the single-station index obtained from the other can be used as a fallback system.
Both the two-station index and the single station indices are available here: http://ionosphere.meteo.be/geomagnetism/K_BEL/
The SIDC Space Weather Briefing
The Space Weather Briefing presented by the forecaster on duty from Nov 7 to 14. It reflects in images and graphs what is written in the Solar and Geomagnetic Activity report.

A pdf-version: https://www.stce.be/briefings/20211115_SWbriefing.pdf
The movie: https://www.stce.be/briefings/20211115_SWbriefing.m4v
Review of ionospheric activity
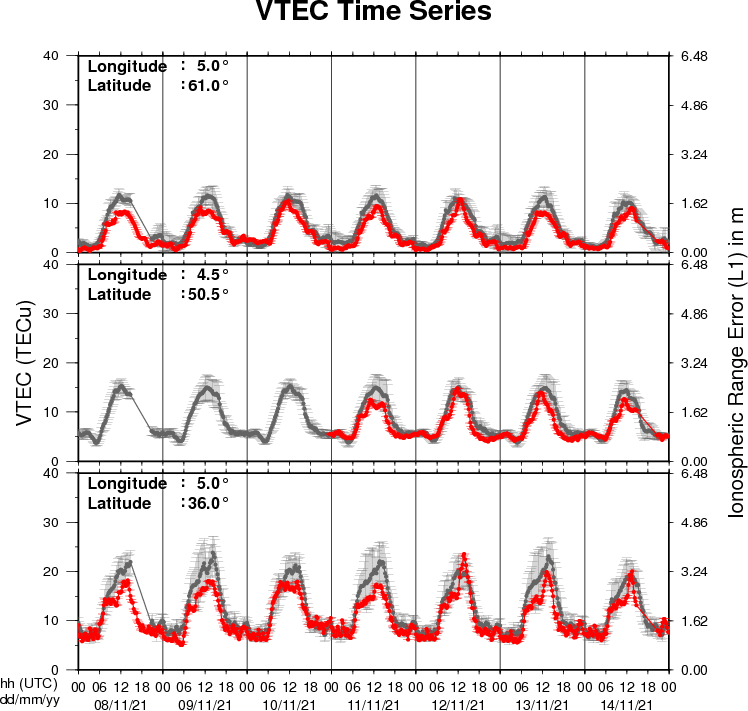
The figure shows the time evolution of the Vertical Total Electron Content (VTEC) (in red) during the last week at three locations:
a) in the northern part of Europe
b) above Brussels
c) in the southern part of Europe
This figure also shows (in grey) the normal ionospheric behaviour expected based on the median VTEC from the 15 previous days.
The VTEC is expressed in TECu (with TECu equals 10^16 electrons per square meter) and is directly related to the signal propagation delay due to the ionosphere (in figure: delay on GPS L1 frequency).
The Sun's radiation ionizes the Earth's upper atmosphere, the ionosphere, located from about 60km to 1000km above the Earth's surface.The ionization process in the ionosphere produces ions and free electrons. These electrons perturb the propagation of the GNSS (Global Navigation Satellite System) signals by inducing a so-called ionospheric delay.
See http://stce.be/newsletter/GNSS_final.pdf for some more explanations ;
For detailed information, see http://gnss.be/ionosphere_tutorial.php
Action!
Action!
Check out our activity calendar: activities and encounters with the Sun-Space-Earth system and Space Weather as main theme. We provide occasions to get submerged in our world through educational, informative and instructive activities.
If you want your event in our calendar, contact us: stce_coordination at stce.be
in 2021
* November 22 - 26, Online SWx introductory Course (SWIC), organisation by the STCE - complete
* November 28, Dag van de wetenschap, Brussels, Belgium - STCE will bring 'Panic in the Space Weather Room' (Dutch) - Cancelled due to the COVID-pandemic
* December 2, ISSI Game Changers Online Seminars: Tipping positive change to avoid climate tipping points
* December 3-4, Space Days at the Big Bang festival, STCE will bring 'Panic in the Space Weather Room' and 'PROBA2: micro-satellite and mega-success'
* December 9, ISSI Game Changers Online Seminars: Space Weather
* December 16, ISSI Game Changers Online Seminars: Sursurface Life on Earth and on Other Planets in the Solar System
In 2022
* January 25, Public Lecture on the Solar Corona in EUV (Dutch), Urania, Hove, Belgium
* February 14-18, online Space Weather Introductory Course by SWEC, Space Weather Education Center - registrations are open
* February 22, Public Lecture on Space Weather and Aviation (Dutch), Urania, Hove, Belgium
* February 26, Public Lecture on Space Weather, Satellites and Aviation (Dutch), UGent Volkssterrenwacht Armand Pien, Gent, Belgium
* March 14-16, onsite (!) Space Weather Introductory Course by SWEC, Space Weather Education Center - registrations are open
* April 28, Public Lecture on SDO/EUI, Astropolis, Oostende, Belgium
* August 25, Public Lecture on Space Weather and Aviation, Astropolis, Oostende, Belgium
* October 24-28, 18th European Space Weather Week, Zagreb, Croatia
Check: https://www.stce.be/calendar