- Table of Content
- 1.Eugene Parker ...
- 2.Geomagnetic st...
- 3.Review of sola...
- 4.Review of geom...
- 5.PROBA2 Observa...
- 6.The Internatio...
- 7.Noticeable Sol...
- 8.Geomagnetic Ob...
- 9.The SIDC Space...
- 10.Review of iono...
- 11.Action!
2. Geomagnetic storms have a birthday party
3. Review of solar activity
4. Review of geomagnetic activity
5. PROBA2 Observations (7 Mar 2022 - 13 Mar 2022)
6. The International Sunspot Number by Silso
7. Noticeable Solar Events (7 Mar 2022 - 13 Mar 2022)
8. Geomagnetic Observations in Belgium (7 Mar 2022 - 13 Mar 2022)
9. The SIDC Space Weather Briefing
10. Review of ionospheric activity (7 Mar 2022 - 13 Mar 2022)
11. Action!
Eugene Parker (1927 - 2022)
NASA has just announced the passing away of Eugene Parker (10 June 1927 - 15 March 2022). More than 60 years ago, he proposed the existence of the solar wind and predicted that its magnetic field in the outer solar system would be in the shape of a spiral. These predictions were later confirmed by spacecraft measurements and the magnetic field lines would be called the Parker spiral. About 35 years ago, he also proposed that the solar corona might be heated by a large number of small flares ("nanoflares"), to explain the coronal heating problem. To honour his ground-breaking contributions on the solar wind, Parker became the first person to witness the launch of a spacecraft bearing his name. NASA's Parker Solar Probe continues its mission today in pursuit of the pioneering questions Parker first envisaged more than a half century ago.
The NASA press release can be found at https://www.nasa.gov/press-release/nasa-mourns-passing-of-visionary-heliophysicist-eugene-parker The tribute by the Parker Solar Probe team is at http://parkersolarprobe.jhuapl.edu/News-Center/Show-Article.php?articleID=176
Eugene Parker also attended the 5th Solar Orbiter workshop in Bruges in 2012. Pictures of him during the presentation he gave there are at the STCE's dedicated conference page https://www.stce.be/solarorbiter5/ (pages 10 and 11). He also gave a seminar at the ROB shortly after which was then featured in the old STCE movie "About the STCE" available on YouTube at https://www.youtube.com/watch?v=JcmTKL560Wg (1:32) Aside being one of the great solar physicists of our time, Eugene was also a source of inspiration and motivation for many a scientist. He will be deeply missed.

Geomagnetic storms have a birthday party
Late on 10 March, a long duration event took place in the nearly spotless region NOAA 2962. This sunspot group was near the Sun's central meridian and consisted of only a few tiny spots in the trailing portion of the region. The event started at 18:15UT, reached a peak of C2.8 at 20:33UT, and returned to preflare levels only around 07UT on 11 March. The graph underneath covers 10-11 March and shows measurements in ultraviolet (UV, grey and blue data) as obtained by the LYRA instrument onboard PROBA2 (https://proba2.sidc.be/ ) and in soft x-rays (SXR, red) as measured by GOES (https://www.swpc.noaa.gov/products/goes-x-ray-flux ). The flare can be seen about halfway in the graph.

The event probably concerned the eruption of a filament (channel) located near the neutral line of the relatively large magnetic region. This can be seen in underneath annotated imagery taken by SDO instruments (https://sdo.gsfc.nasa.gov/data/aiahmi/ ), showing the area in white light (top), the associated magnetogram (middle), and the view in extreme ultraviolet (EUV, bottom image). The images were taken about half an hour after the timing of the SXR peak. One can see the few puny sunspots from NOAA 2962 (white light, within red circle) in the trailing portion of the region with negative polarity magnetic fields (black in magnetogram, field lines returning to the Sun). There are some positive magnetic polarity patches (white, field lines leaving the Sun) close to the negative polarity, so it is possible that interactions between these locations may have triggered the eruption. The EUV image (SDO/AIA 193) shows that the post-eruption coronal loops are rooted in the opposite polarity fields (annotated green ribbons) and overspan the neutral line.

Underneath some additional imagery covering the eruption. A comparison of PROBA2/SWAP (17.4 nm) with ground-based H-alpha images (656.28 nm, in the red portion of the visible solar spectrum), is followed by a comparison in different wavelengths as observed by Solar Orbiter (Full Sun Imager) at 17.4 nm and 30.4 nm. The timing is respectively around 01UT on 11 March, and around 20UT on 10 March. The flare ribbons are better visible in the "colder" temperatures (H-alpha, FSI304 ; temperatures of resp. 10.000 and 80.000 degrees), whereas the coronal loops are better visible at higher temperatures (FSI174, PROBA2/SWAP 174, temperatures around 1 million degrees). Clips of this eruption are in the online version of this news item at https://www.stce.be/news/578/welcome.html


Credits movie: the SolO/EUI team (https://wwwbis.sidc.be/EUI/intro )
The coronal mass ejection (CME) associated with the eruption was a partial halo and had an earth-directed component. Underneath are coronagraphic images from this CME as observed by SOHO/LASCO (https://sohowww.nascom.nasa.gov/ ) around 02:30UT on 11 March, and STEREO-A/COR2 https://stereo-ssc.nascom.nasa.gov/ ) around 23UT on 10 March. The arrival of this interplanetary CME resulted in a moderate geomagnetic storm (Kp = 6) on 13 and 14 March. Interestingly, also last year we had a (minor) geomagnetic storm at the same days. This STCE news item at https://www.stce.be/news/519/welcome.html provides a comparison between this 2021 storm and the notorious 1989 storm.

Review of solar activity
Flaring activity
Solar activity was low to moderate with one M-class and nineteen C-class flares. There were fourteen active regions in total throughout the week.
The highlights of the week include a very long duration (almost 12 hours) C2.8-class, produced by the magnetically simple active region NOAA 2962 (alpha) on March 10th. The estimated peak time of this flare was 20:33 UT and it triggered a full halo CME from Earth's perspective.
The next highlight was an impulsive M2.2-class flare (start time 22:13 UT, end time 22:38 UT, peak time 22:32 UT), produced by a bi-polar active region NOAA 2964 (beta) on March 11th.
Filament eruptions
A filament erupted around 23 UT on March 6th in the north-west solar quadrant near plage region NOAA 2958, producing a very slow partial halo CME with a primary component directed to the north-west. A glancing blow from this CME arrived to Earth in the late afternoon of March 10th, probably mixed with a glancing blow from a CME which lifted off the solar surface the previous week on March 5th.
An other filament erupted in the south-east quadrant in the late evening on March 9th. The eruption resulted in a slow CME which was determined as a halo CME in STEREO COR2 chronograph data and estimated to possible carry a minor Earth-directed component.
Later on, a full halo CME was detected in LASCO C2 and C3 coronagraph data. The eruption was triggered by the long-duration C2.8-class flare, produced by active region NOAA 2962 (alpha) in the late afternoon of March 10th. The CME appeared very wide in STEREO COR2 data and carried significant Earth-directed component. The estimated projected velocity was between 650 km/s and 750 km/s and the halo CME was expected to catch up and mix with the flank of the CME from March 9th. The ICME arrived to the Earth on March 13th.
Particle flux near Earth
The greater than 10 MeV proton flux was at nominal levels throughout the entire week.
The 10 MeV proton flux was elevated late at night on March 10th following the long duration C2.8-class flaring activity from active region NOAA 2962.
The 10 MeV proton flux values continued to be slightly enhanced throughout March 11th and March 12th, and returned to low background values thereafter.
The greater than 2 MeV electron flux was above the 1000 pfu threshold at the beginning of the week and returned to low background values in the afternoon of March 10th with the arrival of the first ICME.
The electron fluence started at moderate levels at the beginning of the week and returned to nominal levels on March 12th. The electron fluence remained at nominal levels for the rest of the week.
Review of geomagnetic activity
The week started with solar wind conditions slowly recovering from a high speed stream which arrived to Earth last week.
In the afternoon of March 10th and on March 11th the solar wind parameters (based on DSCOVR and ACE data) registered the arrival of what seemed a mixture of two weak ICMEs. Those are related to the CME caused by the filament eruption on March 6th and potentially an earlier CME from March 5th. The magnetic field reached a maximum of 18 nT with a minimum Bz of -10 nT but the solar wind speed remained at slow background values. The influence of the ICMEs waned in the afternoon of March 12th.
The next ICME was registered in the solar wind data in the morning of March 13th, with the shock front arriving around 10:15 UT. This ICME was the expected arrival of the full hallo CME caused by the on disc long-duration C-class flaring in the night of March 10th. The ICME potentially mixed on its way with the flank of a weak CME launched by an on disc filament eruption in the south-east quadrant as well as with an expected high speed stream from a negative polarity equatorial coronal hole. This ICME was stronger with a maximum Bz above 20nT and a minimum value of about -13 nT for the Bz-component at the end of the forecasting week. The solar wind reached a maximum speed of about 580 km/s and carried a rather dense plasma with enhanced temperature.
The geomagnetic conditions were mostly quiet to unsettled in the beginning of the week until the first ICME arrival in the afternoon of March 10th when active conditions were registered.
The geomagnetic conditions were quiet to active on March 11th with two isolated periods of minor geomagnetic storms registered globally just before midnight on March 11th and in the first hours of March 12th. Locally in Belgium only quiet to active conditions were registered during this time period. The geomagnetic conditions after became mainly quiet to unsettled and the week ended with active condition at the onset of the next ICME arrival on March 13th.
PROBA2 Observations (7 Mar 2022 - 13 Mar 2022)
Solar Activity
Solar flare activity fluctuated from low to moderate during the week.
In order to view the activity of this week in more detail, we suggest to go to the following website from which all the daily (normal and difference) movies can be accessed: https://proba2.oma.be/ssa
This page also lists the recorded flaring events.
A weekly overview movie can be found here (SWAP week 624). https://proba2.oma.be/swap/data/mpg/movies/weekly_movies/weekly_movie_2022_03_07.mp4
Details about some of this week's events can be found further below.
If any of the linked movies are unavailable they can be found in the P2SC movie repository here https://proba2.oma.be/swap/data/mpg/movies/
Wednesday Mar 10
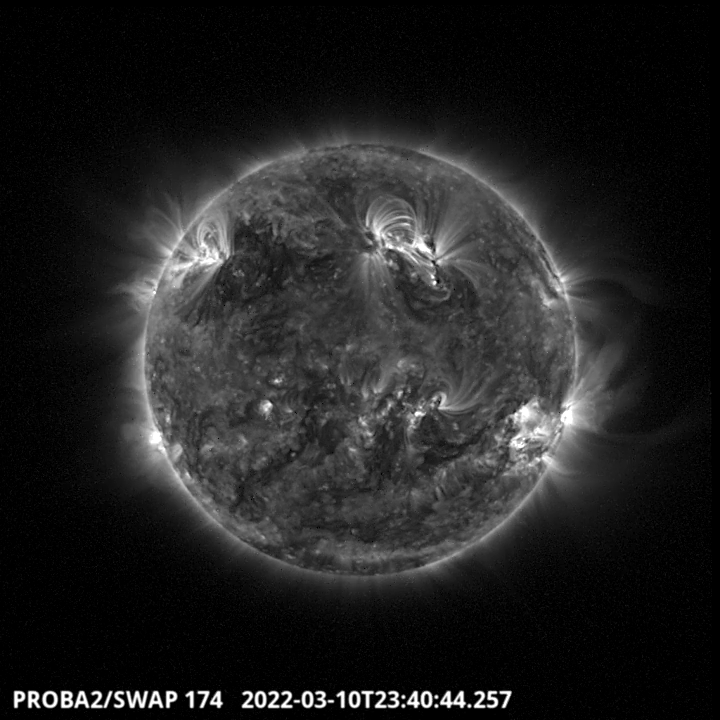
A long-duration eruptive event was observed from March 10 evening (18:00 UT) until March 11 morning (07:00 UT) - see LYRA curve below. It was classified as a C2.8 flare and was produced by the active region NOAA 2962 on the North center of the solar disk. A CME resulted from this flare. Another flare peeking occurred around 23:40 UT in the same active region around the mid-time of the long duration event. Find a movie of the events here (SWAP movie) https://proba2.oma.be/swap/data/mpg/movies/20220310_swap_movie.mp4

Thursday Mar 11

A M2.2 flare occurred on March 11 around 22:30 UT. It was produced by the active region NOAA 2964 on the South West of the solar disk. Find a movie of the events here (SWAP movie) https://proba2.oma.be/swap/data/mpg/movies/20220311_swap_movie.mp4
The International Sunspot Number by Silso
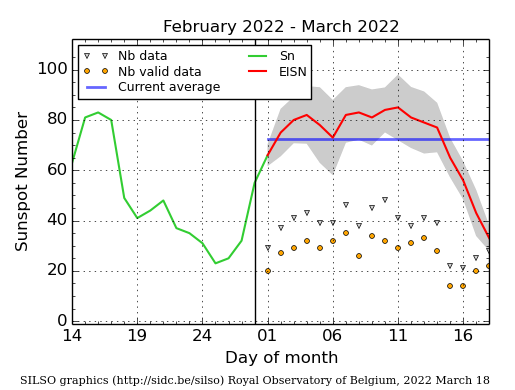
The daily Estimated International Sunspot Number (EISN, red curve with shaded error) derived by a simplified method from real-time data from the worldwide SILSO network. It extends the official Sunspot Number from the full processing of the preceding month (green line), a few days more than one solar rotation. The horizontal blue line shows the current monthly average. The yellow dots give the number of stations that provided valid data. Valid data are used to calculate the EISN. The triangle gives the number of stations providing data. When a triangle and a yellow dot coincide, it means that all the data is used to calculate the EISN of that day.
Noticeable Solar Events (7 Mar 2022 - 13 Mar 2022)
| DAY | BEGIN | MAX | END | LOC | XRAY | OP | 10CM | TYPE | Cat | NOAA |
| 11 | 2213 | 2232 | 2238 | S28W63 | M2.2 | SF | III/1 | 52 | 2964 |
| LOC: approximate heliographic location | TYPE: radio burst type |
| XRAY: X-ray flare class | Cat: Catania sunspot group number |
| OP: optical flare class | NOAA: NOAA active region number |
| 10CM: peak 10 cm radio flux |
Geomagnetic Observations in Belgium (7 Mar 2022 - 13 Mar 2022)

Local K-type magnetic activity index for Belgium based on data from Dourbes (DOU) and Manhay (MAB). Comparing the data from both measurement stations allows to reliably remove outliers from the magnetic data. At the same time the operational service availability is improved: whenever data from one observatory is not available, the single-station index obtained from the other can be used as a fallback system.
Both the two-station index and the single station indices are available here: http://ionosphere.meteo.be/geomagnetism/K_BEL/
The SIDC Space Weather Briefing
The Space Weather Briefing presented by the forecaster on duty from March 6 to 13. It reflects in images and graphs what is written in the Solar and Geomagnetic Activity report: https://www.stce.be/briefings/20220314_SWbriefing.pdf

If you need to access the movies, contact us: stce_coordination at stce.be
Review of ionospheric activity (7 Mar 2022 - 13 Mar 2022)

The figure shows the time evolution of the Vertical Total Electron Content (VTEC) (in red) during the last week at three locations:
a) in the northern part of Europe(N 61deg E 5deg)
b) above Brussels(N 50.5deg, E 4.5 deg)
c) in the southern part of Europe(N 36 deg, E 5deg)
This figure also shows (in grey) the normal ionospheric behaviour expected based on the median VTEC from the 15 previous days.
The VTEC is expressed in TECu (with TECu=10^16 electrons per square meter) and is directly related to the signal propagation delay due to the ionosphere (in figure: delay on GPS L1 frequency).
The Sun's radiation ionizes the Earth's upper atmosphere, the ionosphere, located from about 60km to 1000km above the Earth's surface.The ionization process in the ionosphere produces ions and free electrons. These electrons perturb the propagation of the GNSS (Global Navigation Satellite System) signals by inducing a so-called ionospheric delay.
See http://stce.be/newsletter/GNSS_final.pdf for some more explanations ; for detailed information, see http://gnss.be/ionosphere_tutorial.php
Action!
Check out our activity calendar: activities and encounters with the Sun-Space-Earth system and Space Weather as the main theme. We provide occasions to get submerged in our world through educational, informative and instructive activities.
If you want your event in our calendar, contact us: stce_coordination at stce.be
* March 22, Wetenschapsbattle in Ghent, Belgium
* March 25-26, Space Days in Leuven, Belgium
* April 5-17, SUN exhibit at the AfricaMuseum, Tervuren, belgium
* April 8, Public Lecture, Dansend Noorderlicht - hemelse wetenschap (Dutch), Molenhof, Leuven, Belgium
* April 26, Public Lecture on the Solar Corona in EUV (Dutch), Urania, Hove, Belgium
* April 27-29, STCE at the Symposium on Space Educational Activities, Barcelona, Spain
* April 28, Public Lecture on SolO/EUI, Astropolis, Oostende, Belgium
* July 3, Public Lecture on ROB's mission to the Sun, Cosmodrome, Genk, Belgium
* August 25, Public Lecture on Space Weather and Aviation, Astropolis, Oostende, Belgium
* October 24-28, 18th European Space Weather Week, Zagreb, Croatia
Check: https://www.stce.be/calendar
