- Table of Content
- 1.The best of......
- 2.Fresh Space We...
- 3.Review of sola...
- 4.Review of geom...
- 5.The Internatio...
- 6.Geomagnetic Ob...
- 7.The SIDC space...
- 8.Review of iono...
- 9.Action!
2. Fresh Space Weather Introductory Courses are planned
3. Review of solar activity
4. Review of geomagnetic activity
5. The International Sunspot Index by SILSO
6. Geomagnetic Observations in Belgium (4 Apr 2022 - 10 Apr 2022)
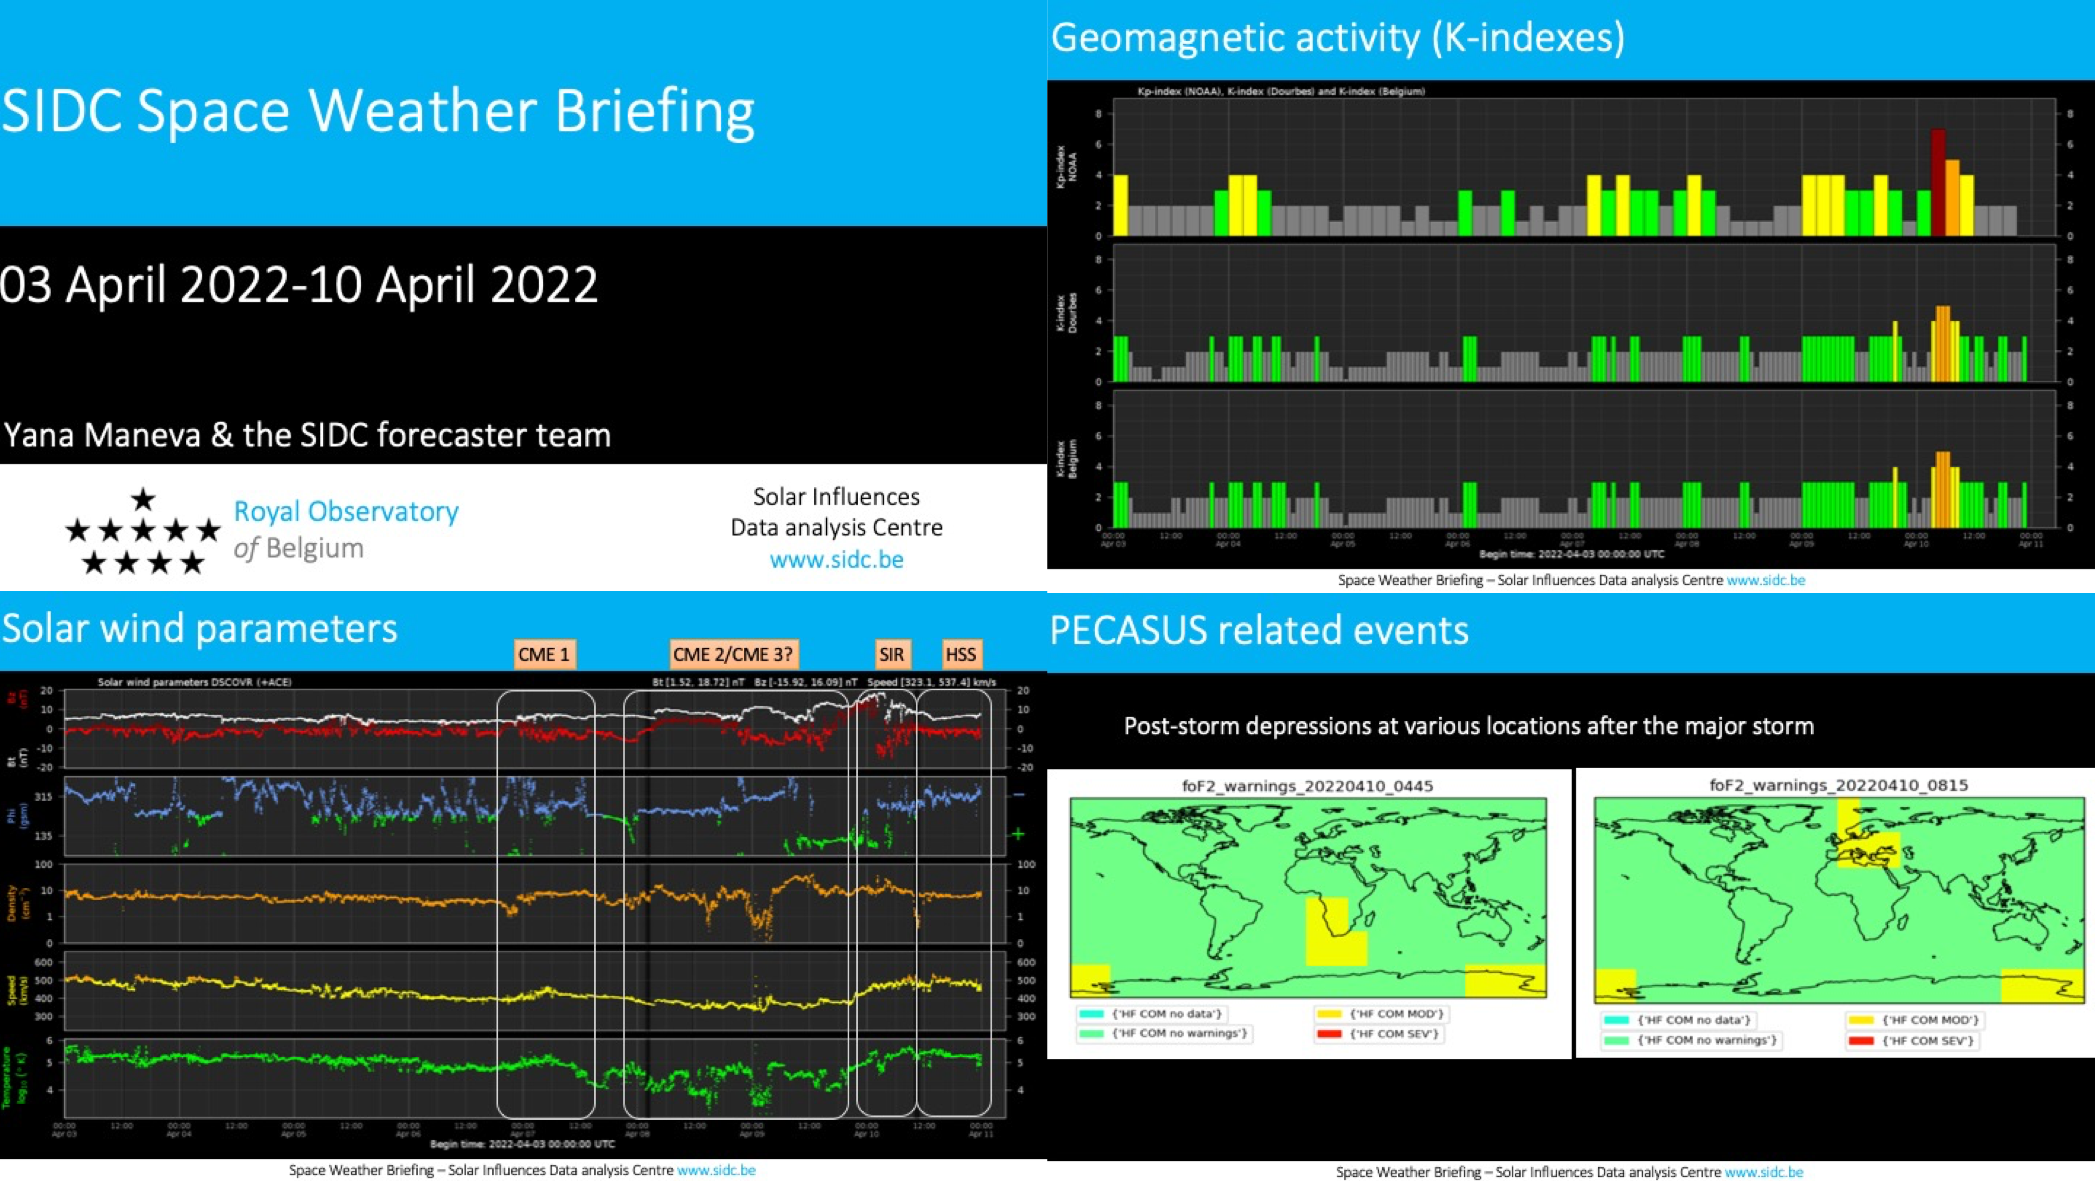
7. The SIDC space weather briefing
8. Review of ionospheric activity (4 Apr 2022 - 10 Apr 2022)
9. Action!
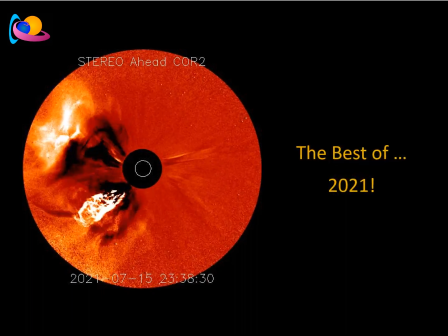
The best of... 2021!
A compilation of the most memorable space weather moments of 2021 can be found at the STCE's dedicated solar cycle highlights webpage: http://www.stce.be/highlights
Using the versatile Space Weather JHelioviewer (SWHV : http://swhv.oma.be/user_manual/ ) software, a ***MOVIE*** was created containing one or more clips of each event. Mostly SDO-images were used, occasionally supplemented with imagery from PROBA2, SOHO, STEREO and SolO/EUI.
The movie can be found on YouTube https://youtu.be/K_4E9NXDYj0 and is also downloadable (wmv - 617MB) from https://www.stce.be/movies/Best of 2021.wmv , whereas the page with the accompanying information is at https://www.stce.be/news/582/welcome.html
We wish you a happy viewing!
Fresh Space Weather Introductory Courses are planned
Want to read, understand and interpret Space Weather Bulletins? Subscribe for the freshly announced Space Weather Introductory Courses: https://www.stce.be/SWEC
SWIC guarantees that fun and education result in space weather expertise.

Shout it out!
Review of solar activity
Flares
Flaring activity was low. Ten active regions were present on the side of the sun facing Earth. NOAA 2975 was classified as a beta-gamma. It produced a number of low C-class flares together with its neighbouring active regions NOAA 2976 (beta) and NOAA 2984 (beta). These regions rotated behind the west limb by mid week, but continued to produce low C-class flaring from or behind the west limb throughout the rest of the week. NOAA 2978 and NOAA 2981 in the south-west quadrant were both classified as magnetic type beta. They produced a few low C-class flares before rotating behind the west limb on April 10th.
Coronal Mass Ejections
A full halo CME was detected in LASCO C2 coronagraph data at 16:36 UT on April 3rd. It was the result of a large filament eruption in the south-western quadrant. The CME was estimated to arrive to Earth on April 6th.
A long filament erupted in the south-east quadrant in the vicinity of NOAA 2982 on April 4th and was related to a C2.7 flare. A glancing blow from the CME was expected in the morning of April 9th.
Another filament erupted when it was located in the southern hemisphere near the central meridian. The eruption resulted in a slow south-eastward CME detected by LASCO C2 around 05:30 UT on April 7th. The bulk of this CME would probably miss the Earth, but a glancing blow was possible on April 11th.
Finally, another CME was detected in the LASCO C2 coronagraph imagery around 09:24 UT on April 9th. The CME resulted from a large filament eruption in the southwest quadrant. The bulk of the ejecta was expected to miss Earth, but a flank of the CME could reach Earth early on April 14th.
Particles near Earth
The 10 MeV proton flux was still slightly elevated on April 3rd following the M-class flaring produced by NOAA 2975 on April 2nd. The 10 MeV proton flux returned to background values on April 4th and remained so thereafter.
The greater than 2 MeV electron flux crossed the 1000 pfu threshold on April 3rd and continued crossing the threshold until late evening of April 7th when it returned to background values.
The electron fluence was nominal at the beginning of the week and increased to moderate levels on April 4th. It returned back to nominal levels on April 9th.
Review of geomagnetic activity
The solar wind was under the mild influence of a high speed stream (HSS) with a maximum speed up to 530 km/s. The solar wind conditions returned to mostly background levels on April 5th and April 6th until the arrival of a weak ICME around 23 UT on April 6th. The ICME was probably related to the April 3rd halo CME and resulted in minor density, velocity and the interplanetary magnetic field enhancements on April 7th. The solar wind parameters escalated to higher values on April 8th and April 9th with the passage of an ICME probably related to the April 4th filament eruption and potentially an early arrival of the April 7th CME.
Finally, in the night of April 9th/early morning of April 10th, the influence of the ICMEs got mixed with an expected HSS, whose stream interaction region increased the magnitude of the interplanetary magnetic field to 18.7 nT. The Bz component reached a minimum of -15.9 nT and the solar wind speed approached 500 km/s, later on exceeding 530 km/s.
The geomagnetic conditions were quiet to unsettled. On the planetary level, the Kp reached 4 for some isolated periods due to the influence of a high speed stream (HSS) on April 4 and due to the arrival of two interplanetary coronal mass ejections (ICMEs) on April 7 and April 8. These structures were possibly related to the halo CME from April 3rd and the filament eruption on April 4th.
The active conditions on April 9 were probably the result of the April 7 CME.
The ICMEs and the consequent HSS arrival lead to a minor (KBEL = 5) storm in Belgium and a major (Kp =7) planetary storm in the morning of April 10th.
The International Sunspot Index by SILSO
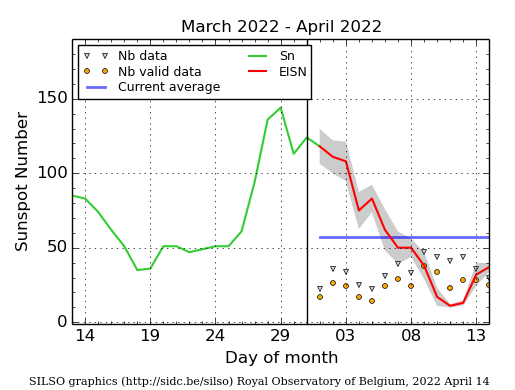
The daily Estimated International Sunspot Number (EISN, red curve with shaded error) derived by a simplified method from real-time data from the worldwide SILSO network. It extends the official Sunspot Number from the full processing of the preceding month (green line), a few days more than one solar rotation. The horizontal blue line shows the current monthly average. The yellow dots give the number of stations that provided valid data. Valid data are used to calculate the EISN. The triangle gives the number of stations providing data. When a triangle and a yellow dot coincide, it means that all the data is used to calculate the EISN of that day.
Geomagnetic Observations in Belgium (4 Apr 2022 - 10 Apr 2022)
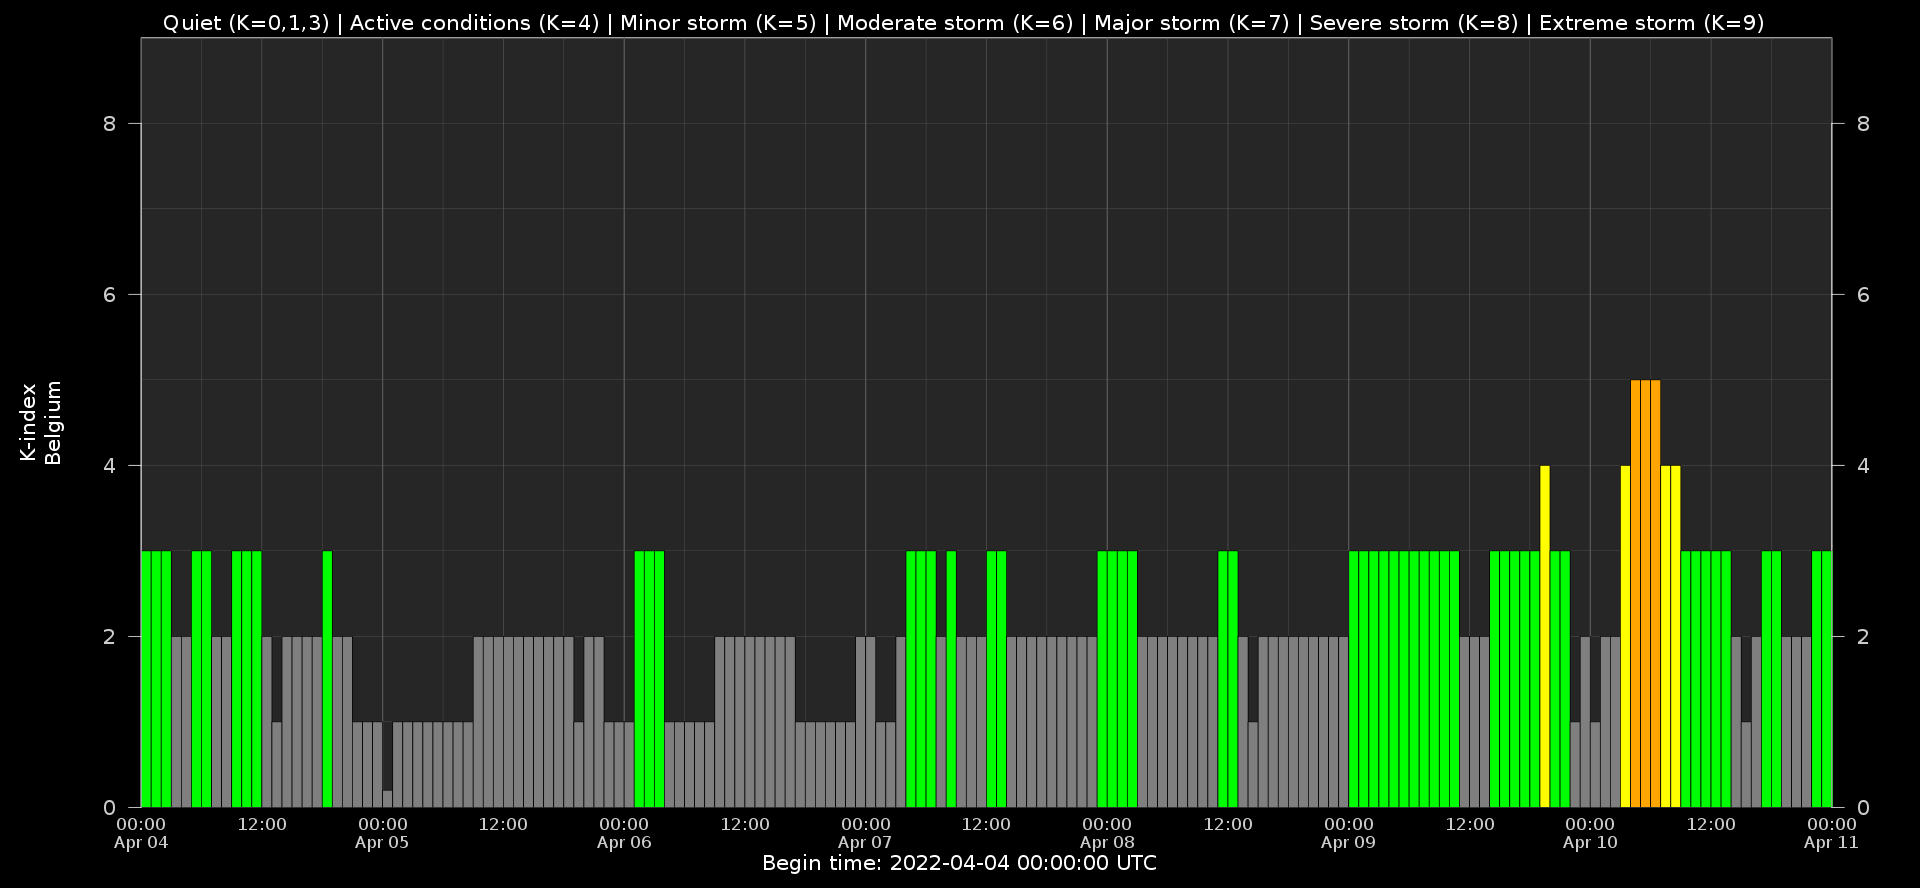
Local K-type magnetic activity index for Belgium based on data from Dourbes (DOU) and Manhay (MAB). Comparing the data from both measurement stations allows to reliably remove outliers from the magnetic data. At the same time the operational service availability is improved: whenever data from one observatory is not available, the single-station index obtained from the other can be used as a fallback system.
Both the two-station index and the single station indices are available here: http://ionosphere.meteo.be/geomagnetism/K_BEL/
The SIDC space weather briefing
The forecaster on duty presented the space weather overview from April 4 to April 10. The pdf and movies can be found in: https://www.stce.be/briefings/20220411/
As extra, the forecaster gave a glimpse of the impact of the major geomagnetic storm on HF radio communication visualised in the PECASUS Post-Storm depression maps. A geomagnetic storm first increases the Vertical Total Electron Content. In the recovery phase of the storm, a depletion of electrons occurs. The result is that less HF radio waves are reflected by the ionosphere. The maximal usable frequency (MUF) decreases.
Review of ionospheric activity (4 Apr 2022 - 10 Apr 2022)

The figure shows the time evolution of the Vertical Total Electron Content (VTEC) (in red) during the last week at three locations:
a) in the northern part of Europe(N 61deg E 5deg)
b) above Brussels(N 50.5deg, E 4.5 deg)
c) in the southern part of Europe(N 36 deg, E 5deg)
This figure also shows (in grey) the normal ionospheric behaviour expected based on the median VTEC from the 15 previous days.
The VTEC is expressed in TECu (with TECu=10^16 electrons per square meter) and is directly related to the signal propagation delay due to the ionosphere (in figure: delay on GPS L1 frequency).
The Sun's radiation ionizes the Earth's upper atmosphere, the ionosphere, located from about 60km to 1000km above the Earth's surface.The ionization process in the ionosphere produces ions and free electrons. These electrons perturb the propagation of the GNSS (Global Navigation Satellite System) signals by inducing a so-called ionospheric delay.
See http://stce.be/newsletter/GNSS_final.pdf for some more explanations ; for detailed information, see http://gnss.be/ionosphere_tutorial.php
Action!
Check out our activity calendar: activities and encounters with the Sun-Space-Earth system and Space Weather as the main theme. We provide occasions to get submerged in our world through educational, informative and instructive activities.
If you want your event in our calendar, contact us: stce_coordination at stce.be
* April 5-24, SUN exhibit at the AfricaMuseum, Tervuren, belgium
* April 22, Workshop PromOptica - Electromagnetic Radiation Sensors, Space Pole, Brussels, Belgium
* April 26, Public Lecture on the Solar Corona in EUV (Dutch), Urania, Hove, Belgium
* April 27-29, STCE at the Symposium on Space Educational Activities, Barcelona, Spain
* April 28, Public Lecture on SolO/EUI, Astropolis, Oostende, Belgium
* June 13-15, Space Weather Introductory Course - onsite, by the STCE, Brussels, Belgium
* July 3, Public Lecture on STCE's mission to the Sun, Cosmodrome, Genk, Belgium
* August 25, Public Lecture on Space Weather and Aviation, Astropolis, Oostende, Belgium
* October 24-28, 18th European Space Weather Week, Zagreb, Croatia
* November 21-23, Space Weather Introductory Course - onsite, by the STCE, Brussels, Belgium
* December 5, 6, 8, 9, Space Weather Introductory Course - online, by the STCE, zoom
Check: https://www.stce.be/calendar