- Table of Content
- 1.Come to ROB to...
- 2.Flashback
- 3.Review of sola...
- 4.Review of geom...
- 5.PROBA2 Observa...
- 6.The Internatio...
- 7.Noticeable Sol...
- 8.Geomagnetic Ob...
- 9.The SIDC Space...
- 10.Action!
2. Flashback
3. Review of solar activity
4. Review of geomagnetic activity
5. PROBA2 Observations (12 Sep 2022 - 18 Sep 2022)
6. The International Sunspot Index by SILSO
7. Noticeable Solar Events (12 Sep 2022 - 18 Sep 2022)
8. Geomagnetic Observations at Dourbes (12 Sep 2022 - 18 Sep 2022)
9. The SIDC Space Weather Briefing
10. Action!
Come to ROB to study EUV brightenings with EUI!
Full-time researcher to study EUV brightenings detected by EUI and other instruments onboard Solar Orbiter
The Royal Observatory of Belgium hires a full-time scientific collaborator, who will play a central role in ROB’s research on campfires. The new collaborator will be involved in the detection and characterization of EUV brightenings and the study of their properties as derived from dedicated observation by instruments such as EUI, PHI, SPICE, and AIA, using techniques such as differential emission measure, coronal stereoscopy and spectroscopy. The research will include both case studies of EUV brightenings and statistical studies of their properties. The distribution of their energies is especially interesting as it extends our knowledgebase of the contribution of coronal brightenings to coronal heating. The new collaborator will aid in producing an open catalog of EUV brightenings, which can be consulted/employed by the solar physics community.
For further details about the position, please visit: https://www.astro.oma.be/en/information/jobs/. Applications should be sent to cis.verbeeck@oma.be no later than October 20, 2022.
Flashback
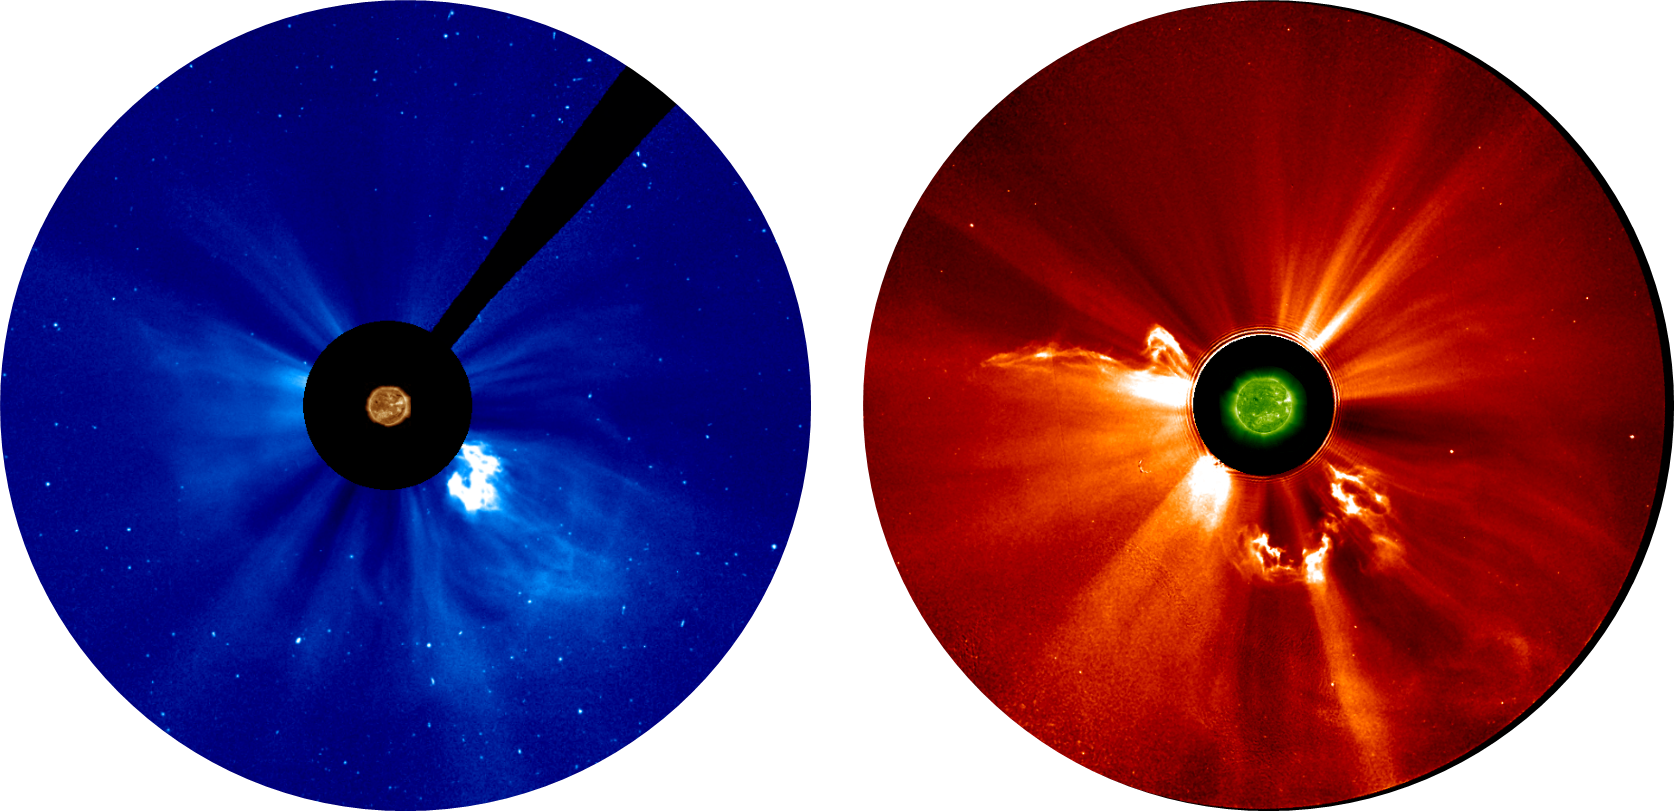
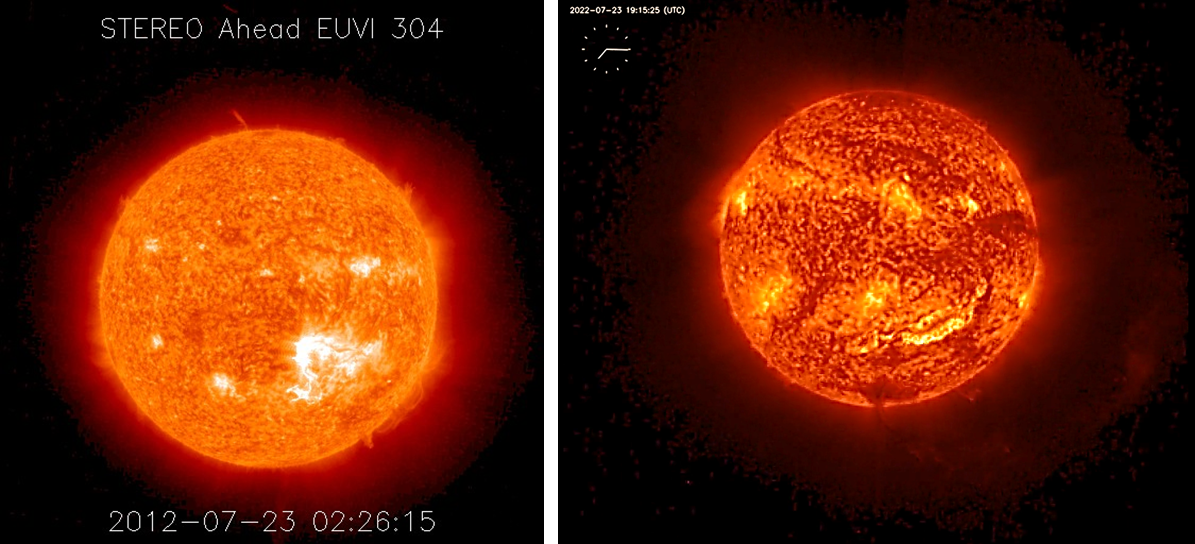
On 24 July this year, the space weather forecaster of the SIDC (https://www.sidc.be/ ) issued the following PRESTO alert: "A full halo coronal mass ejection (CME) was detected by the CACTus automated algorithm. Onset time was determined to be 23 July at 18:48 UT, with an average speed of about 1700 km/s. This is believed to be a backsided event." This information was based on coronagraphic imagery from the SOHO spacecraft (https://soho.nascom.nasa.gov/ ). The halo CME was also very well observed by the STEREO-A spacecraft (https://stereo-ssc.nascom.nasa.gov/ ), trailing Earth by 23 degrees at that time. That location allowed a better view of the CME than from Earth. Underneath an image of the CME as seen by the coronagraph on board of SOHO (left) and STEREO-A (right) as seen near the same time, i.e. resp. 22:30UT and 22:38UT on 23 July. A small solar image in extreme ultraviolet (EUV) is overlaid on each coronagraphic image. Clips of the event are available in the online version of this newsitem at https://www.stce.be/news/605/welcome.html
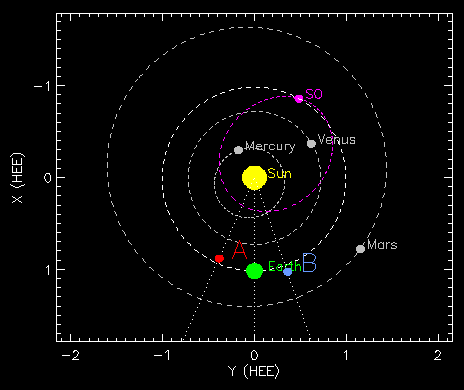
As the eruption occurred on the farside of the Sun, solar observers had obviously no idea what the source of the eruption was. That is... until observations made by the Solar Orbiter (https://www.sidc.be/EUI/intro ) became available last week. As it turns out, on 23 July, the spacecraft was located almost diametrically opposed to STEREO-A, preceding the Earth by about 151 degrees. The locations of STEREO ("A"), Solar Orbiter ("SO"), and Earth (representing SOHO) on 23 July are indicated on the map underneath.
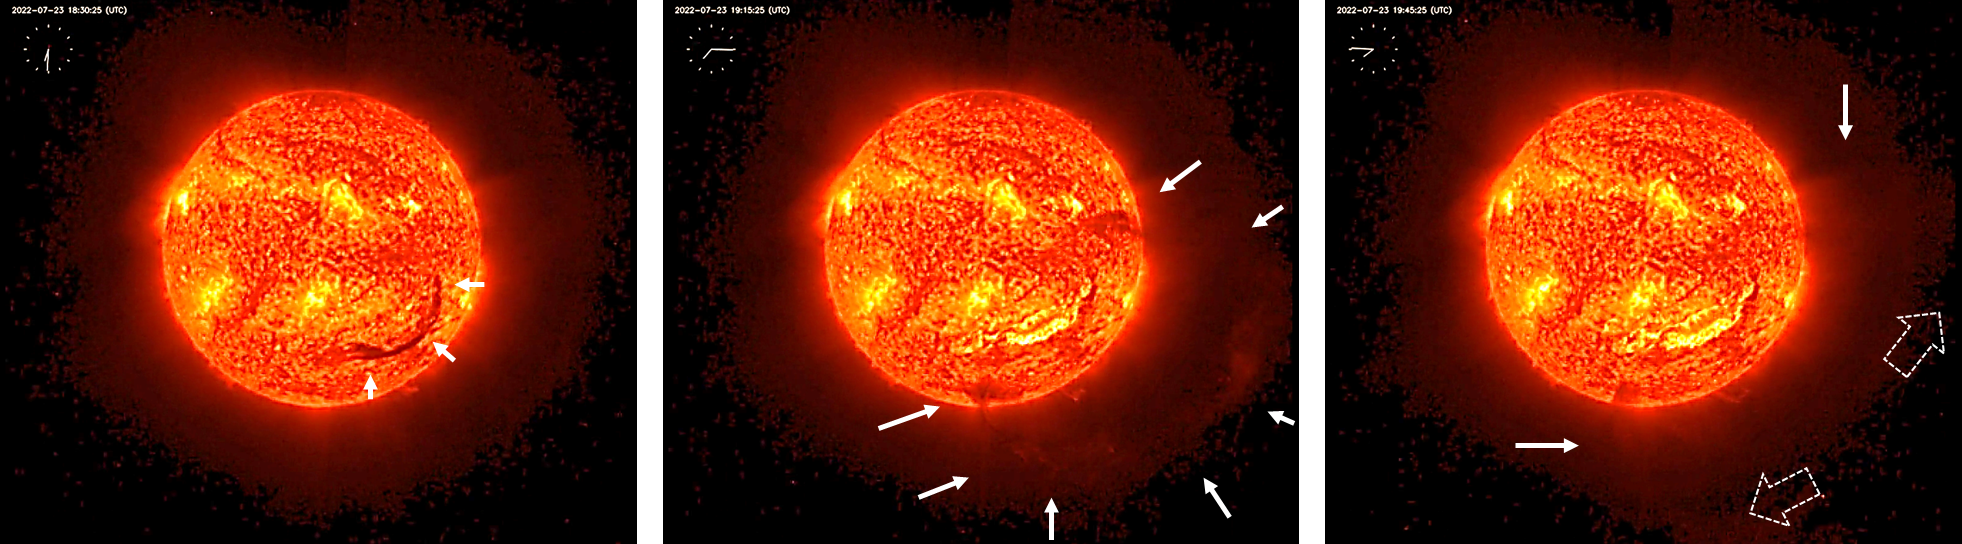
As such, Solar Orbiter had an excellent view on the Sun's "farside" (as seen from Earth) at the time of the eruption. Its Full Sun Imager (FSI), one of SolO's 3 EUV telescopes, showed the source of the eruption to be a long and solid filament, which is a cloud of ionized gas suspended above the solar surface squeezed between regions of opposite magnetic polarity. Being cooler and denser than the plasma underneath and their surroundings, it appears as a dark line when seen on the solar disk. Becoming unstable somewhere between 17 and 18UT, the violent eruption ejected the filament that splitted in 2 during the process. From Solar Orbiter/FSI's point of view, the portions move in resp. the southeast ("lower left") and northwest ("upper right") direction. In comparison, STEREO-A's coronagraph sees the two portions of the ejected filament (CME core) as if in a mirror, with the first portion moving to the southwest ("lower right") and the other portion to the northeast ("upper left" ) - see the imagery above. SOHO's coronagraph mainly sees the southwest portion. The annotated (enhanced) EUV images from FSI underneath show the filament as it starts to rise (left), when ejection of the filament is in progress (middle), and the split of the filament (right). The timings are indicated by the clock. On the solar surface, near and above the original location of the filament, bright parallel ribbons and a series of post-eruption coronal loops can be seen.
Teams of the various Solar Orbiter's instruments are now scrutinizing their data related to this event, so not only from SolO's EUV telescopes (EUI), but also from its coronagraph (METIS), its energetic particle detector (EPD), and its in-situ solar wind analyzer (SWA). Interestingly, exactly on the same day 5 and 10 years ago (so resp. 23 July 2017 and 2012), other impressive eruptions took place on the Sun's farside (see these STCE newsitems at resp. https://www.stce.be/news/394/welcome.html and https://www.stce.be/news/152/welcome.html ). Though the 2022 event was not as strong as the Carrington-like event of 2012 (Baker et al. 2013: https://doi.org/10.1002/swe.20097 ), it certainly seems to be worthwhile of a closer examination.
Review of solar activity
Flares and Active Regions
Solar activity was first low, reaching later moderate levels with 54 C-class flares and 6 M-class flares.
There were in total ten numbered active regions on the visible solar disc and another one was observed at the east limb at the end of week. Most of the flares were driven by NOAA AR 3098, which was the largest and most complex active region. In the beginning of the week it was classified as magnetic type beta, while by mid week it increased its magnetic field complexity and was classified as gamma-beta until it rotated over the west limb at the end of the week.
The strongest flare registered was an M7.9 flare, start time 09:44 UTC, end time 09:56 UTC, peak time 09:49 UTC on Sept 16th, produced by NOAA AR 3098, while the region was located at the west limb. Most of the moderate flaring activity was related to impulsive M-class flares and none was associated with an Earth-directed coronal mass ejection (CME).
Isolated C-class flares were produced by active regions NOAA 3101 (beta) and NOAA 3102 (beta) and NOAA 3103 (beta).
Triggers of Solar Wind Disturbances
The solar surface was streaked by filaments and multiple filament and prominence eruptions were observed throughout the week, though none of these events resulted in an Earth-directed coronal mass ejection (CME). A filament eruption on Sept 15th produced strong on disc dimming and was related to a broad south-west CME as observed by LASCO C2 around 02 UTC on Sept 16th.
Energetic Particles near Earth
The greater than 10 MeV proton flux was enhanced throughout the week following CME activity from the previous week, but remained below radiation storm thresholds.
The greater than 2 MeV electron flux registered high values above the 1000 pfu threshold for prolonged periods of time in the beginning of the week. The greater than 2 MeV electron flux decreased back to background levels in the evening of Sept 14th influenced by a weak ICME arrival and remained well under the 1000 pfu threshold for the rest of the week. The corresponding electron fluence started at moderate levels in the beginning of the week and registered nominal levels from Sept 15th onwards.
Review of geomagnetic activity
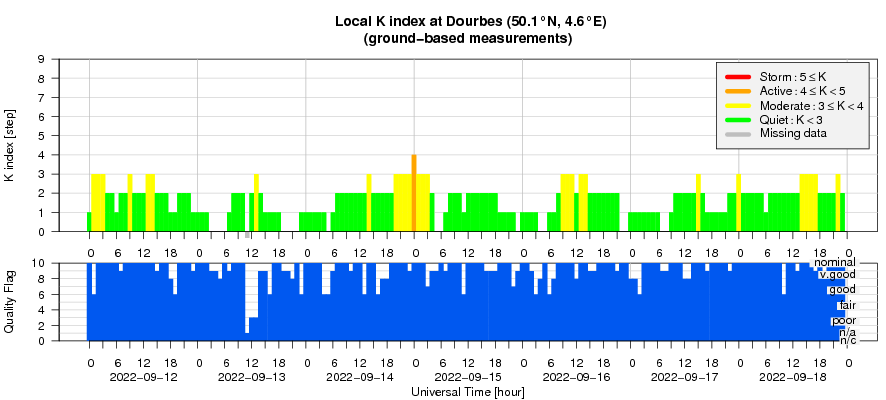
The week started with slightly elevated solar wind velocity under the waking influence of a high speed stream (HSS) which had arrived at Earth last week. The solar wind declined towards slow solar wind background on Sept 13th. A mild ICME arrived on Sept 14th increasing the solar wind density and magnetic field reaching a maximum of 16 nT. The solar wind speed remained slightly above 300 km/s. The Bz component reached -14 nT late on Sept 14th. The influence of the ICME was visible until Sept 16th.
A High Solar wind Speed (HSS) up to 552 km/s arrived on on Sept 18th. The total magnetic field increased slightly during the HSS arrival with maximal values of about 12 nT and a Bz component reaching -9.2 nT.
The geomagnetic conditions were mostly quiet to unsettled. Isolated active periods were observed as a result of the ICME arrival on Sept 15th. Isolated active periods was observed locally in the early afternoon on Sept 18th in response to the high speed stream arrival.
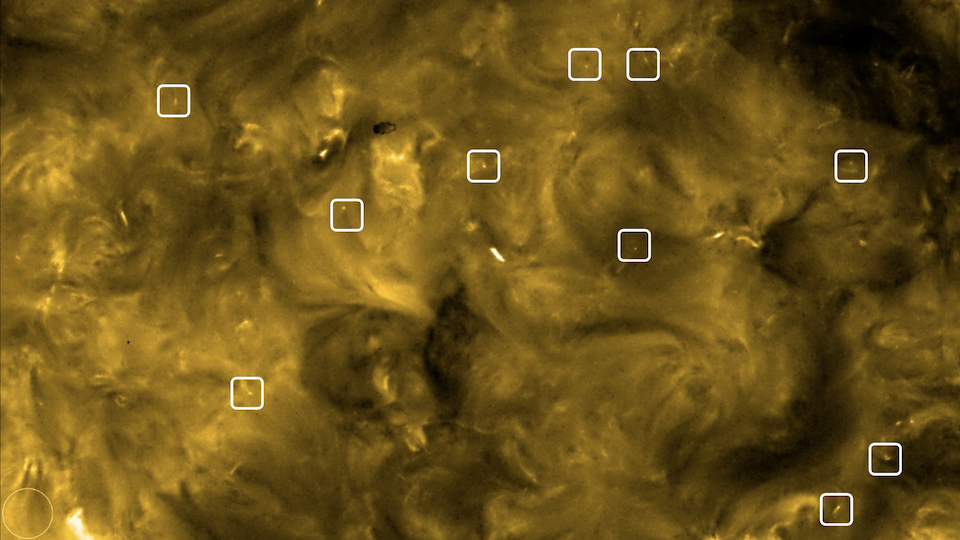
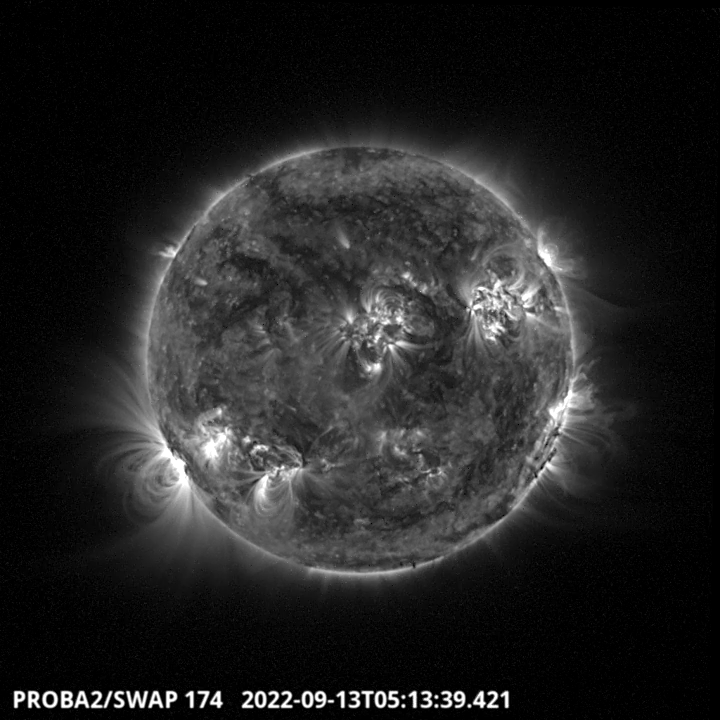
PROBA2 Observations (12 Sep 2022 - 18 Sep 2022)
Solar Activity
Solar flare activity fluctuated from low to moderate during the week.
In order to view the activity of this week in more detail, we suggest to go to the following website from which all the daily (normal and difference) movies can be accessed: https://proba2.oma.be/ssa
This page also lists the recorded flaring events.
A weekly overview movie can be found here (SWAP week 651). https://proba2.sidc.be/swap/data/mpg/movies/weekly_movies/weekly_movie_2022_09_12.mp4
Details about some of this week's events can be found further below.
If any of the linked movies are unavailable they can be found in the P2SC movie repository here https://proba2.sidc.be/swap/data/mpg/movies/
Monday Sep 13
A coronal hole located in the North-East hemisphere at the begin of the week could be observed
throughout the whole week - SWAP image. Find a movie of the events here (SWAP movie) https://proba2.sidc.be/swap/data/mpg/movies/20220913_swap_movie.mp4
Friday Sep 16
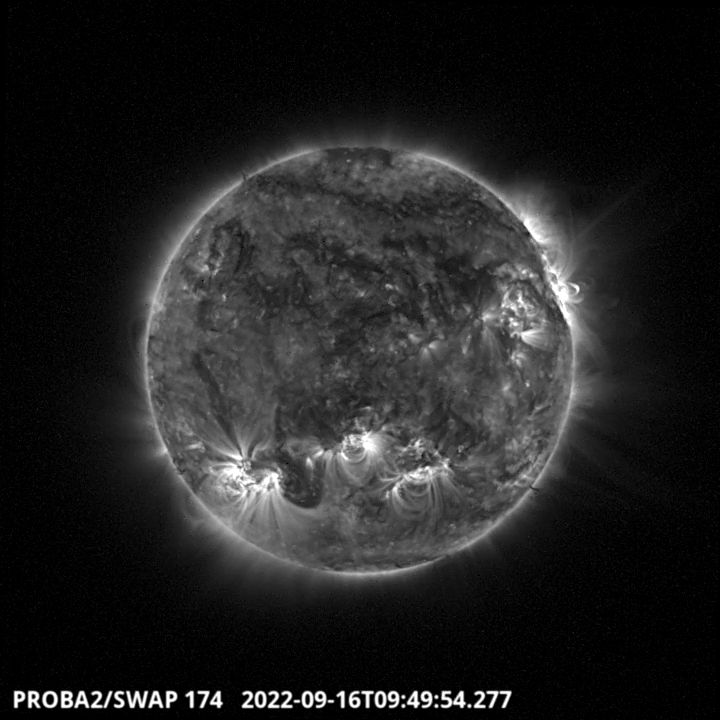
The largest eruption of the week, a M7.6 flare, took place on the North West Limb around 9:49
UT - SWAP image. Find a movie of the event here (SWAP movie) https://proba2.sidc.be/swap/data/mpg/movies/20220916_swap_movie.mp4
The International Sunspot Index by SILSO
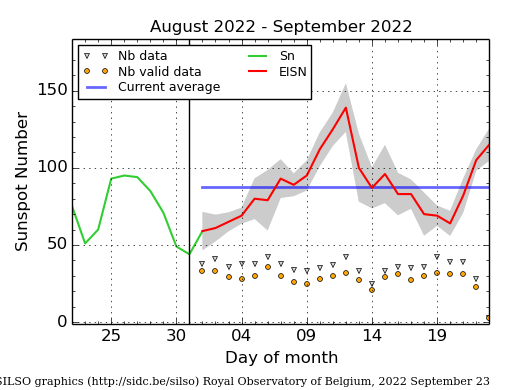
The daily Estimated International Sunspot Number (EISN, red curve with shaded error) derived by a simplified method from real-time data from the worldwide SILSO network. It extends the official Sunspot Number from the full processing of the preceding month (green line). The plot shows the last 30 days (about one solar rotation). The horizontal blue line shows the current monthly average, while the green dots give the number of stations included in the calculation of the EISN for each day.
Noticeable Solar Events (12 Sep 2022 - 18 Sep 2022)
| DAY | BEGIN | MAX | END | LOC | XRAY | OP | 10CM | TYPE | Cat | NOAA |
| 12 | 2337 | 2344 | 2348 | M1.7 | F | 400 | I/2 | 30 | 3098 | |
| 14 | 0941 | 1019 | 1043 | N21W56 | M1.1 | SF | III/1 | 30 | 3098 | |
| 16 | 0944 | 0949 | 0956 | M7.9 | 30 | 3098 | ||||
| 16 | 1549 | 1559 | 1612 | N18W81 | M6.2 | SN | 30 | 3098 | ||
| 17 | 1242 | 1319 | 1321 | M1.0 | ||||||
| 17 | 1321 | 1339 | 1353 | M1.9 | 30 | 3098 | ||||
| 17 | 2032 | 2041 | 2052 | M2.6 | 30 | 3098 |
| LOC: approximate heliographic location | TYPE: radio burst type |
| XRAY: X-ray flare class | Cat: Catania sunspot group number |
| OP: optical flare class | NOAA: NOAA active region number |
| 10CM: peak 10 cm radio flux |
Geomagnetic Observations at Dourbes (12 Sep 2022 - 18 Sep 2022)
The SIDC Space Weather Briefing
The forecaster on duty presented the space weather overview from September 11 to 18. The pdf and movies can be found in: https://www.stce.be/briefings/20220919_SWbriefing/
Action!
Check out our activity calendar: activities and encounters with the Sun-Space-Earth system and Space Weather as the main theme. We provide occasions to get submerged in our world through educational, informative and instructive activities.
If you want your event in our calendar, contact us: stce_coordination at stce.be
* September 24-25 Space Pole Open Days, Brussels, Belgium
* September 24: STCE lecture (Dutch) at Space Pole Open Days: Noorderlicht: hemelse wetenschap
* September 25: STCE lecture (Dutch) at Space Pole Open Days: Alarm, een zonnestorm op komst!
* September 27: STCE seminar Solar Spectral Irradiance Variability, 2PM, onsite (@ROB) and online
* October 11, Webinar: Putting the FAIR principles into practice: the journey of a GNSS data repository, GNSS@Royal Observatory of Belgium
* October 24-28, 18th European Space Weather Week, Zagreb, Croatia
* November 21-23, Space Weather Introductory Course - onsite, by the STCE, Brussels, Belgium - fully booked
* December 5, 6, 8, 9, Space Weather Introductory Course - online, by the STCE, zoom - fully booked
Check: https://www.stce.be/calendar