- Table of Content
- 1.STCE's Number ...
- 2.STCE meets NAT...
- 3.PROBA2 Observa...
- 4.The Internatio...
- 5.Noticeable Sol...
- 6.Geomagnetic Ob...
- 7.Review of sola...
- 8.Review of geom...
- 9.The SIDC Space...
- 10.Review of iono...
- 11.Calendar - che...
2. STCE meets NATO Space Weather specialists
3. PROBA2 Observations (27 Feb 2023 - 5 Mar 2023)
4. The International Sunspot Index by SILSO
5. Noticeable Solar Events (27 Feb 2023 - 5 Mar 2023)
6. Geomagnetic Observations in Belgium (27 Feb 2023 - 5 Mar 2023)
7. Review of solar activity
8. Review of geomagnetic activity
9. The SIDC Space Weather Briefing
10. Review of ionospheric activity (27 Feb 2023 - 5 Mar 2023)
11. Calendar - check it
STCE's Number Puzzle
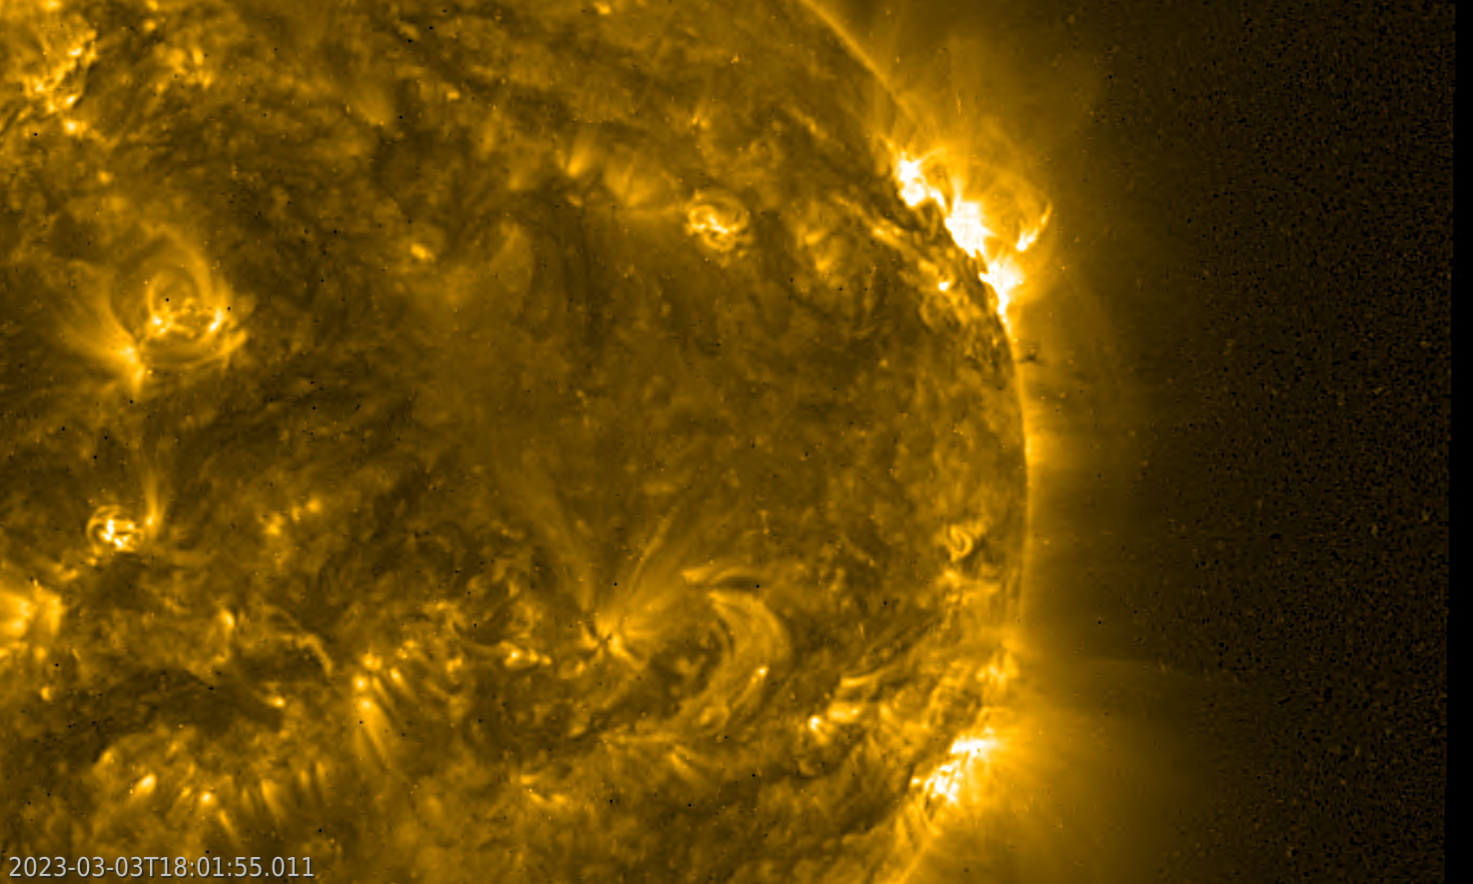
On 3 March, active region NOAA 13234 produced an X2 flare. Details were discussed in this STCE newsflash at https://www.stce.be/news/632/welcome.html Underneath an extreme ultraviolet image of the eruption, as taken by PROBA2/SWAP (https://proba2.sidc.be/ssa ). Those X-class flares seem to have a jolly good party, as this is already the 15th X-class event so far this solar cycle, and the 6th (!) in 2023.
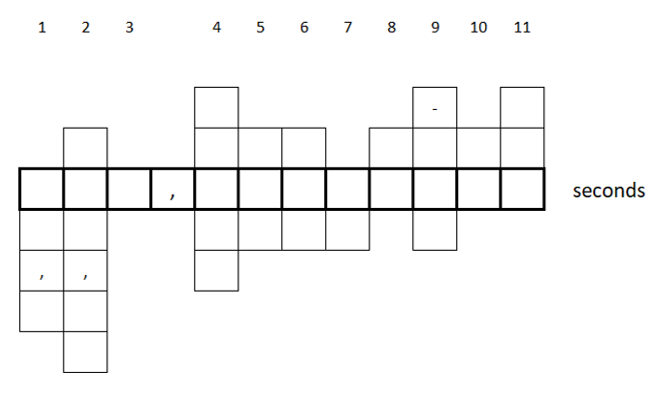
So it's time we have some fun too. Underneath is a number puzzle highlighting solar activity, projects and ongoing missions so far in solar cycle 25. The aim is to find the mystery number of 11 digits by solving the 11 questions. Each answer has to be written top-down as indicated by the number for each question. The decimals and a minus sign have already been indicated. A lot of the answers can be found by scrutinizing the webpages provided in the links, and by checking the STCE newsitems.
The solution (it's a time, expressed in seconds) of the puzzle can be found online at https://www.stce.be/news/633/welcome.html
Good luck, and enjoy!
Q-1 – Expressed in million kilometers, what has been the closest distance between Solar Orbiter and the Sun so far?
Q-2 – The USET telescopes (https://www.sidc.be/uset/ ) at the Royal Observatory of Belgium (ROB) observe the Sun in white light, H-alpha (in the red portion of the solar spectrum), and in Ca II K (in the blue portion of the solar spectrum). What is the wavelength (in nm) corresponding to the Ca II K line?
Q-3 – For which Kp level do PECASUS operators (see Kauristie et al. 2021 - https://www.mdpi.com/2072-4292/13/18/3685 ) issue a “Severe HF COM” advisory for auroral absorption to civil aviation (ICAO)?
Q-4 – What is the NOAA number of the largest sunspot group that has appeared so far during Solar Cycle 25 (SC25) according to the NOAA/USAF network?
Q-5 – What is the highest daily sunspot number (final or provisional) recorded by SILSO (https://www.sidc.be/silso/ ) so far this solar cycle (SC25)?
Q-6 – What is the total number of spotless days that were recorded by SILSO (https://www.sidc.be/silso/ ) during the transition from solar cycle 24 to the current solar cycle 25?
Q-7 – There have been 15 X-class flares so far this solar cycle. What was the longest duration (in minutes) reached by any of these X-class events?
Q-8 – What was the number of Starlink satellites that got destroyed early February 2022 following geomagnetic disturbances during the check-out procedure in their stand-by orbit?
Q-9 – Dst-wise, what is the (preliminary) value in nT for the strongest geomagnetic storm recorded so far during SC25?
Q-10 – What was the maximum proton flux (energies greater than 10 MeV) in pfu observed by GOES during the strongest proton event so far this solar cycle?
Q-11 – What is the wavelength (in Angstrom) in which the PROBA2/SWAP instrument takes its solar EUV images?
STCE meets NATO Space Weather specialists
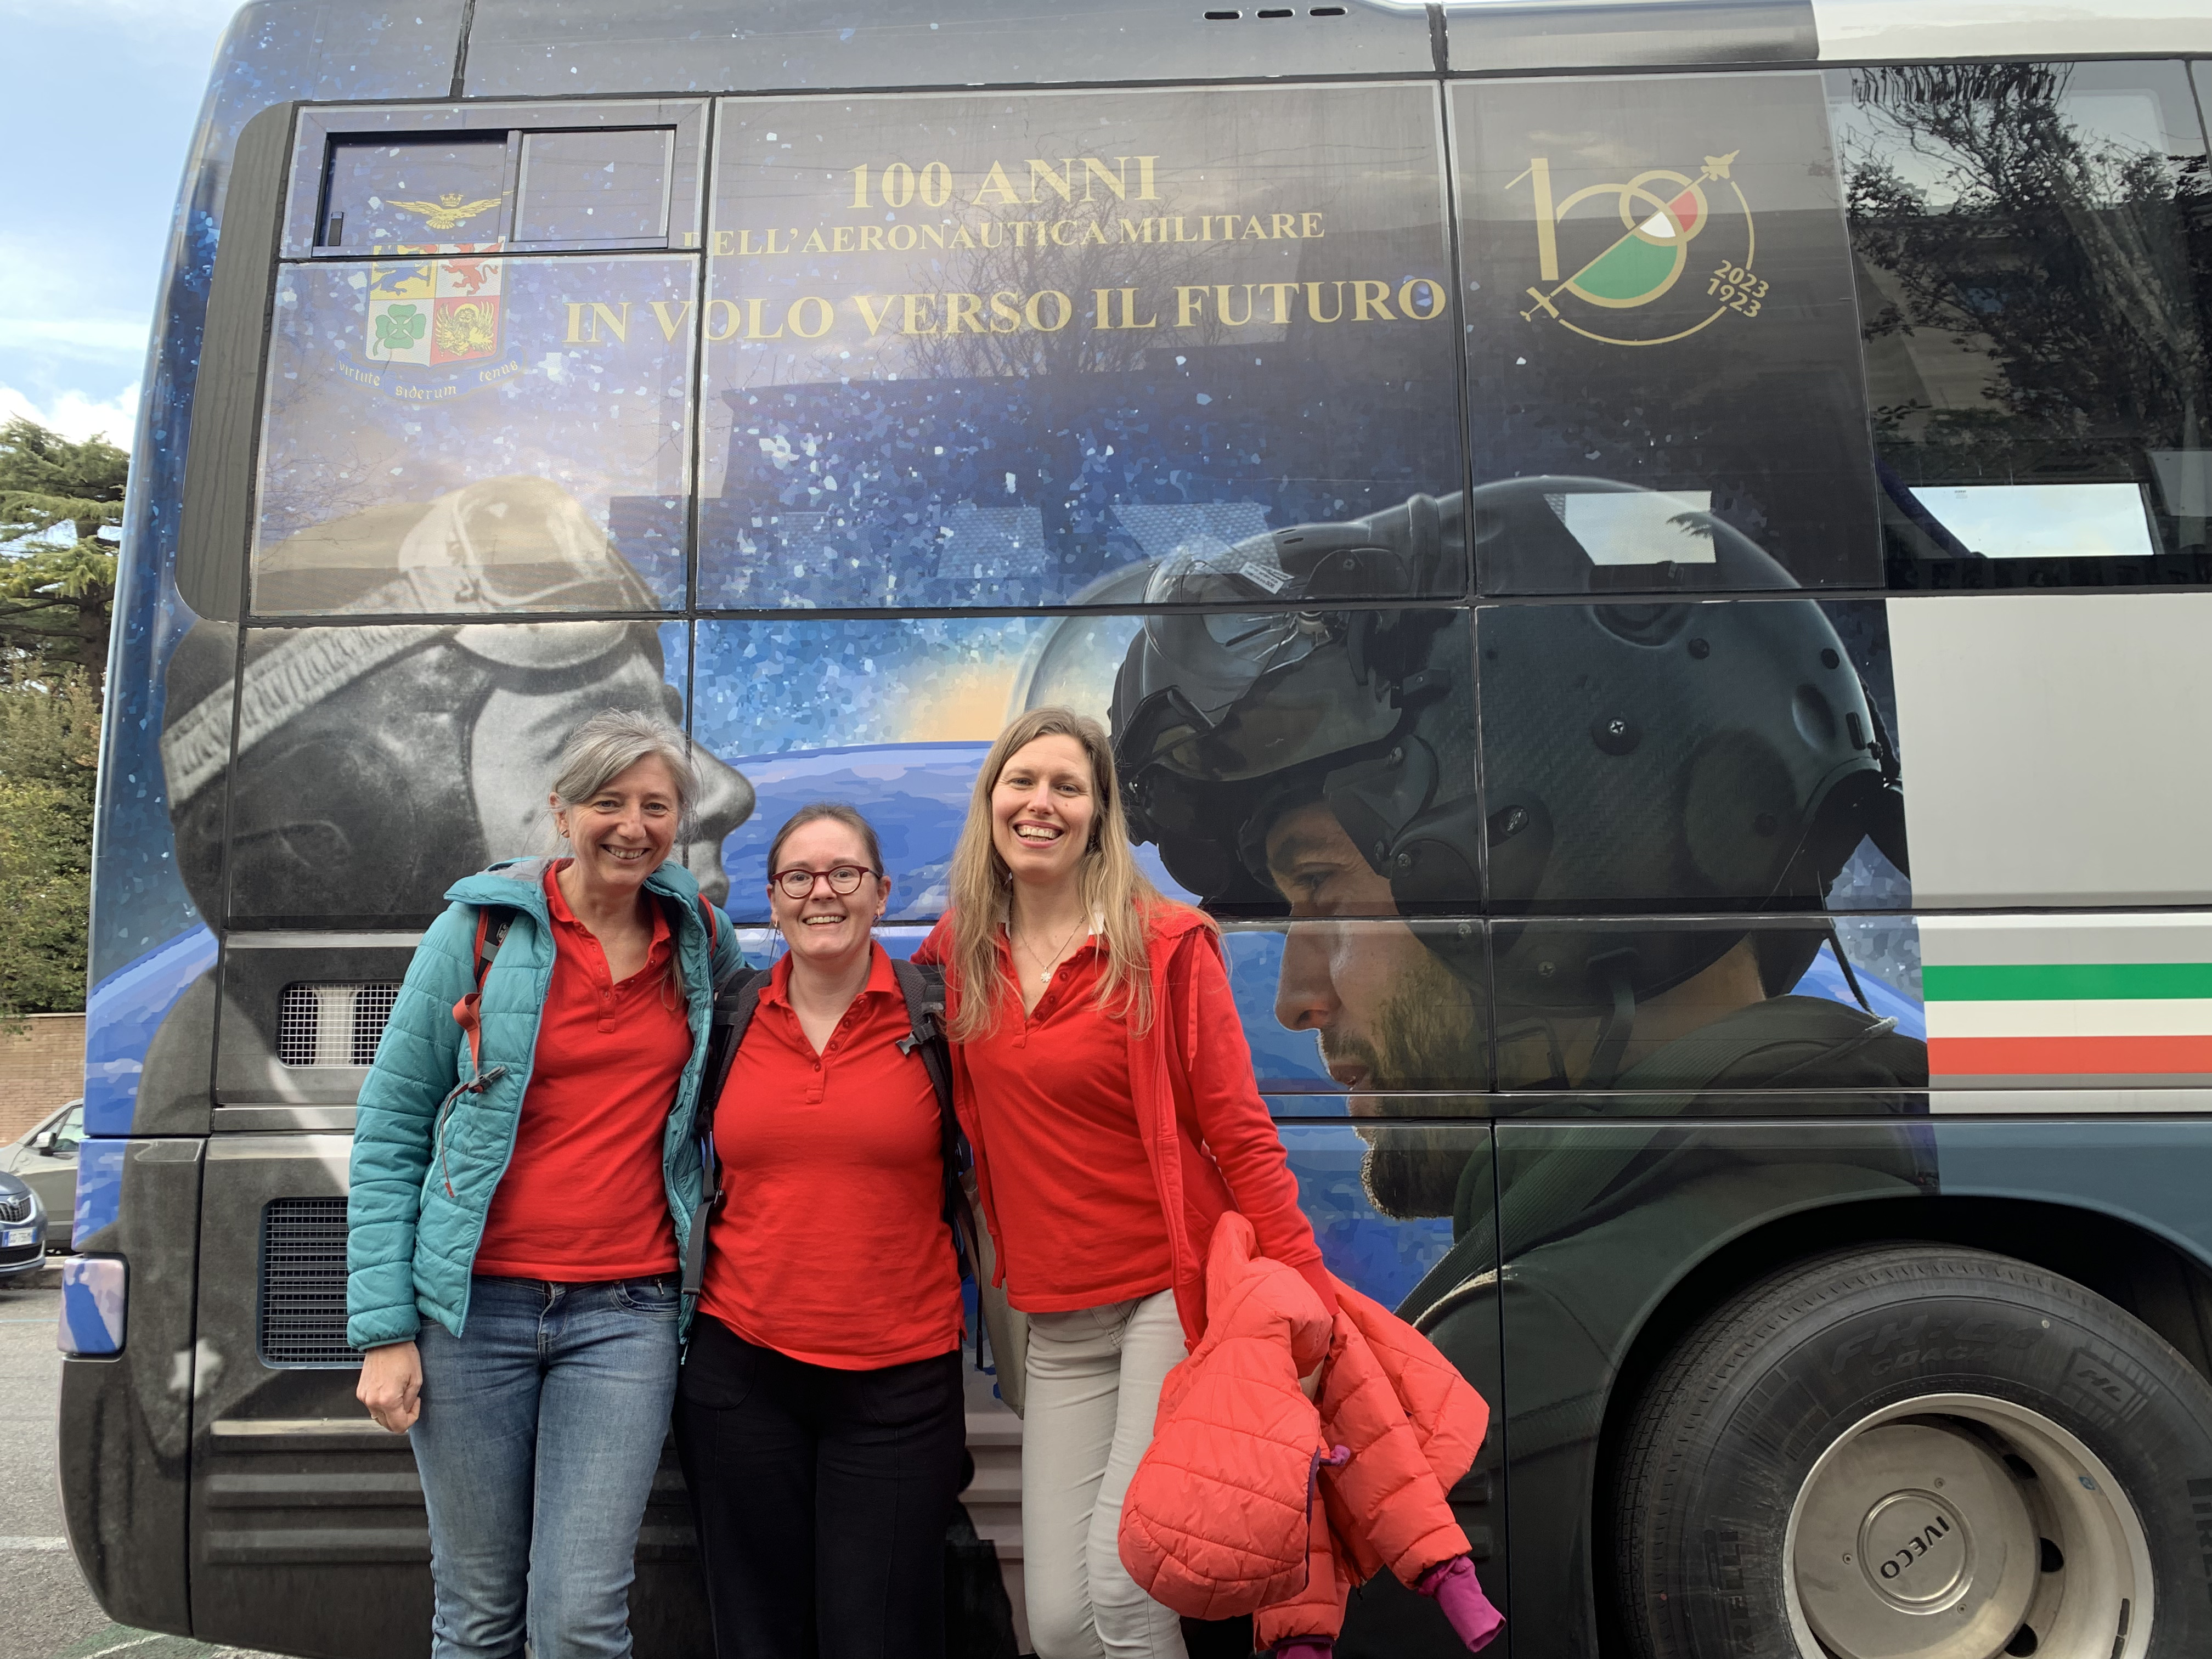
The STCE was invited to participate to the MILSWx-3 Meeting in Rome. This NATO panel aims to harmonize and standardize space weather support for NATO activities. More than 15 countries and organisations were represented by almost 50 delegates.
During this 3-day meeting, we presented our space weather products, forecasting and warning services, as well as our trainings and courses. There was a strong interest in the STCE's Space Weather Introductory Course. There is a clear need in the military context for education on space weather and its impacts. Our participation to this panel helps us to align the courses we provide to the needs of our military partners.
On Tuesday, after a full meeting day, our Italian Airforce hosts organised a very entertaining guided tour through the ancient city of Rome.
PROBA2 Observations (27 Feb 2023 - 5 Mar 2023)
Solar Activity
Solar flare activity fluctuated from low to high during the week.
In order to view the activity of this week in more detail, we suggest to go to the following website from which all the daily (normal and difference) movies can be accessed: https://proba2.oma.be/ssa
This page also lists the recorded flaring events.
A weekly overview movie (SWAP week 675) can be found here: https://proba2.sidc.be/swap/data/mpg/movies/weekly_movies/weekly_movie_2023_02_27.mp4.
Details about some of this week's events can be found further below.
If any of the linked movies are unavailable they can be found in the P2SC movie repository here: https://proba2.oma.be/swap/data/mpg/movies/.
Friday March 03
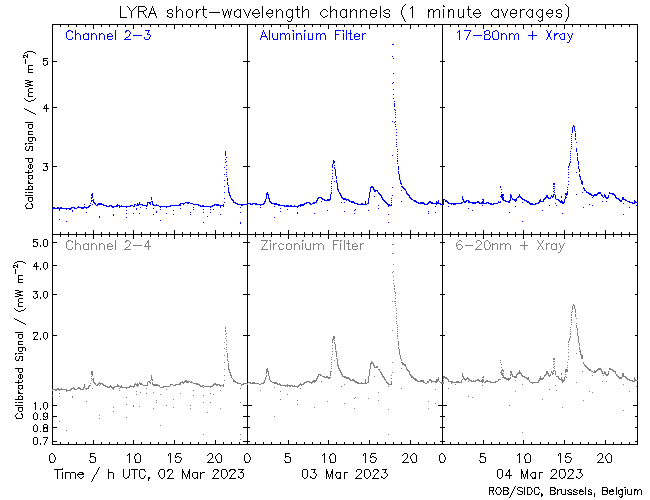
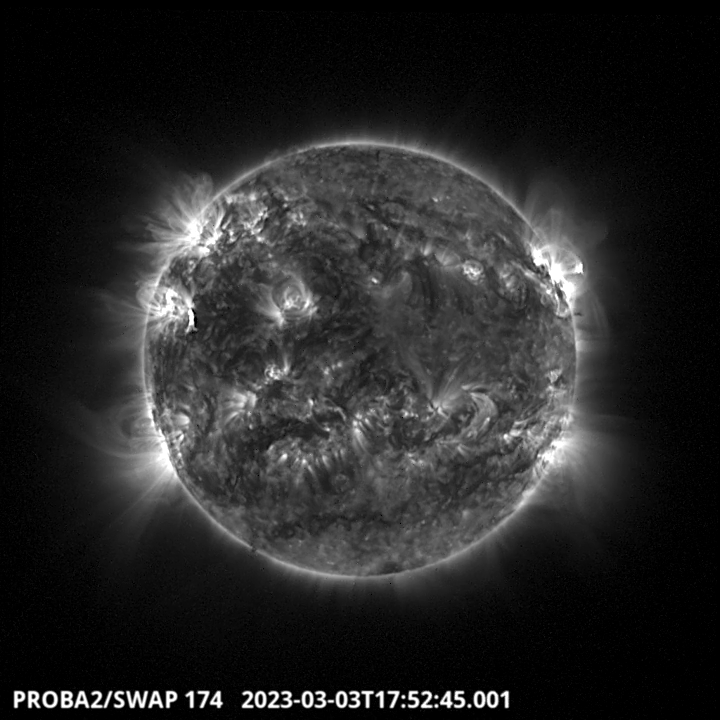
The largest flare of the week, an X2.1 flare, was observed by LYRA (top panel) and SWAP (bottom panel). The flare occurred on 2023-Mar-03 (peak at 17:52 UT) on the north-western hemisphere close to the limb, and it was associated with NOAA AR3234.
Find a SWAP movie of the event here: https://proba2.sidc.be/swap/movies/20230303_swap_movie.mp4.
The International Sunspot Index by SILSO
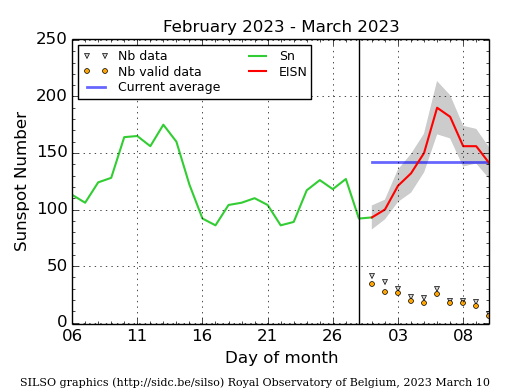
The daily Estimated International Sunspot Number (EISN, red curve with shaded error) derived by a simplified method from real-time data from the worldwide SILSO network. It extends the official Sunspot Number from the full processing of the preceding month (green line), a few days more than one solar rotation. The horizontal blue line shows the current monthly average. The yellow dots give the number of stations that provided valid data. Valid data are used to calculate the EISN. The triangle gives the number of stations providing data. When a triangle and a yellow dot coincide, it means that all the data is used to calculate the EISN of that day.
Noticeable Solar Events (27 Feb 2023 - 5 Mar 2023)
| DAY | BEGIN | MAX | END | LOC | XRAY | OP | 10CM | TYPE | Cat | NOAA |
| 28 | 1735 | 1750 | 1756 | M8.6 | 140 | 94 | 3234 | |||
| 01 | 0056 | 0107 | 0118 | S15E69 | M1.0 | SF | 3240 | |||
| 02 | 2105 | 2116 | 2125 | M3.8 | 94 | 3234 | ||||
| 03 | 1010 | 1032 | 1048 | N22W66 | M3.3 | 1F | 94 | 3234 | ||
| 03 | 1008 | 1032 | 1049 | N22W66 | M3.2 | 1F | 94 | 3234 | ||
| 03 | 1742 | 1752 | 1759 | N22W80 | X2.1 | 1B | 710 | II/1IV/1 | 94 | 3234 |
| 04 | 0706 | 0710 | 0714 | N17W39 | M1.0 | SN | III/2 | 3243 | ||
| 04 | 1334 | 1342 | 1347 | N8E43 | M1.2 | 1F | 5 | 3242 | ||
| 04 | 1519 | 1557 | 1626 | M5.2 | CTM/1IV/2 | 94 | 3234 | |||
| 05 | 0240 | 0252 | 0303 | N9W1 | M1.3 | SF | III/1 | 1 | 3238 | |
| 05 | 1624 | 1641 | 1653 | N10W12 | M1.0 | SF | 1 | 3238 | ||
| 05 | 1653 | 1701 | 1711 | M1.0 | 5 | 3242 | ||||
| 05 | 2129 | 2136 | 2141 | M5.0 | 91 | 3243 |
| LOC: approximate heliographic location | TYPE: radio burst type |
| XRAY: X-ray flare class | Cat: Catania sunspot group number |
| OP: optical flare class | NOAA: NOAA active region number |
| 10CM: peak 10 cm radio flux |
Geomagnetic Observations in Belgium (27 Feb 2023 - 5 Mar 2023)

Local K-type magnetic activity index for Belgium based on data from Dourbes (DOU) and Manhay (MAB). Comparing the data from both measurement stations allows to reliably remove outliers from the magnetic data. At the same time the operational service availability is improved: whenever data from one observatory is not available, the single-station index obtained from the other can be used as a fallback system.
Both the two-station index and the single station indices are available here: http://ionosphere.meteo.be/geomagnetism/K_BEL/
Review of solar activity
Flares
The solar flaring activity was high over the past week. NOAA active region 3234 was the most complex region on the part of the disc seen from Earth (with a magnetic complexity of beta-gamma-delta) and it produced most of the M-class flares and the X2.1-class flare that occurred on March 03 with a peaking time at 17:52 UTC. M-class flares also occurred in the NOAA active region 3238, 3240, 3242, and 3243. The other region on the disc did not show any significant flaring activity.
Solar wind disturbance: coronal hole
A large equatorial coronal hole (negative polarity) reached the central meridian on February 02.
Solar wind disturbance: coronal mass ejections
Several coronal mass ejections and flows were observed in the available SOHO/LASCO coronagraph imagery and automatically detected by the Cactus tool over the past 24 hours. No clear Earth-directed coronal mass ejections were identified.
Energetic Particles near Earth
In the beginning of the week, the greater than 10 MeV protons flux slowly returned below the 10 pfu threshold then it remained at the background levels. The greater than 2 MeV electron flux fluctuated around the 1000 pfu threshold due to the enhanced solar wind condition. The 24-hour electron fluence was also enhanced and reached moderate levels in response to the solar wind conditions.
Review of geomagnetic activity
Solar wind at L1
The solar wind environment near Earth was under the influence of high-speed streams.
On February 26, a shock was observed at 18:43 UTC with solar wind speed jumping from 479 km/s to 547 km/s and the total interplanetary magnetic field jumping from 9 nT to 19 nT. This marked the expected arrival of the CME that left the Sun on February 24. Following this shock, the solar wind speed further increased to over 700 km/s. The southward interplanetary magnetic component, Bz, was mostly southward reaching to -18 nT.
Then the solar wind conditions continued to be strongly enhanced with fast speed up to 880 km/s on February 27 due to combination of the expected fast wind from the equatorial coronal hole of negative polarity that transited the central meridian on February 25 and the expected arrival of the coronal mass ejection observed in SOHO/LASCO on February 25 with the M6.3-class flare. The total interplanetary magnetic reached values up to 15 nT, and the southward interplanetary magnetic component, Bz, was mostly southward reaching to -10 nT.
Close to the end of the week, Earth was under the influence of the fast solar wind streams associated to the equatorial coronal hole of negative polarity that reached the central meridian on March 02. The solar wind speed ranged between 500 km/s and 620 km/s.
Geomagnetic conditions
Over the past week, a major geomagnetic storm was observed starting around 06:00 UTC on February 27. The Kp-NOAA index remained between 6 and 7 for about 12 hours. The K-Belgium index was between 5 and 6. This geomagnetic storm was due to the arrival of the fast solar wind (with speed up to 880 km/s) that started to increase on February 26, at 21:00 UTC. Then the geomagnetic conditions were quiet to unsettle with short period of active conditions in response to the solar wind enhancement associated to the equatorial coronal hole, and the extended periods of southward interplanetary magnetic component, Bz, being negative.
The SIDC Space Weather Briefing
The Space Weather Briefing presented by the forecaster on duty from Feb 26 to March 5 . It reflects in images and graphs what is written in the Solar and Geomagnetic Activity report: https://www.stce.be/briefings/20230306_SWbriefing.pdf
If you need to access the movies, contact us: stce_coordination at stce.be
Review of ionospheric activity (27 Feb 2023 - 5 Mar 2023)

The figure shows the time evolution of the Vertical Total Electron Content (VTEC) (in red) during the last week at three locations:
a) in the northern part of Europe(N 61deg E 5deg)
b) above Brussels(N 50.5deg, E 4.5 deg)
c) in the southern part of Europe(N 36 deg, E 5deg)
This figure also shows (in grey) the normal ionospheric behaviour expected based on the median VTEC from the 15 previous days.
The VTEC is expressed in TECu (with TECu=10^16 electrons per square meter) and is directly related to the signal propagation delay due to the ionosphere (in figure: delay on GPS L1 frequency).
The Sun's radiation ionizes the Earth's upper atmosphere, the ionosphere, located from about 60km to 1000km above the Earth's surface.The ionization process in the ionosphere produces ions and free electrons. These electrons perturb the propagation of the GNSS (Global Navigation Satellite System) signals by inducing a so-called ionospheric delay.
See http://stce.be/newsletter/GNSS_final.pdf for some more explanations ; for detailed information, see http://gnss.be/ionosphere_tutorial.php
Calendar - check it
Check out our activity calendar: activities and encounters with the Sun-Space-Earth system and Space Weather as the main theme. We provide occasions to get submerged in our world through educational, informative and instructive activities.
If you want your event in our calendar, contact us: stce_coordination at stce.be
* March 14, PITHIA-NRF High Profile Meeting, Brussels, Belgium
* March 15, PITHIA-NRF Innovation Day, Brussels, Belgium
* March 16, PITHIA-NRF Training for Partners, Brussels, Belgium
* March 17, PITHIA-NRF Workshop for Optimization of Observational Strategies, Brussels, Belgium
* March 17, STCE seminar: The European Space Weather and Space Climate association (E-SWAN) and the future benefit for its community, Nicolet@spacepole and Teams, Brussels, Belgium
* March 27-29, STCE Space Weather Introductory Course, Brussels, Belgium - FULL
* April 21, BIRA-IASB seminar: High resolution modelling of atmospheric composition over Antwerp, Belgium, Nicolet@spacepole and Teams, Brussels, Belgium
* April 28, STCE seminar: Space Weather Tools in Support of Space Radiation Operations, Nicolet@spacepole and Teams, Brussels, Belgium
* May 22-24, STCE Space Weather Introductory Course, Brussels, Belgium - FULL
* May 25, STCE seminar: Comparative study of a constant-alpha force-free field and its approximations in an ideal toroid, Meridian room@spacepole and zoom, Brussels, Belgium
* May 29 - June 1, PITHIA-NRF Training School, Rome, Italy
Check: https://www.stce.be/calendar