- Table of Content
- 1.Job Opportunit...
- 2.The power of d...
- 3.Review of sola...
- 4.PROBA2 Observa...
- 5.International ...
- 6.Noticeable Sol...
- 7.Review of geom...
- 8.Geomagnetic Ob...
- 9.Review of iono...
- 10.The SIDC Space...
- 11.Agenda
2. The power of delta
3. Review of solar activity
4. PROBA2 Observations
5. International Sunspot Number by SILSO
6. Noticeable Solar Events
7. Review of geomagnetic activity
8. Geomagnetic Observations in Belgium
9. Review of ionospheric activity
10. The SIDC Space Weather Briefing
11. Agenda
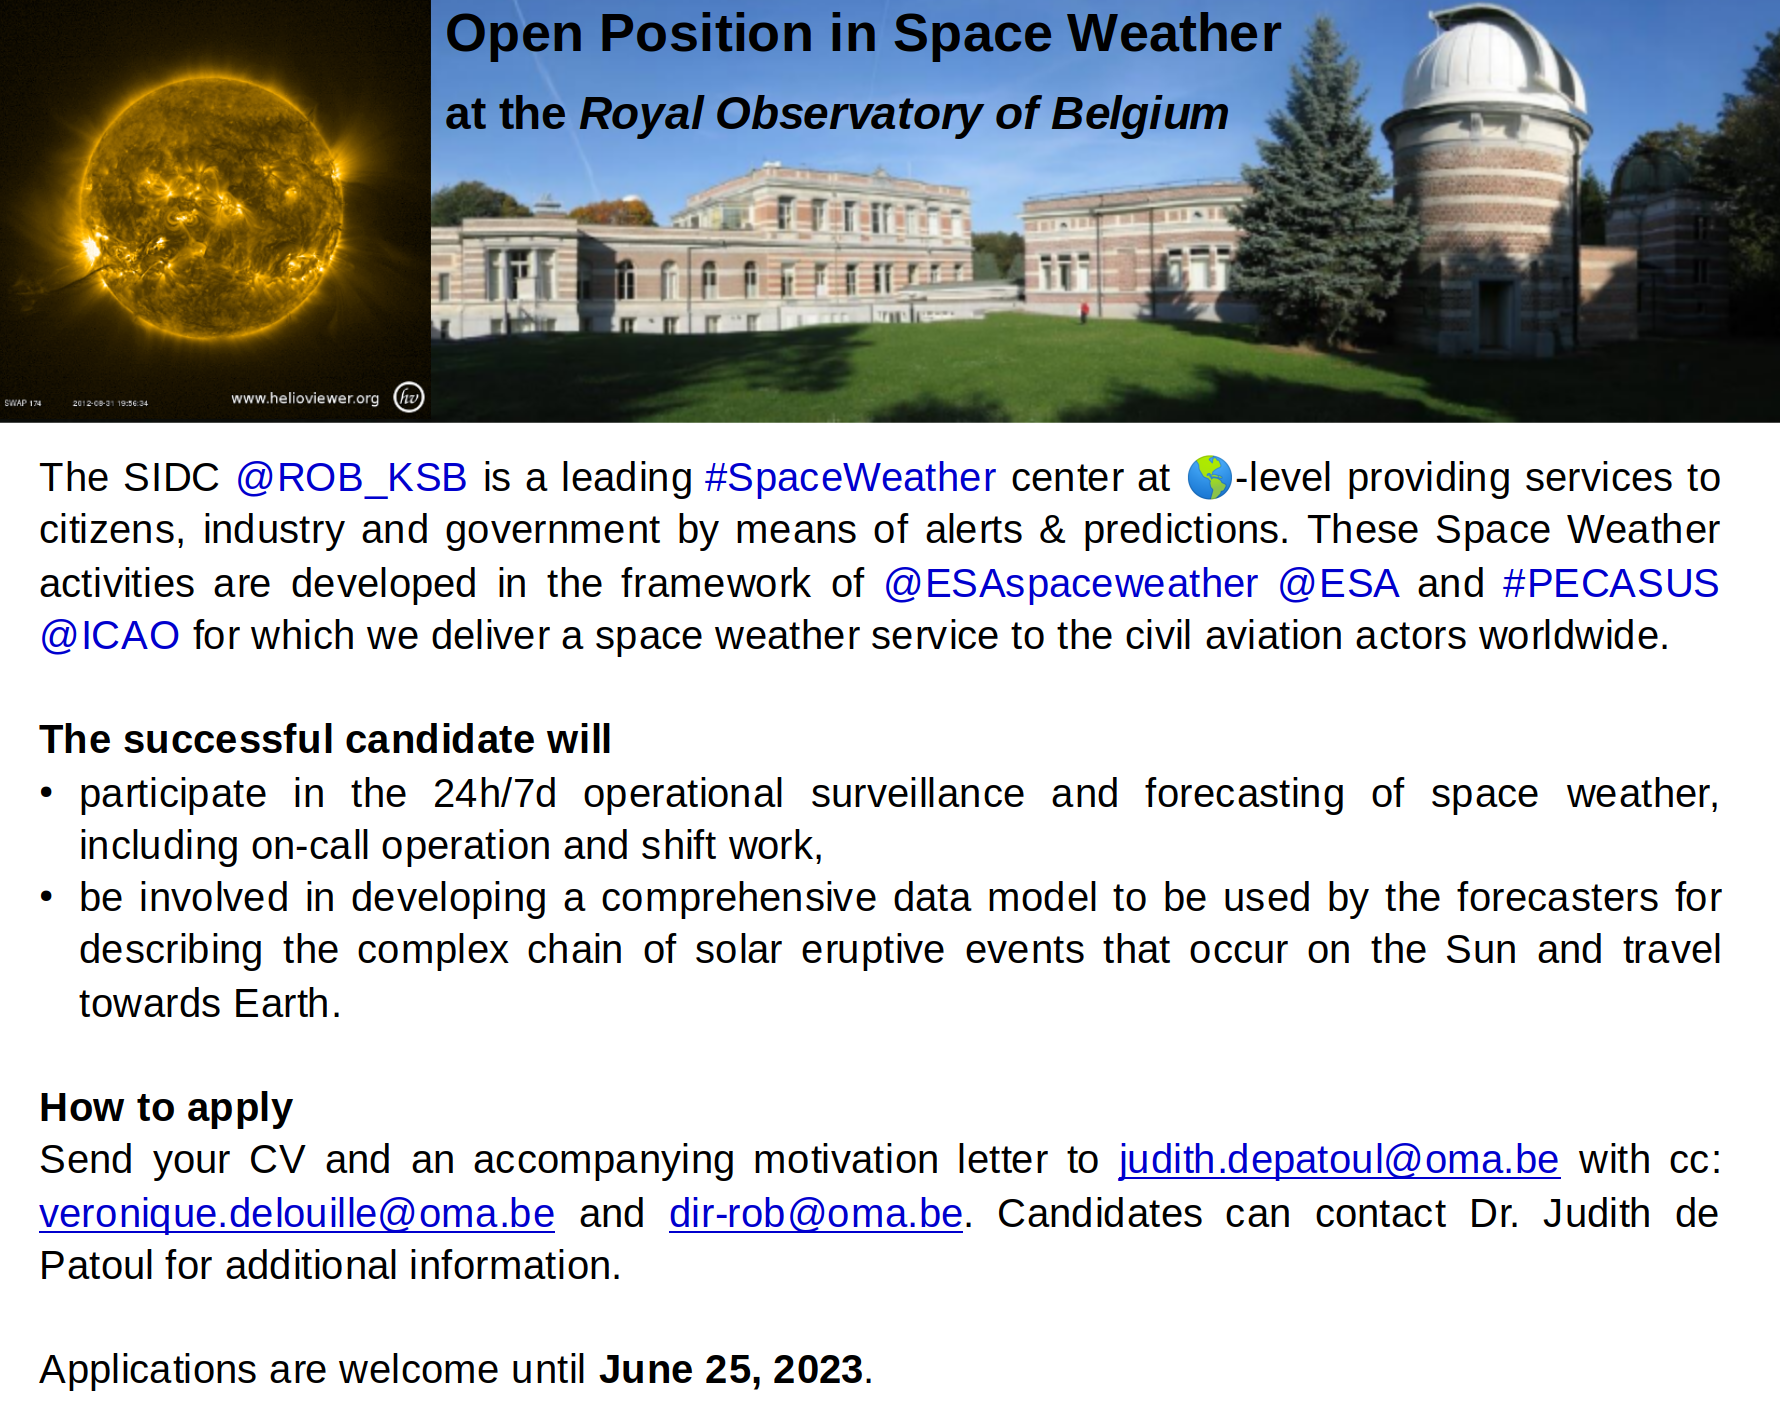
Job Opportunity
Join our Space Weather Forecast Center
As a federal scientific institute, the Royal Observatory of Belgium (ROB, https://www.astro.oma.be) provides services to citizens, industry, and government through alerts and predictions for space weather. To ensure the successful continuation of our operations in this highly competitive international context, ROB is seeking a collaborator to further develop and support its space weather services data service infrastructure for monitoring the Sun and improving space weather forecasting capabilities.
The successful candidate will participate to operational surveillance and forecasting of space weather, including on-call operation and shift work. The candidate will also be involved in developing a comprehensive data model to be used by the forecasters for describing the complex chain of solar eruptive events that occur on the Sun and travel towards Earth.
The complete information and instructions:
https://www.astro.oma.be/common/pdf/jobs/202306-SpaceWeatherCollaborator_EN.pdf.
Deadline for Applications: June 25, 2023
The power of delta
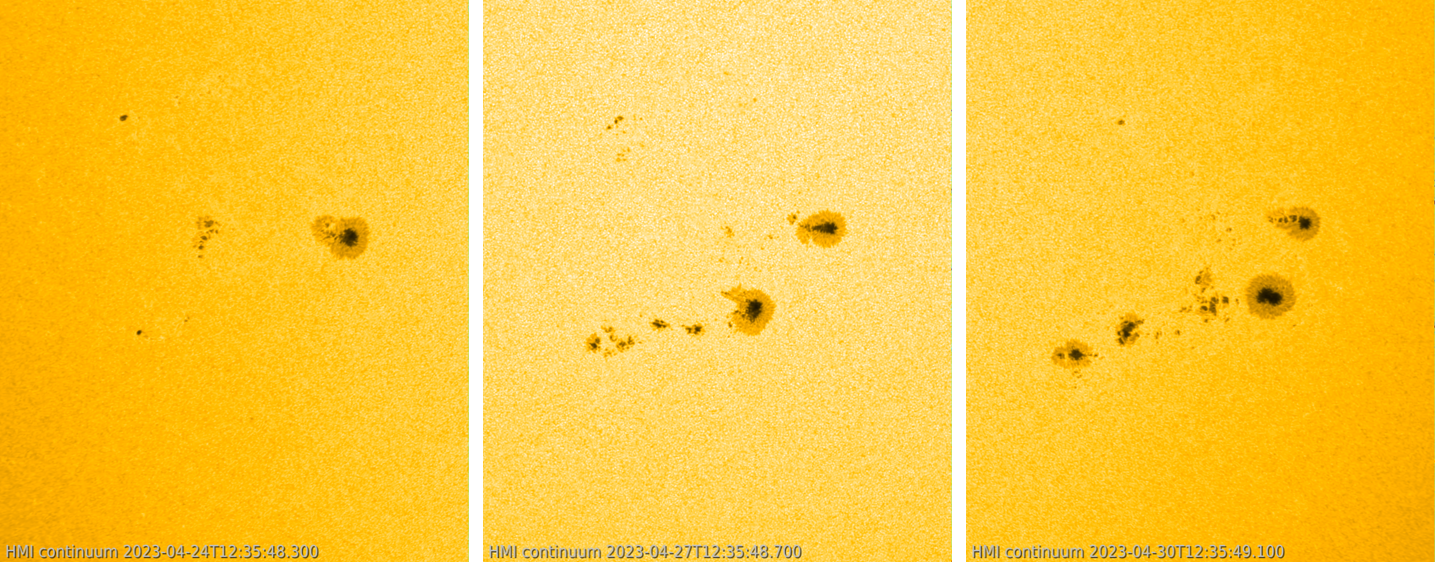
On 24 April, active region NOAA 3288 started to develop to the south-east of another fairly simple sunspot region, NOAA 3285. The first 3 days consisted mainly in maturing of the main spots, and the region remained fairly flare passive with only 2 minor C-class flares during this period. The images underneath (SDO/HMI - https://sdo.gsfc.nasa.gov/data/aiahmi/ ) show the Sun in white light on 24, 27 and 30 April, with a clip covering the period from 24 April to early 02 May available in the online version of this newsitem at https://www.stce.be/news/643/welcome.html Note how, in just a few days, the region develops from nothingness to a sunspot group that has an area more than twice the total surface area of the Earth. Also, the leading portion of the group gradually moves to the nearby active region NOAA 3285.
Then, late on 26 April, the middle portion of the sunspot group started to develop delta magnetic configurations. "Delta" is part of the Mount Wilson magnetic classification of sunspot groups. It is a suffix that can be appended to 3 of the 4 classes if the sunspot group contains at least one mature spot in which umbrae of opposite polarities are separated by less than 2 degrees and situated within the common penumbra. Delta regions have a much higher flaring probability than the other sunspot regions. More info on this classification scheme and examples can be found at the STCE's Space Weather Classification webpage https://www.stce.be/educational/classification#wilson

In the imagery above, the left image shows the sunspot groups NOAA 3285 / NOAA 3288 in white light, whereas the right image reflects the magnetic configuration with red colours for the positive magnetic polarity (field lines coming out of the solar surface), and blue for the negative magnetic polarity (field lines returning towards the solar surface). It shows the approximate locations of the C7, M1 and M7 flares that were produced by NOAA 3288 on 30 April and 01 May, superimposed on imagery of 30 April. They all originated from the delta-complex in the trailing portion of NOAA 3288, as can be seen in the annotated magnetogram. Note that the red colour in front (to the west) of the leading main sunspots of NOAA 3285 and 3288 is a line-of-sight effect due to the proximity of the groups to the solar limb, and so they do not constitute delta spots - See this STCE newsitem for more info https://www.stce.be/news/188/welcome.html
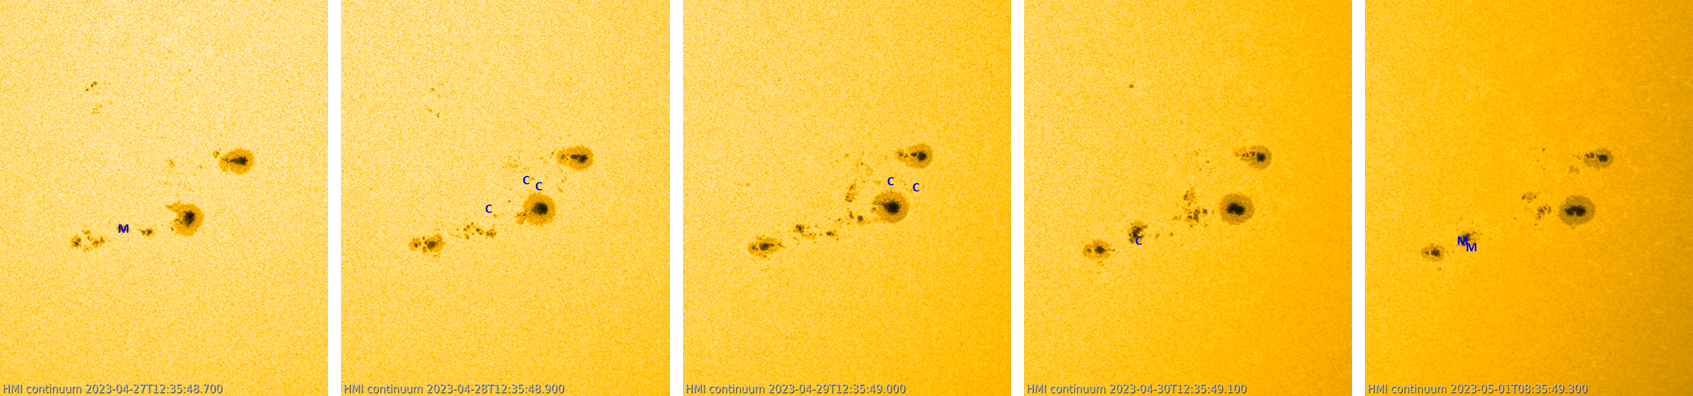
The online version of this newsitem contains a clip covering the period 27 April - 1 May (1 day cadence), with for each day the approximate location of every C5 or stronger flare produced by the NOAA 3285/3288 duo (white light above). The 3 M-class flares produced by NOAA 3288 all originated from the delta spots, but many of its C5+ flares seem to originate from the interaction between the leading portion of NOAA 3288 with the trailing portion of NOAA 3285, as well as with some opposite polarity magnetic flux that is present to the south of NOAA 3285's main spot. Whereas NOAA 3288 produced only 2 small C-class flares between 24 and 26 April, the combined effect of delta spots and magnetic interaction resulted in a total of 32 C-class flares (6 C5 or stronger) and 3 M-class flares during the 5 subsequent days (NOAA/SWPC data at https://www.swpc.noaa.gov/products/solar-and-geophysical-event-reports ). Underneath on the left is a white light image and on the right an extreme ultraviolet (EUV) image (SDO/AIA 094) of NOAA 3288 showing the M7.1 flare near its peak at 13:09UTC on 1 May. The blooming and diffraction patterns in the EUV images are image artefacts, not related to the flare - See this STCE newsitem at https://www.stce.be/news/499/welcome.html for more info.

Review of solar activity
Flares
Solar flaring activity was at a low levels for most of the past week with the exception of 27 Apr and 30 Apr. NOAA Active Region (AR) 3288 (magnetic configuration Beta, Catania group 67) produced an M1 flare at 27 Apr 11:14 UT, while NOAA AR 3293(magnetic configuration Beta-Delta) produced an M2 flare at 30 Apr 20:30 UT. Numerous C-class events were detected during the past week, mostly from NOAA AR 3285 (magnetic configuration Beta, Catania group 65) and NOAA AR 3288 that were closely located and in the process of merging during the past week.
Solar wind disturbances: Coronal Mass Ejections
There were multiple Coronal Mass Ejections (CME) observed over the week, but only two were judged to have a small chance of affecting the Earth's environment. The first one was a partial halo CME that could be seen in LASCO/C2 images starting from 27 Apr 01:25 UT and was estimated to arrive on 29 Apr. The second was also a partial halo CME that could be seen in LASCO/C2 images starting from 29 Apr 01:36 UT and was estimated to arrive on 1 or 2 May. None of the two CMEs arrived at the Earth's environment.
Solar wind disturbances: Coronal Holes
A small equatorial coronal hole (CH) of negative polarity started crossing the solar central meridian at 24 Apr. A northern CH with negative polarity also crossed the central meridian during 27 Apr.
Energetic particles near Earth
The greater than 10 MeV proton flux was at nominal levels over the past week. The greater than 2 MeV electron flux was below the 1000 pfu alert threshold from the start of the previous week until 26 Apr noon UT and above the limit for the majority of the time for the rest of the week. Similarly, the 24h electron fluence was at nominal levels until 26 Apr 15:20 UT and increased to moderate levels for the
rest of the past week.
PROBA2 Observations
Solar Activity
Solar flare activity fluctuated from low to moderate during the week.
In order to view the activity of this week in more detail, we suggest to go to the following website from which all the daily (normal and difference) movies can be accessed: https://proba2.oma.be/ssa
This page also lists the recorded flaring events.
A weekly overview movie can be found here (SWAP week 683). https://proba2.oma.be/swap/data/mpg/movies/weekly_movies/weekly_movie_2023_04_24.mp4
Details about some of this week's events can be found further below.
If any of the linked movies are unavailable they can be found in the P2SC movie repository here: https://proba2.oma.be/swap/data/mpg/movies/
Monday Apr 24
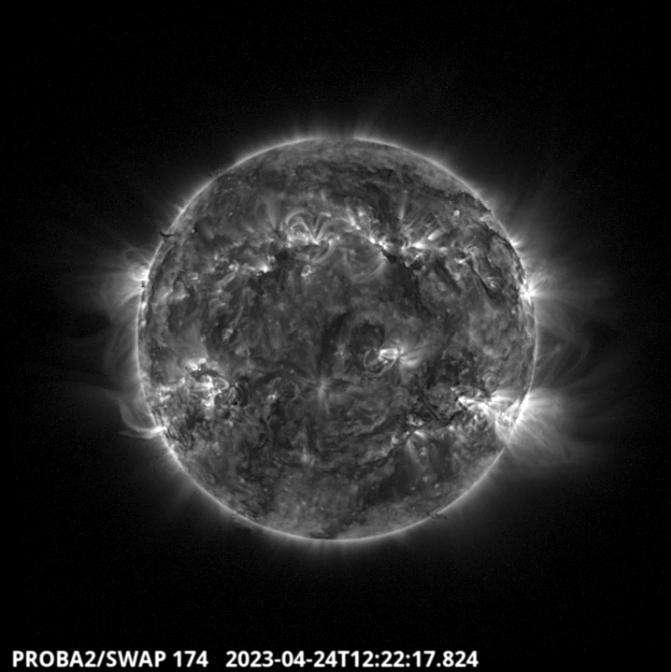
A filament erupted in the South Hemisphere around 12:22 UT. Find a SWAP movie of the event here: https://proba2.oma.be/swap/data/mpg/movies/20230424_swap_movie.mp4
Thursday Apr 27
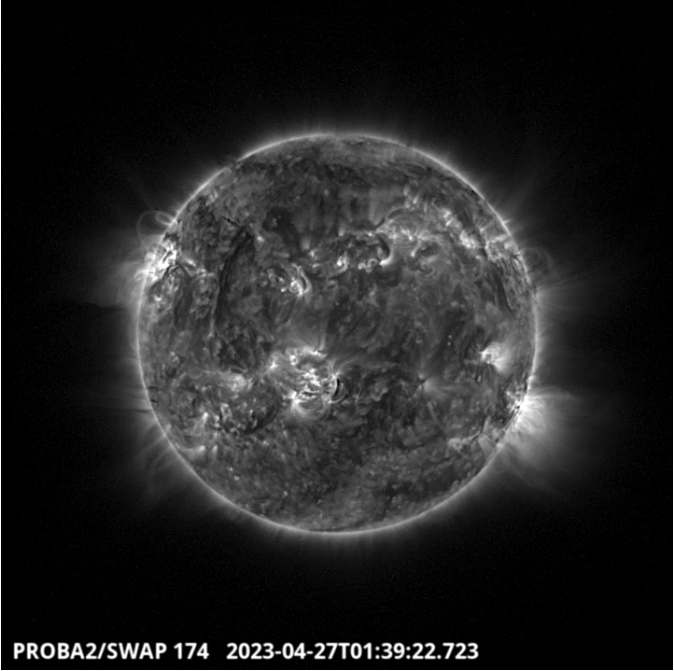
A filament erupted in the North Eastern Hemisphere around 1:50 UT, it was associated to a C2.5 flare (AR NOAA 3289). Around 4:33 UT a second filament eruption occurred at the same area. Find a SWAP movie of the event here: https://proba2.oma.be/swap/data/mpg/movies/20230427_swap_movie.mp4
Sunday Apr 30
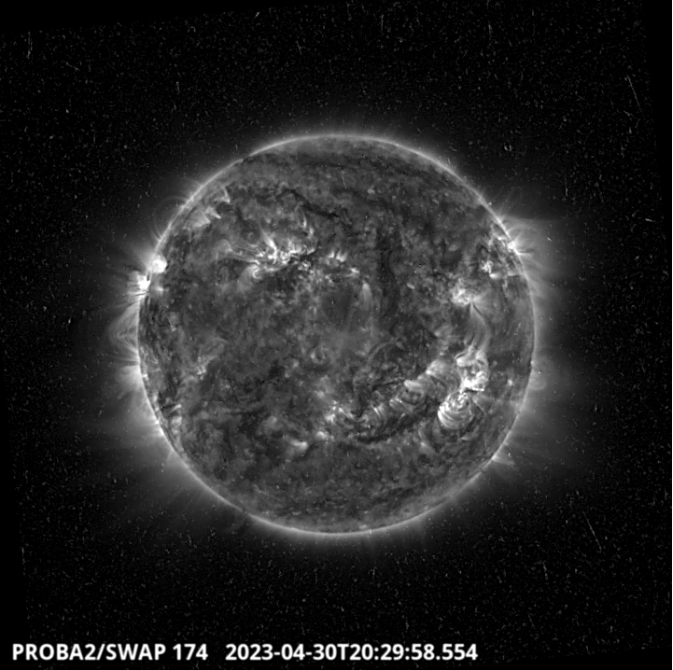
A M2.4 flare was produced by the AR 3293 on the eastern limb of the disk around 20:30 UT. This is the largest flare of the week. Find a SWAP movie of the event here: https://proba2.oma.be/swap/data/mpg/movies/20230430_swap_movie.mp4
International Sunspot Number by SILSO
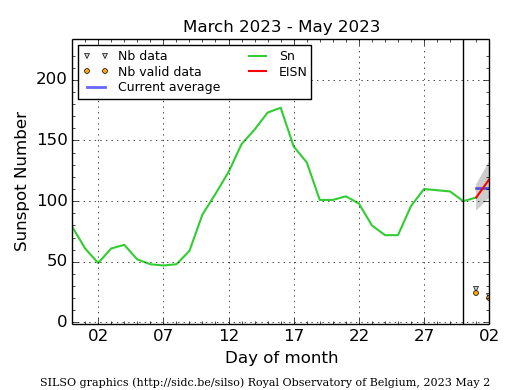
The daily Estimated International Sunspot Number (EISN, red curve with shaded error) derived by a simplified method from real-time data from the worldwide SILSO network. It extends the official Sunspot Number from the full processing of the preceding month (green line), a few days more than one solar rotation. The horizontal blue line shows the current monthly average. The yellow dots give the number of stations that provided valid data. Valid data are used to calculate the EISN. The triangle gives the number of stations providing data. When a triangle and a yellow dot coincide, it means that all the data is used to calculate the EISN of that day.
Noticeable Solar Events
| DAY | BEGIN | MAX | END | LOC | XRAY | OP | 10CM | TYPE | Cat | NOAA |
| 27 | 1104 | 1114 | 1123 | S23E4 | M1.8 | SN | 67 | 3288 | ||
| 30 | 1956 | 2028 | 2043 | M2.4 | 3293 |
| LOC: approximate heliographic location | TYPE: radio burst type |
| XRAY: X-ray flare class | Cat: Catania sunspot group number |
| OP: optical flare class | NOAA: NOAA active region number |
| 10CM: peak 10 cm radio flux |
Review of geomagnetic activity
Solar wind at L1
Solar Wind (SW) conditions were dominated by the arrival of a Coronal Mass Ejection (CME) on 24 Apr and a High Speed Stream (HSS) on 26 Apr that lasted until the end of the week. The CME arrival caused an increase of the SW speed to 650 km/s and of the total interplanetary magnetic field (Btot) to 35 nT. The North-South component of the magnetic field (Bz) dropped to -35 nT and the interplanetary magnetic field (phi) angle was predominantly directed towards the Sun while influenced by the CME. On 25 Apr the effects of the CME waned significantly, until the arrival of the HSS. The SW speed then increased to 700 km/s, although Btot remained below 10 nT and Bz fluctuated between -9 and 9 nT. The phi angle was predominantly directed towards the Sun while affected by the HSS.
Geomagnetic conditions
Geomagnetic conditions reached globally severe storm and strong storm levels on 24 Apr (Kp 7 00:00-03:00, Kp 8 03:00-06:00 UT, and Kp 7- 06:00-09:00), while for the rest of that day they were at minor to moderate storm levels. The conditions became quiet to moderate for the next days until the arrival of the HSS that caused active to moderate conditions (Kp 4+ to 3-) during several 3-hours intervals from 27 Apr until the end of the week. The local conditions reached storm level (K BEL 6) on 24 Apr and dropped to active (K BEL 4) on 25 Apr and then to moderate (K BEL 3). They reached active conditions again on 28 and 29 Apr (K BEL 4) before dropping again to moderate (K BEL 3) on 30 Apr.
Geomagnetic Observations in Belgium
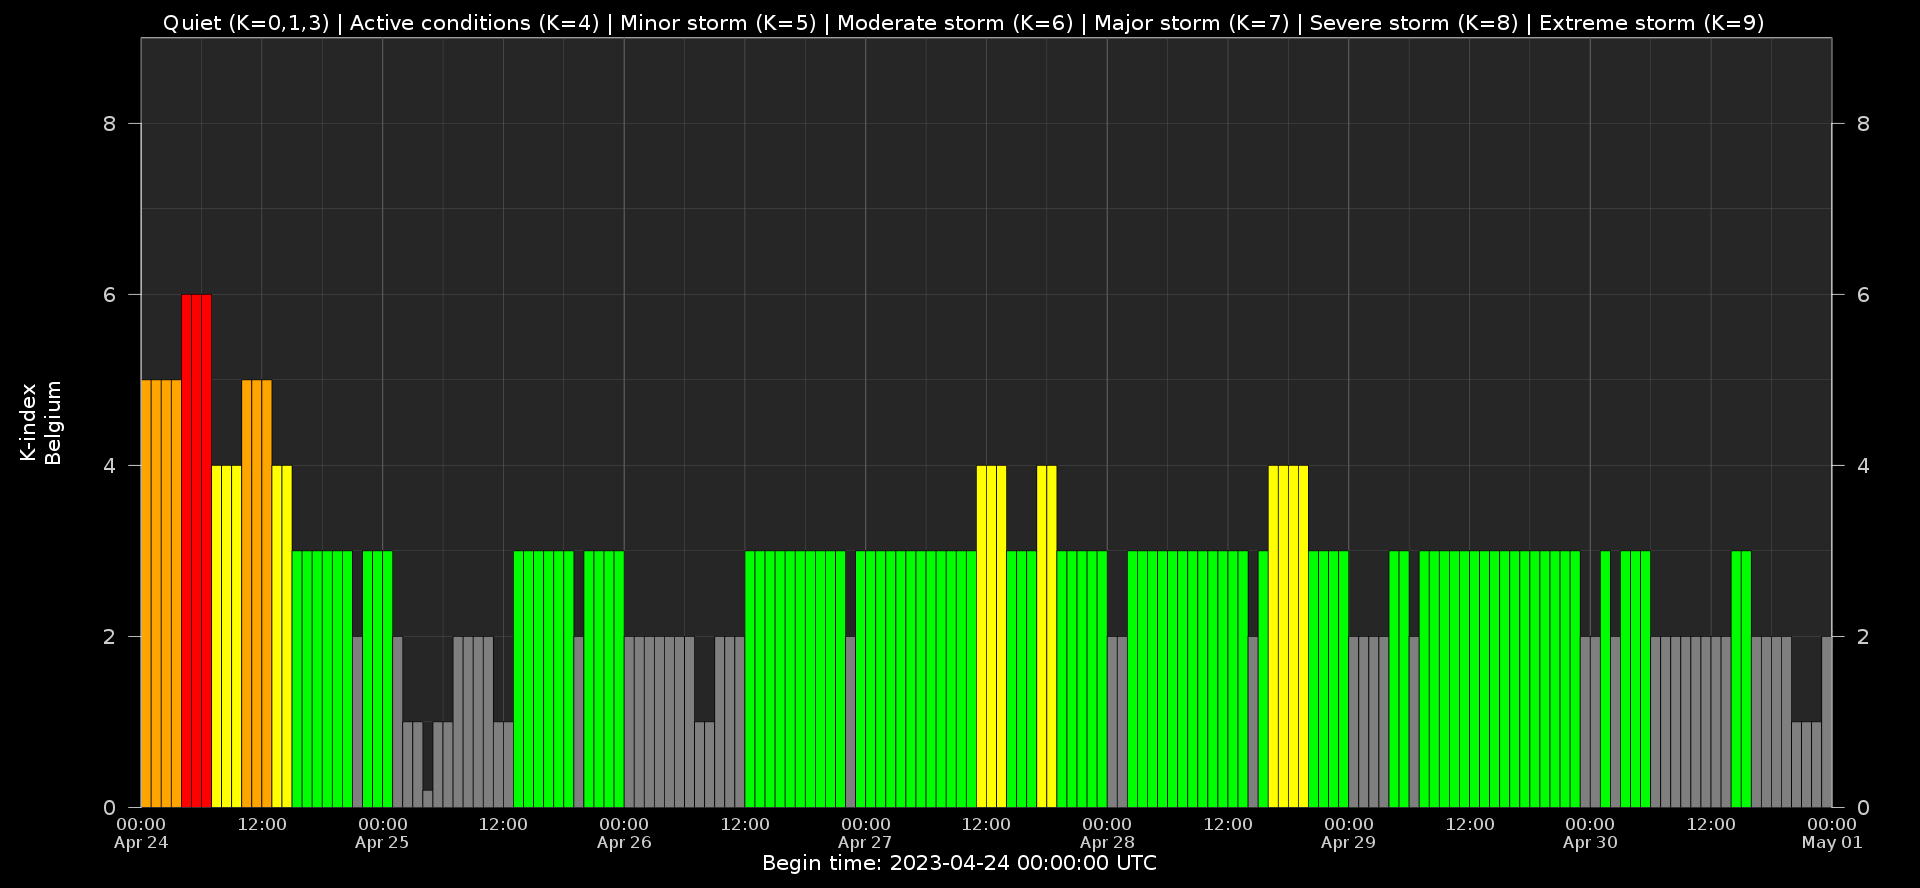
Local K-type magnetic activity index for Belgium based on data from Dourbes (DOU) and Manhay (MAB). Comparing the data from both measurement stations allows to reliably remove outliers from the magnetic data. At the same time the operational service availability is improved: whenever data from one observatory is not available, the single-station index obtained from the other can be used as a fallback system.
Both the two-station index and the single station indices are available here: http://ionosphere.meteo.be/geomagnetism/K_BEL/
Review of ionospheric activity

The figure shows the time evolution of the Vertical Total Electron Content (VTEC) (in red) during the last week at three locations:
a) in the northern part of Europe(N 61deg E 5deg)
b) above Brussels(N 50.5deg, E 4.5 deg)
c) in the southern part of Europe(N 36 deg, E 5deg)
This figure also shows (in grey) the normal ionospheric behaviour expected based on the median VTEC from the 15 previous days.
The VTEC is expressed in TECu (with TECu=10^16 electrons per square meter) and is directly related to the signal propagation delay due to the ionosphere (in figure: delay on GPS L1 frequency).
The Sun's radiation ionizes the Earth's upper atmosphere, the ionosphere, located from about 60km to 1000km above the Earth's surface.The ionization process in the ionosphere produces ions and free electrons. These electrons perturb the propagation of the GNSS (Global Navigation Satellite System) signals by inducing a so-called ionospheric delay.
See http://stce.be/newsletter/GNSS_final.pdf for some more explanations ; for detailed information, see http://gnss.be/ionosphere_tutorial.php
The SIDC Space Weather Briefing
The Space Weather Briefing presented by the forecaster on duty from April 23 to April 30. It reflects in images and graphs what is written in the Solar and Geomagnetic Activity report: https://www.stce.be/briefings/20230501_SWbriefing.pdf
.png)
If you need to access the movies, contact us: stce_coordination at stce.be
Agenda
Check out our activity calendar: activities and encounters with the Sun-Space-Earth system and Space Weather as the main theme. We provide occasions to get submerged in our world through educational, informative and instructive activities.
If you want your event in our calendar, contact us: stce_coordination at stce.be
* May 8, STCE Lecture: From Physics to Forecasting, Space Weather Training Course, ESA Academy, Redu, Belgium
* May 9, KUL/CmPA seminar: Nonequilibrium solar wind particle distributions: Why care?, 200B 01.04 and online, Leuven, Belgium
* May 10, guided tour of the Research and Service Centre of the STCE, Space Weather Training Course, ESA Academy, Brussels, Belgium
* May 11, KUL/CmPA seminar: Comparative study of a constant-alpha force-free field and its approximations in an ideal toroid, 200B 01.16 and online, Leuven, Belgium
* May 16, KUL/CmPA seminar: Magnetohydrodynamic modelling of Alfven waves in the solar corona, 200B 02.16 and online, Leuven, Belgium
* May 22-24, STCE Space Weather Introductory Course, Brussels, Belgium - FULL
* May 25, STCE seminar: Comparative study of a constant-alpha force-free field and its approximations in an ideal toroid, Meridian room at the Space Pole and zoom, Brussels, Belgium
* May 25, RMI Seminar: Towards a new hydrometeors identification tool at the RMI, conference room of the RMI, Brussels, Belgium
* May 29 - June 1, PITHIA-NRF Training School, Rome, Italy
* June 12-14, STCE Space Weather Course for BKG, Brussels, Belgium
Check: https://www.stce.be/calendar