- Table of Content
- 1.Filament erupt...
- 2.Review of Spac...
- 3.PROBA2 Observa...
- 4.The SIDC Space...
- 5.Noticeable Sol...
- 6.International ...
- 7.Geomagnetic Ob...
- 8.Review of Iono...
- 9.Calendar
2. Review of Space Weather
3. PROBA2 Observations (30 Oct 2023 - 5 Nov 2023)
4. The SIDC Space Weather Briefing
5. Noticeable Solar Events
6. International Sunspot Number by SILSO
7. Geomagnetic Observations in Belgium
8. Review of Ionospheric Activity
9. Calendar
Filament eruptions and polar lights
After a few weeks of relative calmness, solar activity picked up again with some M-class flares and especially the eruption of some of the many filaments that were visible on the solar disc. Solar filaments are clouds of charged particles ("plasma") above the solar surface squeezed between magnetic regions of opposite polarity. Being cooler and denser than the plasma underneath and their surroundings, they appear as dark lines when seen on the solar disk. Special filters are required to observe these features, such as in the Hydrogen-alpha (H-alpha) line in the red part of the solar spectrum at a wavelength of 656.3 nm. The annotated H-alpha imagery underneath is from the GONG network (https://gong.nso.edu/ ) and displays the 3 relevant filament eruptions on 31 October, 2 November and 3 November. Each time, the situation prior to, during and after the eruption is shown.
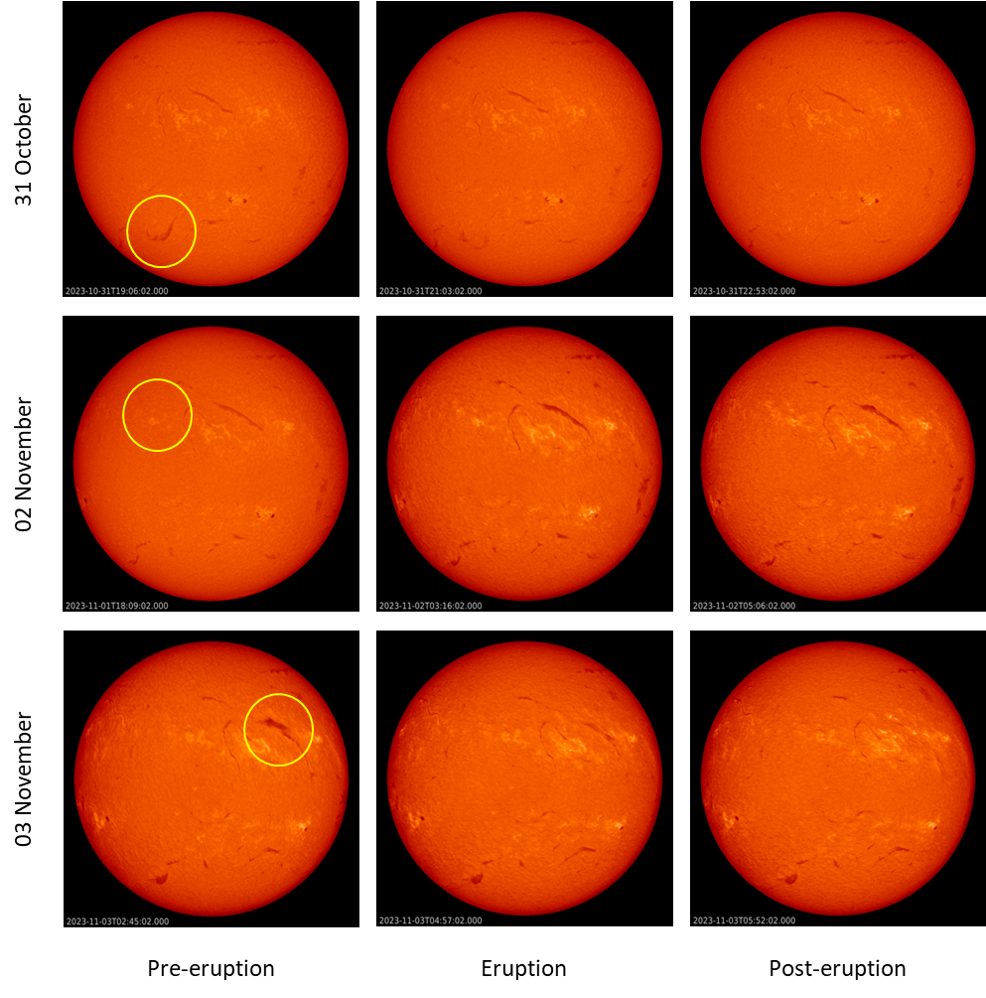
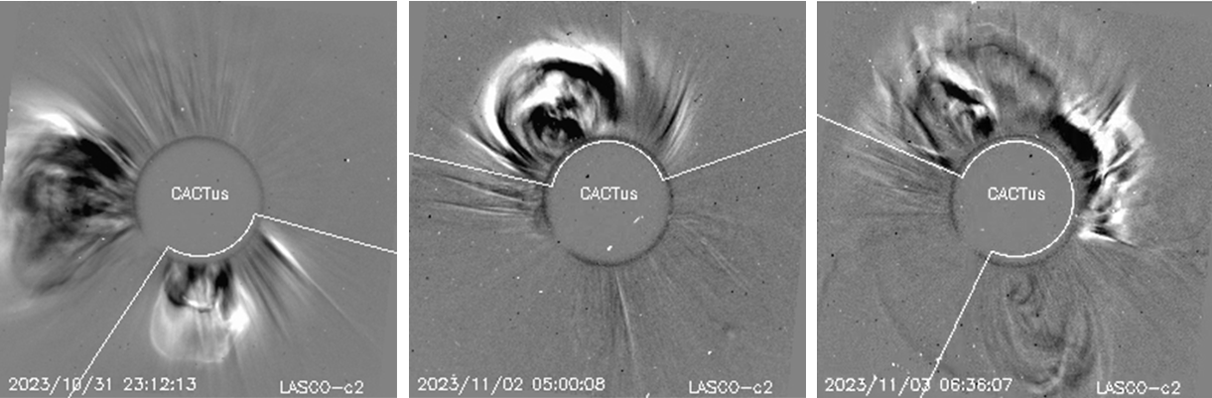
The first event is a typical by-the-book filament eruption, occurring in the southeast solar quadrant late on 31 October. From an analysis with the CACTus tool (https://www.sidc.be/cactus/ ), the SIDC space weather forecaster (https://www.sidc.be/ ) judged that the resulting coronal mass ejection (CME - see the SOHO/LASCO imagery underneath) might have an earth-directed component, though the bulk of the CME was being directed south of the Sun-Earth line. The second eruption took place on 2 November and was a lot more interesting. In the H-alpha images, there's actually no filament to be seen in the location prior to the eruption! In fact, this concerned the eruption of an empty filament channel. The filament channel is thought to be the magnetic structure within which usually lies the filament plasma. However, not all filament channels are filled with filament plasma, even though the observation of such empty filament channels is quite rare. In certain cases only segments of a filament are seen along the same polarity inversion line, i.e. an imaginary line separating areas of positive magnetic polarity from negative magnetic polarity. An empty filament channel is thought to be part of the filament formation process (Parenti S. ; 2014 - https://link.springer.com/article/10.12942/lrsp-2014-1 ). The CME associated with this rare type of eruption was also thought to have an earth-directed component.
Finally, during the morning hours of 3 November, the most violent of the 3 filament eruptions took place. The post-eruption coronal loops remained visible in extreme ultraviolet (EUV) imagery (SDO/AIA 094 - http://sdo.gsfc.nasa.gov/data/aiahmi/) several hours after the event in H-alpha had already ended (see the imagery underneath). It concerned the largest of the 3 filaments (about 30 degrees), and the size of the eruption itself reached all the way to the solar equator. Being so violent and located in the western solar hemisphere, the event slightly enhanced the greater than 10 MeV proton flux above its background values, but remained below the alert threshold.

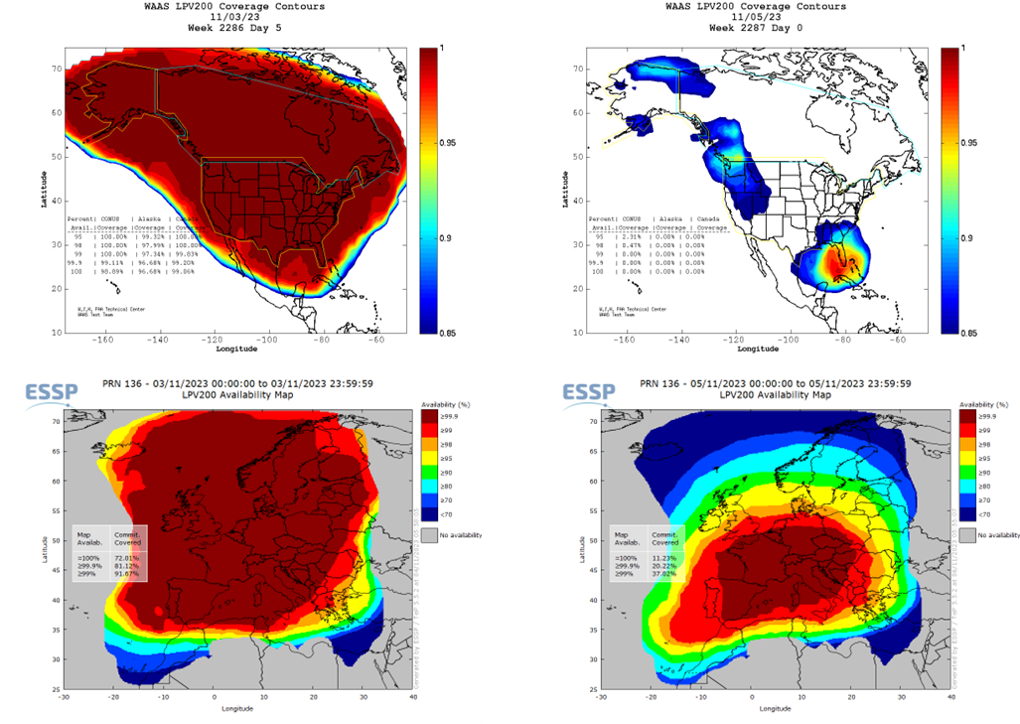
All 3 CMEs were thought to be directed to Earth, and sure enough they all 3 arrived and this within SIDC the forecast uncertainty margins. The first CME arrived around noon on 4 November, sparking only a brief minor geomagnetic storm (DSCOVR - https://www.swpc.noaa.gov/products/real-time-solar-wind ). The two other CMEs arrived within a few hours of each other on 5 November, with shocks observed by DSCOVR at 08:13 and 11:48 UTC. The north-south component of the interplanetary magnetic field dipped to -27nT, a value not often seen so far this solar cycle. This one-two punch delivered to the earth's magnetic field resulted in a major geomagnetic storm, with the Kp index reaching 7 (on a scale from 0 to 9), the Disturbance storm-time index reaching -165 nT (WDC Kyoto - https://wdc.kugi.kyoto-u.ac.jp/ ), making it into the top 3 of strongest storm this year together with the famous storms in March and April. Deep red aurora were photographed from Belgium and locations as far south as Arizona and Texas in the USA, and Portugal and Italy in Europe (Spaceweather.com Realtime Aurora Photo Gallery - https://spaceweathergallery2.com/index.php?title=aurora ). For civil aviation, some advisories were issued for depressed maximum useable frequencies in the 3 to 30 MHz (HF) range. Certain satellite-based applications for aviation in Europe (EGNOS: https://egnos-user-support.essp-sas.eu/ ) and USA (WAAS - https://www.nstb.tc.faa.gov/ ) were affected too as shown in the availability maps underneath for an undisturbed day (left) and on 5 November. A red color in this case means good coverage and availability...
Review of Space Weather
Solar Active Regions (ARs) and flares
The solar flaring activity over the past week was low to moderate. Ten (10) active regions on the visible solar disc facing Earth and 6 M-class flares were recorded. NOAA AR 3474 (beta-gamma) was the largest and most complex active region, which however produced mainly low levels of activity and a single isolated M-class flare. Four of the moderate flares throughout the week were produced by NOAA AR 3480 and another low isolated M-class flaring was produced by NOAA 3477. Other notable regions were NOAA AR 3472 and NOAA AR 3473, which contributed to the low levels of activity. The remaining active regions have been either simple and inactive or have predominantly shown very low levels of activity.
Coronal mass ejections
The solar surface was streaked with filaments and three notable filament eruptions were related to coronal mass ejections (CMEs) with an Earth-directed component.
The filament in the south-east quadrant erupted late on Oct 31st and produced a south-west CME with an estimated projected velocity of the CME is around 500 km/s, which was first detected by LASCO C2 at 22:24 UTC. The CME was estimated to arrive to Earth around 03 UTC on Nov 4th.
The second CME with an Earth-directed component was related to a small filament eruption near a plage region in the north-east quadrant neighbouring the upper end of a large negative polarity coronal hole in the eastern hemisphere. The partial halo CME was first observed in the LASCO C2 data around 03:24 UTC on Nov 2nd. It had a projected velocity below 300 km/s and was expected to arrive to Earth on Nov 6th.
The third and most notable CME was related to a very large filament eruption in the north-west quadrant in the early UTC morning of Nov 3rd. A resulting partial halo CME was first seen in the LASCO C2 images at 05:36 UTC and was estimated to arrive late on Nov 5th.
Coronal Holes
A positive polarity coronal hole had crossed the central meridian the previous week and was affecting Earth in the beginning of the week. A large negative polarity coronal hole spreading from the equatorial bands to mid-latitudes in the Southern hemisphere reached the central meridian early UTC on Nov 4th. The fast speed stream from this coronal hole was expected to arrive to Earth on Nov 6th or Nov 7th and influence the near-Earth solar wind for several days.
Proton flux levels
The greater than 10 MeV proton flux was at the background level during the whole week with minor enhancements on Nov 3rd probably due to particles accelerated at the shock front of the Nov 3rd CME.
Electron fluxes at GEO
The greater than 2 MeV electron flux was oscillating above and around the 1000 pfu threshold throughout most of the week. The corresponding electron fluence started ar nominal levels and increased to moderate levels for the remaining of the week.
Solar wind
The week started with enhanced solar wind velocities related to the positive polarity coronal hole that crossed the central meridian the previous week. The solar wind conditions subsided towards slow regime by Nov 2nd and remained undisturbed until the first ICME passed at L1 around noon on Nov 4th, when the interplanetary magnetic field (B) increased to 17 nT with a minimum north-south component (Bz) down to -14 nT. The solar wind density reached about 50 ppcc. While the solar wind velocity remained slow mostly below 350 km/s.
A fast-forward shock was observed in the solar wind (ACE and DSCOVR) at 08:13 UTC on Nov 5th marking the early arrival of the anticipated partial halo CME from Nov 2nd. During this ICME arrival the B field increased to 34 nT with a minimum Bz of -24 nT. The density underwent moderate increase up to about 30 ppcc, while the solar wind velocity remained mostly below 400 km/s.
A second shock was observed in the solar wind parameters near 11:49 UTC on Nov 5th marking the arrival of the Nov 3rd partial halo CME related to a strong large filament eruption. The interplanetary magnetic field reached highly disturbed values of above 40 nT with a minimum Bz of -27 nT, a density of 62 ppcc and a moderate solar wind velocity mostly below 500 km/s.
Geomagnetism
The geomagnetic conditions over Belgium in the beginning of the week were predominantly unsettled to active. Globally minor storm levels were reached with 2 periods of NOAA Kp = 5. Mostly quiet to unsettled conditions were registered between late UTC afternoon on Oct 30th until UTC evening on Nov 4th when a minor storm was registered (K Belgium and NOAA Kp = 5). In the UT evening of Nov 5, we had a strong storm at the planetary level and a moderate storm over Belgium.
PROBA2 Observations (30 Oct 2023 - 5 Nov 2023)
Solar Activity
Solar flare activity fluctuated from low to moderate during the week.
In order to view the activity of this week in more detail, we suggest to go to the following website from which all the daily (normal and difference) movies can be accessed: https://proba2.oma.be/ssa
This page also lists the recorded flaring events.
A weekly overview movie can be found here (SWAP week 710). https://proba2.sidc.be/swap/data/mpg/movies/weekly_movies/weekly_movie_2023_10_30.mp4
Details about some of this week's events can be found further below.
If any of the linked movies are unavailable they can be found in the P2SC movie repository here https://proba2.oma.be/swap/data/mpg/movies/
Friday Nov 03
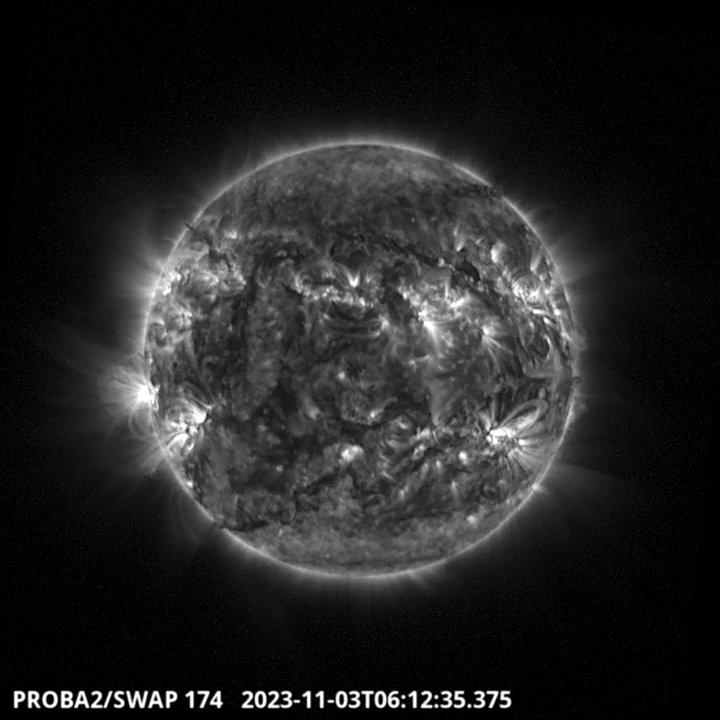
Filament eruption in the NorthWest side of the solar disk around 6:12UT. Find a SWAP movie of the event here. https://proba2.sidc.be/swap/movies/20231103_swap_movie.mp4
Sunday Nov 05
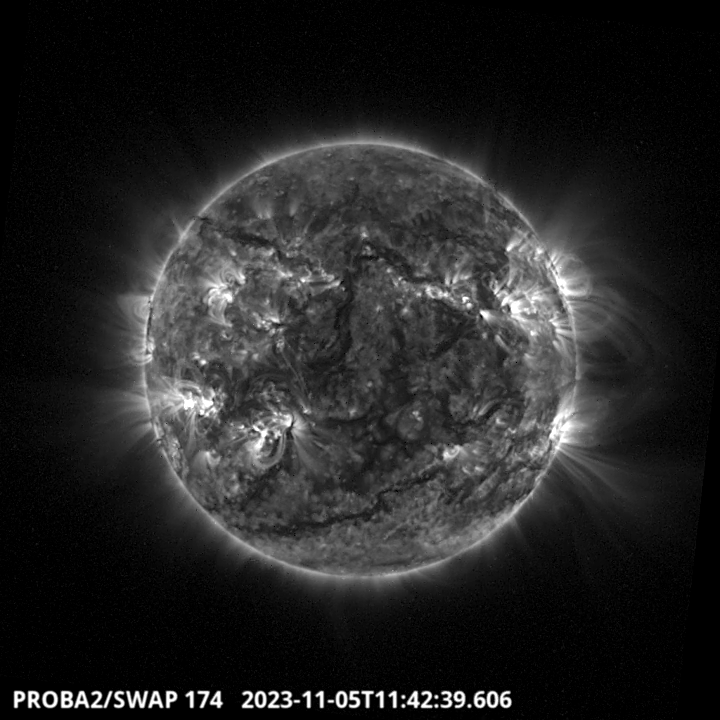
An eruption occurred on the South East part of the solar disk around 11:42 UT(SWAP image above). It corresponds to the largest flare of the week which has been produced by the NOAA active region 3480. Find a SWAP movie of the event here, https://proba2.sidc.be/swap/movies/20231105_swap_movie.mp4
The SIDC Space Weather Briefing
The Space Weather Briefing presented by the forecaster on duty from Oct 30 to Nov 5. It reflects in images and graphs what is written in the Solar and Geomagnetic Activity report: https://www.stce.be/briefings/20231106_SWbriefing.pdf
If you need to access the movies, contact us: stce_coordination at stce.be
Noticeable Solar Events
| DAY | BEGIN | MAX | END | LOC | XRAY | OP | 10CM | TYPE | Cat | NOAA |
| 01 | 0607 | 0626 | 0649 | M1.1 | ||||||
| 01 | 1137 | 1226 | 1300 | M1.4 | ||||||
| 02 | 1218 | 1222 | 1226 | S19W31 | M1.6 | SB | III/2 | 29 | 3474 | |
| 02 | 1908 | 1921 | 1928 | M1.0 | III/1 | 3480 | ||||
| 05 | 1134 | 1143 | 1147 | S9E53 | M1.8 | 1N | 3480 | |||
| 05 | 1424 | 1432 | 1436 | M1.6 | 140 | 3480 |
| LOC: approximate heliographic location | TYPE: radio burst type |
| XRAY: X-ray flare class | Cat: Catania sunspot group number |
| OP: optical flare class | NOAA: NOAA active region number |
| 10CM: peak 10 cm radio flux |
International Sunspot Number by SILSO
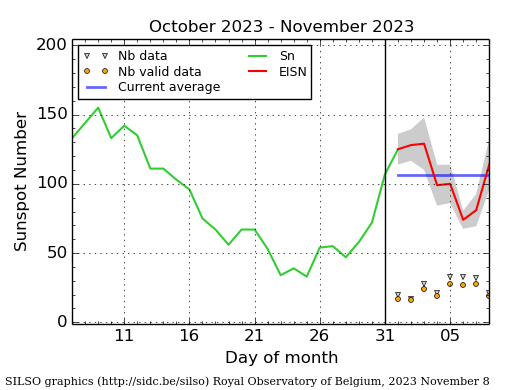
The daily Estimated International Sunspot Number (EISN, red curve with shaded error) derived by a simplified method from real-time data from the worldwide SILSO network. It extends the official Sunspot Number from the full processing of the preceding month (green line), a few days more than one solar rotation. The horizontal blue line shows the current monthly average. The yellow dots give the number of stations that provided valid data. Valid data are used to calculate the EISN. The triangle gives the number of stations providing data. When a triangle and a yellow dot coincide, it means that all the data is used to calculate the EISN of that day.
Geomagnetic Observations in Belgium
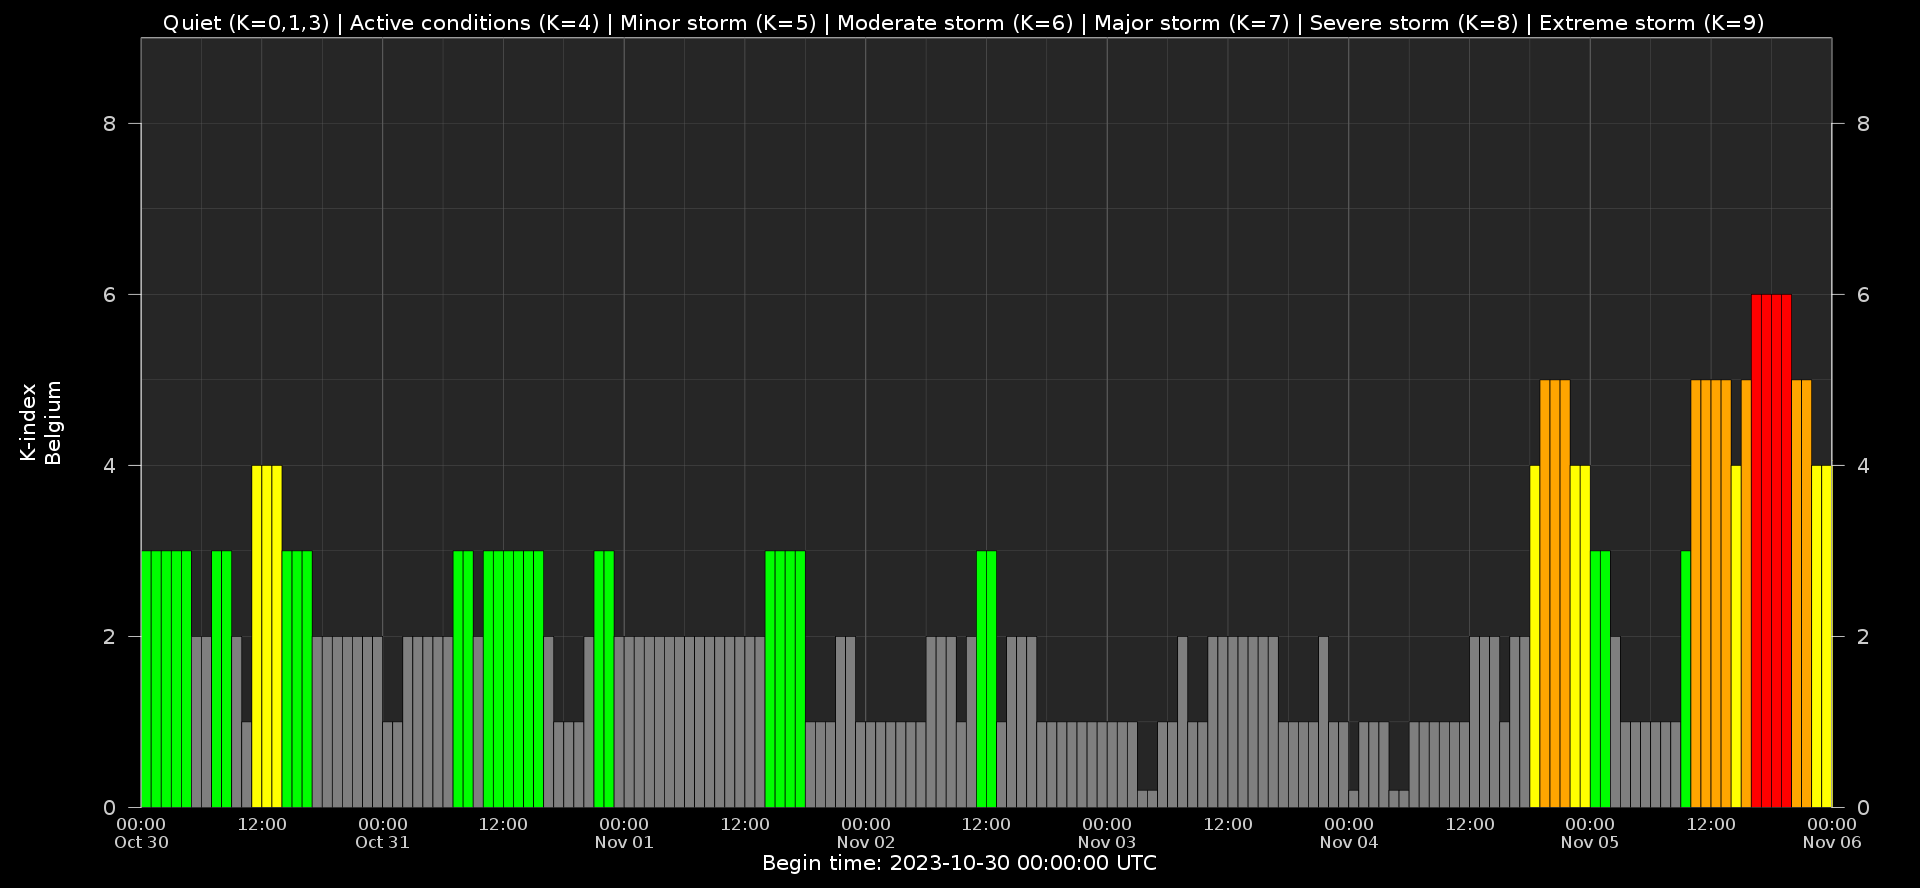
Local K-type magnetic activity index for Belgium based on data from Dourbes (DOU) and Manhay (MAB). Comparing the data from both measurement stations allows to reliably remove outliers from the magnetic data. At the same time the operational service availability is improved: whenever data from one observatory is not available, the single-station index obtained from the other can be used as a fallback system.
Both the two-station index and the single station indices are available here: http://ionosphere.meteo.be/geomagnetism/K_BEL/
Review of Ionospheric Activity
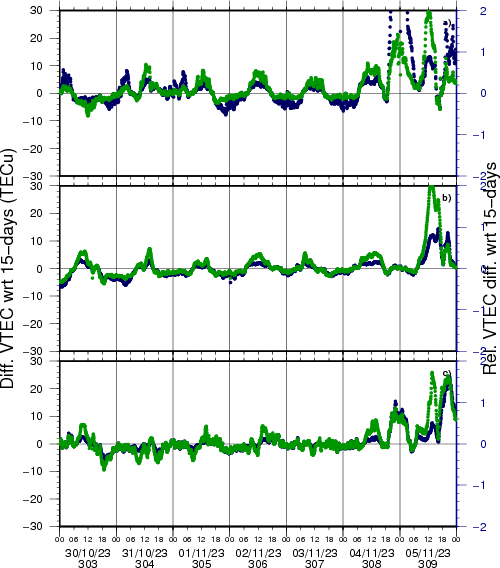
NEW! The time series below illustrates (in green) the VTEC deviation from normal quiet behaviour.
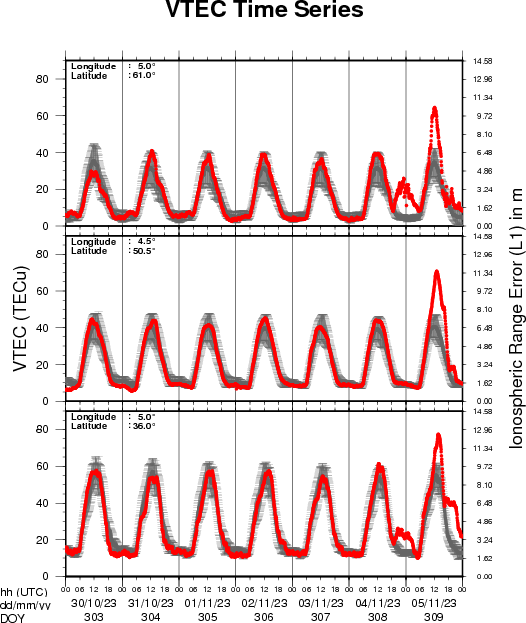
VTEC time series at 3 locations in Europe from 30 Oct 2023 till 5 Nov 2023
The top figure shows the time evolution of the Vertical Total Electron Content (VTEC) (in red) during the last week at three locations:
a) in the northern part of Europe(N 61deg E 5deg)
b) above Brussels(N 50.5deg, E 4.5 deg)
c) in the southern part of Europe(N 36 deg, E 5deg)
This top figure also shows (in grey) the normal ionospheric behaviour expected based on the median VTEC from the 15 previous days.
The time series below shows the VTEC difference (in green) and relative difference (in blue) with respect to the median of the last 15 days in the North, Mid (above Brussels) and South of Europe. It thus illustrates the VTEC deviation from normal quiet behaviour.
The VTEC is expressed in TECu (with TECu=10^16 electrons per square meter) and is directly related to the signal propagation delay due to the ionosphere (in figure: delay on GPS L1 frequency).
The Sun's radiation ionizes the Earth's upper atmosphere, the ionosphere, located from about 60km to 1000km above the Earth's surface.The ionization process in the ionosphere produces ions and free electrons. These electrons perturb the propagation of the GNSS (Global Navigation Satellite System) signals by inducing a so-called ionospheric delay.
See http://stce.be/newsletter/GNSS_final.pdf for some more explanations ; for detailed information, see http://gnss.be/ionosphere_tutorial.php
Calendar
Activities and encounters with the Sun-Space-Earth system and Space Weather as the main theme. We provide occasions to get submerged in our world through educational, informative and instructive activities.
If you want your event in our calendar, contact us: stce_coordination at stce.be
* Nov 18-19, E-SWAN Space Weather School: data, models and services, by the STCE, Toulouse, France
* Nov 24, Webinar: Meet EPOS-BE, ROB, online
* Nov 26, STCE @ Dag van de Wetenschap, Planetarium, Brussels
* Dec 4-6, STCE course: Space Weather impacts on ionospheric wave propagation - focus on GNSS and HF, Brussels, Belgium - Registrations are open
* Jan 22-24, 2024, STCE Space Weather Introductory Course, Brussels, Belgium - Registrations are open
* Jan 25, 2024, post-Space Weather Introductory Course, by JMG and MeteoWing, place TBD - registration is included in the Jan SWIC
Check: https://www.stce.be/