- Table of Content
- 1.The Sun is goi...
- 2.Review of spac...
- 3.Noticeable Sol...
- 4.Geomagnetic Ob...
- 5.EUI at the mov...
- 6.PROBA2 Observa...
- 7.The SIDC space...
- 8.International ...
- 9.Review of Iono...
- 10.Activities at ...
2. Review of space weather
3. Noticeable Solar Events
4. Geomagnetic Observations in Belgium
5. EUI at the movies
6. PROBA2 Observations (27 Nov 2023 - 3 Dec 2023)
7. The SIDC space Weather Briefing
8. International Sunspot Number by SILSO
9. Review of Ionospheric Activity
10. Activities at the STCE
The Sun is going crazy!
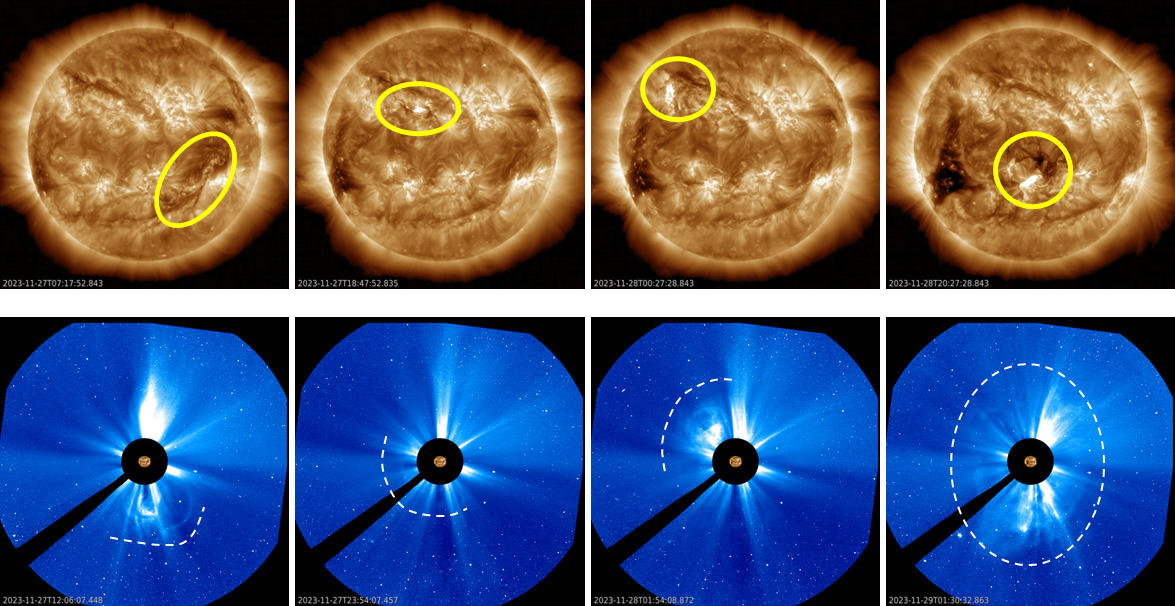
As the solar cycle is heading to its maximum, it's no surprize that the solar activity remains enhanced. Sunspot numbers exceeded 150 during several days late November. However, most of the eruptive activity was due to filament eruptions, such as for example on 27 and 28 November. Solar filaments are clouds of charged particles ("plasma") above the solar surface squeezed between magnetic regions of opposite polarity. Being cooler and denser than the plasma underneath and their surroundings, they appear as dark lines when seen on the solar disk. Special filters are required to observe these features, such as in the Hydrogen-alpha (H-alpha) line in the red part of the solar spectrum at a wavelength of 656.3 nm. The figure underneath shows extreme ultraviolet (EUV) images from SDO (AIA 193 - top row - http://sdo.gsfc.nasa.gov/data/aiahmi/ ) with the eruption sources annotated and coronagraphic images from SOHO (LASCO C3 - bottom row - https://soho.nascom.nasa.gov/data/realtime-images.html ) showing the associated coronal mass ejections (CMEs) outlined by dashed white lines. The eruptions took place around 05:30UTC, 18:30UTC, and 23:30UTC on 27 November, and around 20:00UTC on 28 November. The first 3 eruptions where associated with filament eruptions, the 4th eruption had NOAA 3500 as its source. Clips are available in the online version of this article at https://www.sidc.be/article/sun-going-crazy
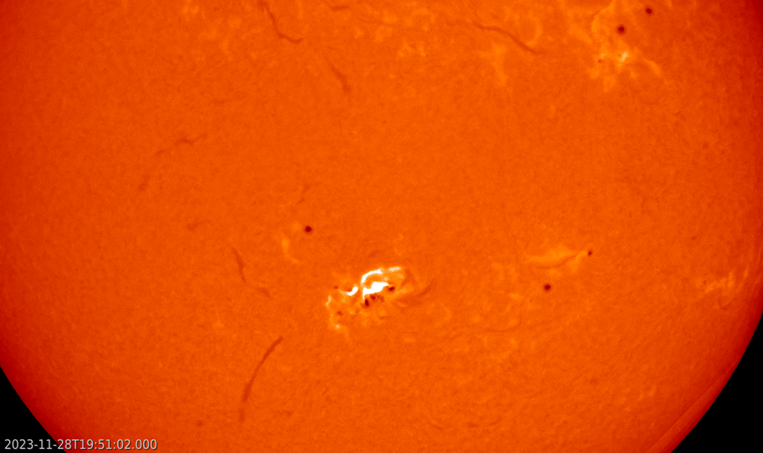
The 28 November eruption was also associated with the strongest solar flare of the period, an M9.8 flare peaking at 19:50UTC. This flare strongly affected the 10.7cm radio flux, increasing it to over 250 solar flux units (sfu), well above the background radio flux which was around 180 sfu at that time. The H-alpha imagery underneath is from the GONG network and shows a clear double (parallel) ribbon. The dark spots are the main sunspots, and the grayish lines are other filaments. The clip is a bit jittery as it combines observations from several stations of the network.
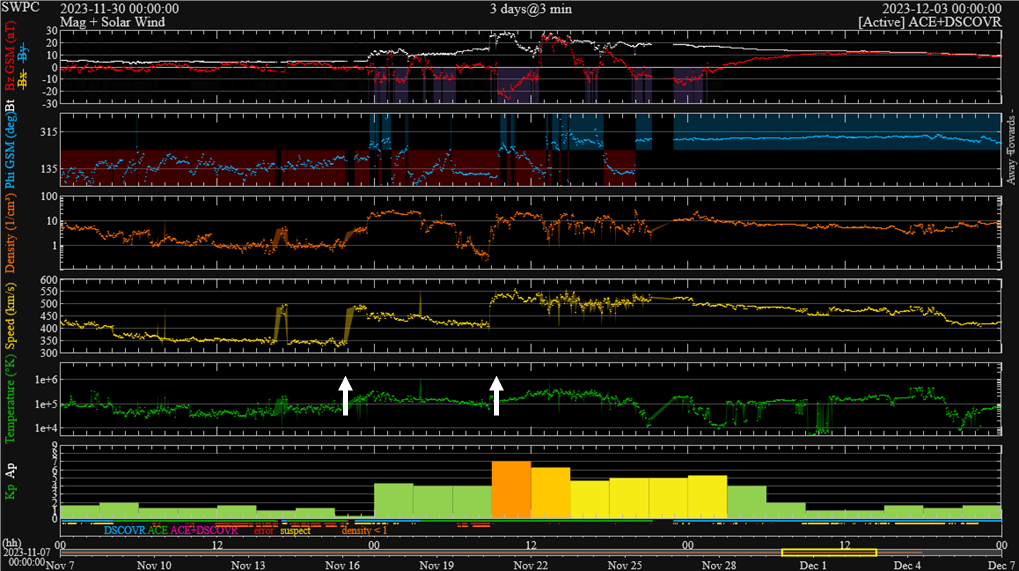
The associated CMEs had plane-of-the-sky speeds of resp. 400, 300, 700 and 450 km/s (CACTus - https://www.sidc.be/cactus/ ). Correcting for the width and line-of-sight of each CME, and because of the quick succession of the eruptions, it was thought there was a good chance on a cannibal CME, meaning one CME catching up with the previous one thus creating enhanced magnetic fields that that might create extra disturbances in the geomagnetic field when it would pass the earth environment. The solar wind parameters (graph underneath - DSCOVR - https://www.swpc.noaa.gov/products/real-time-solar-wind ), indicate only 2 obvious increases in the CME speed (yellow curve; indicated by white arrows): one late on 30 November, when the wind speed increased from 350 km/s to 490 km/s, and a second abrupt increase on 1 December around 08:45UTC when the wind speed jumped from 410 to 530 km/s. The latter interplanetary CME was the strongest, with Bz - the north-south component of the interplanetary magnetic field - reaching -26 nT. This was likely the passage of the 28 November CME, with other solar wind parameters suggesting it had probably gobbled up one or 2 previous CMEs. Despite the very negative Bz, it did not last long, resulting in "only" a major geomagnetic storm (Kp = 7). Aurora were observed (photographed) as far south as California and Slovenia.
Review of space weather
Solar Active Regions (ARs) and flares
Solar flaring activity reached high levels in the past week. NOAA Active Region (AR) 3500 (magnetic configuration Beta-Gamma, Catania sunspot group 65) emitted an M3.4 and an M9.8 flare on Nov 28, 19:35 and 19:50 UTC respectively and an M1 flare at Dec 1 21:20 UTC. NOAA AR 3502 (magnetic configuration Beta, Catania sunspot group 64) produced an M1 flare at Dec 1 at 04:19 UTC. Further, numerous C-class flares were registered.
Coronal mass ejections
A full halo and four partial halo, Earth-directed, Coronal Mass Ejections (CME) were detected during the past week. The first three partial halo CMEs were launched the same day, 27 Nov, around 06 UTC, 18 UTC and 23 UTC. The full halo CME was seen in corona graphic images the next day, 28 Nov, around 20 UTC. The fourth partial halo CME was seen in LASCO/C2 images on 1 Dec around 22 UTC.
Coronal Holes
A large negative polarity coronal hole started crossing the central solar meridian on 1 Dec.
Proton flux levels
The greater than 10 MeV proton flux was at nominal levels throughout the week.
Electron fluxes at GEO
The greater than 2 MeV electron flux measured by the GOES-16 satellite, was below the 1000 pfu alert threshold during the past week. The 24h electron fluence was also at low levels.
Solar wind at L1
The Solar Wind (SW) was slow until two Coronal Mass Ejections (CME) passed L1 on 30 Nov around 23:30 UTC and on 1 Dec around 10 UTC. The latter was possibly the full halo CME that had cannibalised one or two earlier CME's.
The SW speed was below 500 km/s on 27, 28, 29 and 30 Nov. With the arrival of first CME late 30 Nov, the speed jumped above 500 km/s. The total interplanetary magnetic field (Bt) increased to 12 nT, early on 1 Dec. The arrival of the cannibal CME on 1 Dec, 10 UTC made the Bt jump to 29 nT. The North-South magnetic component (Bz) varied between -20 and 20 nT. Its lowest value was -27 nT on 1 Dec. The passage of the CME's was visible in the SW parameters until late Dec 2.
Geomagnetism
Geomagnetic conditions were globally quiet (NOAA Kp 0+ to 2+) and locally quiet to unsettled (K BEL 1-3) until the arrival of the CMEs.
The first 9 hours of 1 Dec, the geomagnetic conditions were active. From 9 UTC, we experienced a major storm (NOAA Kp 7), between 12 UTC - 15 UTC a moderate storm (NOAA Kp 6). Minor storm conditions (NOAA Kp 5- to 5+) remained until 2 Dec 03 UTC.
The local geomagnetic conditions increased were unsettled to active for the first part of 1 Dec. From 11 UTC to 13 UTC, Belgium was experiencing a moderate storm (K BEL 6). The storm decreased to reach again quiet to unsettled (K BEL 1 to 3) from Dec 2 04 UTC onwards.
Noticeable Solar Events
| DAY | BEGIN | MAX | END | LOC | XRAY | OP | 10CM | TYPE | Cat | NOAA |
| 28 | 1907 | 1932 | 1935 | M3.4 | 720 | II/2III/2 | 65 | 3500 | ||
| 28 | 1935 | 1950 | 2009 | M9.8 | II/1 | 65 | 3500 | |||
| 01 | 0412 | 0439 | 0507 | M1.1 | 64 | 3502 | ||||
| 01 | 2055 | 2120 | 2210 | M1.0 | VI/2 | 65 | 3500 |
| LOC: approximate heliographic location | TYPE: radio burst type |
| XRAY: X-ray flare class | Cat: Catania sunspot group number |
| OP: optical flare class | NOAA: NOAA active region number |
| 10CM: peak 10 cm radio flux |
Geomagnetic Observations in Belgium

Local K-type magnetic activity index for Belgium based on data from Dourbes (DOU) and Manhay (MAB). Comparing the data from both measurement stations allows to reliably remove outliers from the magnetic data. At the same time the operational service availability is improved: whenever data from one observatory is not available, the single-station index obtained from the other can be used as a fallback system.
Both the two-station index and the single station indices are available here: http://ionosphere.meteo.be/geomagnetism/K_BEL/
EUI at the movies
EUI is an EUV imager onboard of the spacecraft Solar Orbiter. Its Full Sun Imager (FSI) could capture the M9.8 flare and the ejection of solar plasma into space of November 28 2023.
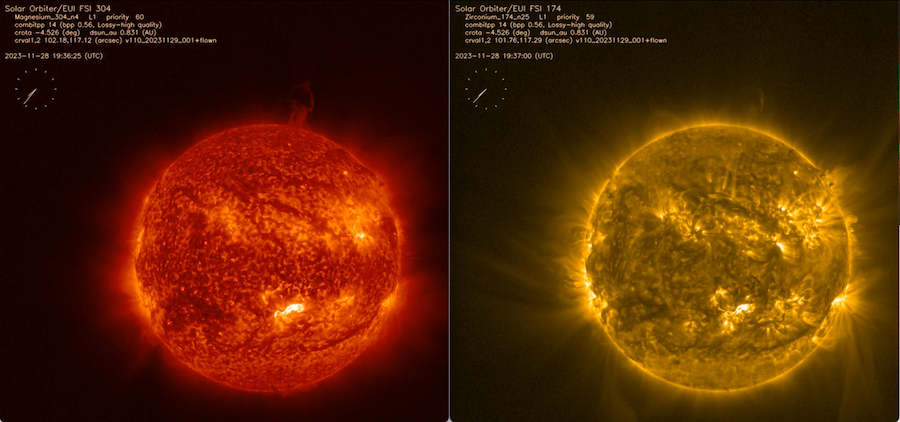
17.4 nm movie: https://www.sidc.be/EUI/data/movie/dailySynoptics/20231128_FSI174_L1.mp4
30.4 nm movie: https://www.sidc.be/EUI/data/movie/dailySynoptics/20231128_FSI304_L1.mp4
PROBA2 Observations (27 Nov 2023 - 3 Dec 2023)
Solar Activity
Solar flare activity fluctuated from low to high during the week.
In order to view the activity of this week in more detail, we suggest to go to the following website from which all the daily (normal and difference) movies can be accessed: https://proba2.oma.be/ssa
This page also lists the recorded flaring events.
A weekly overview movie can be found here (SWAP week 514). https://proba2.sidc.be/swap/data/mpg/movies/weekly_movies/weekly_movie_2023_11_27.mp4
Details about some of this week's events can be found further below.
If any of the linked movies are unavailable they can be found in the P2SC movie repository here https://proba2.sidc.be/swap/data/mpg/movies/
Tuesday 28 Nov
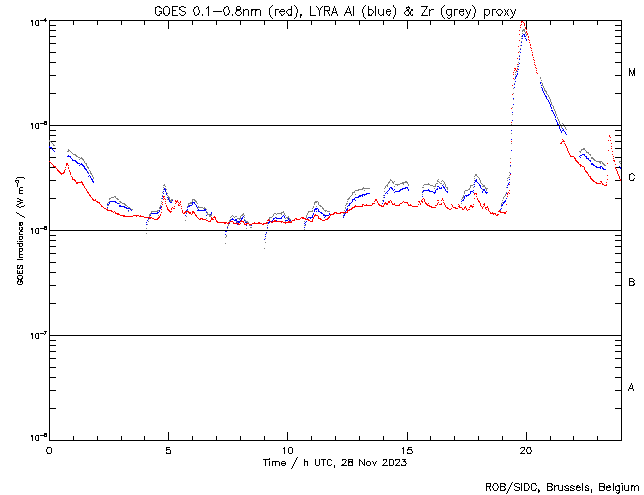
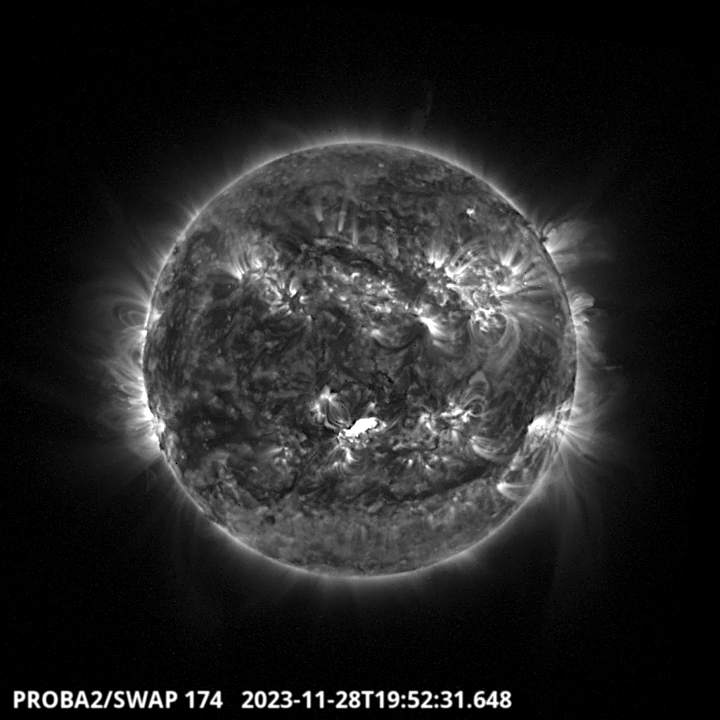
The largest flare of this week, a M9.8, occurred around 19:52 UT (LYRA and SWAP image above). The
flare has been produced by the active region NOAA 3500 located in the South of the solar disk.
along the central meridian. It was associated with a CME that hit Earth and caused a geomagnetic
storm. Find a SWAP movie of the event here. https://proba2.sidc.be/swap/movies/20231128_swap_movie.mp4
The SIDC space Weather Briefing
The Space Weather Briefing presented by the forecaster on duty from Nov 26 to Dec 3. It reflects in images and graphs what is written in the space weather report: https://www.stce.be/briefings/20231204_SWbriefing.pdf
If you need to access the movies, contact us: stce_coordination at stce.be
International Sunspot Number by SILSO

The daily Estimated International Sunspot Number (EISN, red curve with shaded error) derived by a simplified method from real-time data from the worldwide SILSO network. It extends the official Sunspot Number from the full processing of the preceding month (green line), a few days more than one solar rotation. The horizontal blue line shows the current monthly average. The yellow dots give the number of stations that provided valid data. Valid data are used to calculate the EISN. The triangle gives the number of stations providing data. When a triangle and a yellow dot coincide, it means that all the data is used to calculate the EISN of that day.
Review of Ionospheric Activity
NEW! The time series below illustrates (in green) the VTEC deviation from normal quiet behaviour.


VTEC time series at 3 locations in Europe from 27 Nov 2023 till 3 Dec 2023
The top figure shows the time evolution of the Vertical Total Electron Content (VTEC) (in red) during the last week at three locations:
a) in the northern part of Europe(N 61deg E 5deg)
b) above Brussels(N 50.5deg, E 4.5 deg)
c) in the southern part of Europe(N 36 deg, E 5deg)
This top figure also shows (in grey) the normal ionospheric behaviour expected based on the median VTEC from the 15 previous days.
The time series below shows the VTEC difference (in green) and relative difference (in blue) with respect to the median of the last 15 days in the North, Mid (above Brussels) and South of Europe. It thus illustrates the VTEC deviation from normal quiet behaviour.
The VTEC is expressed in TECu (with TECu=10^16 electrons per square meter) and is directly related to the signal propagation delay due to the ionosphere (in figure: delay on GPS L1 frequency).
The Sun's radiation ionizes the Earth's upper atmosphere, the ionosphere, located from about 60km to 1000km above the Earth's surface.The ionization process in the ionosphere produces ions and free electrons. These electrons perturb the propagation of the GNSS (Global Navigation Satellite System) signals by inducing a so-called ionospheric delay.
See http://stce.be/newsletter/GNSS_final.pdf for some more explanations ; for detailed information, see http://gnss.be/ionosphere_tutorial.php
Activities at the STCE
Check out our activity calendar: activities and encounters with the Sun-Space-Earth system and Space Weather as the main theme. We provide occasions to get submerged in our world through educational, informative and instructive activities.
If you want your event in our calendar, contact us: stce_coordination at stce.be
* Dec 14, 2023, STCE seminar, On the Connection between Solar Surface Magnetic Flux and the Total Solar Irradiance,
* Jan 22-24, 2024, STCE Space Weather Introductory Course, Brussels, Belgium - Registrations are open
* Jan 25, 2024, post-Space Weather Introductory Course, by JMG and MeteoWing, place TBD - registration is included in the Jan SWIC
* Mar 4-5, 2024, STCE Space Weather Introductory Course, focus on aviation, online - Registrations are open
* Apr 22-24, 2024, STCE Space Weather Introductory Course, Brussels, Belgium - Registrations are open
More info needed? Contact us: stce_coordination at stce.be
Check: https://www.stce.be/calendar