- Table of Content
- 1.Aurora lookali...
- 2.Call to work a...
- 3.Review of spac...
- 4.PROBA2 Observa...
- 5.International ...
- 6.Noticeable Sol...
- 7.Geomagnetic Ob...
- 8.The SIDC space...
- 9.Review of Iono...
- 10.STCE activitie...
2. Call to work at a PITHIA-NRF research facility
3. Review of space weather
4. PROBA2 Observations (8 Jan 2024 - 14 Jan 2024)
5. International Sunspot Number by SILSO
6. Noticeable Solar Events
7. Geomagnetic Observations in Belgium
8. The SIDC space weather briefing
9. Review of Ionospheric Activity
10. STCE activities
Aurora lookalikes
When people think of colourful phenomena in the night sky, the polar lights are the first that come to mind. They are the result from interaction between the solar wind and the Earth's magnetic field. Particles get accelerated from the Earth's magnetotail to the Earth and collide with particles in the Earth's upper atmosphere, which results usually in green and red colours corresponding with altitudes of respectively 100-200 and 200-400 km. Aurora are quite dynamic and often compared to waving curtains. They occur in an oval a few 100 km wide and centered 10 to 20 degrees around the magnetic pole. During strong storms, the oval may expand and move more to the equator. Then, polar lights may become visible from mid- and low-latitudes, with red colours first as they are the highest and thus can be seen the furthest away.
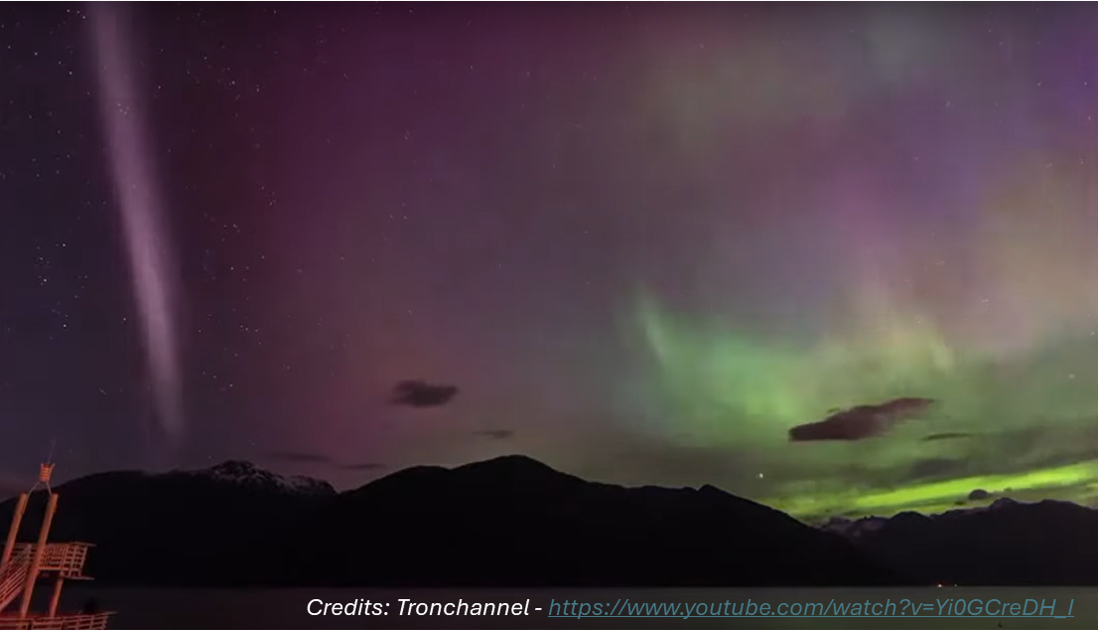
But not all coloured phenomena in the night sky are polar lights. STEVE, short for "Strong Thermal Emission Velocity Enhancement", is an optical phenomenon in the Earth's upper atmosphere that usually appears as a narrow purple light ribbon, sometimes accompanied by smudges of green lines called "picket fences" owing to their appearance. Known already for many decades, it was named in late 2016 by aurora watchers (citizen scientists) from Alberta, Canada. According to analysis of satellite data from the European Space Agency's Swarm mission (ESA - https://www.esa.int/Applications/Observing_the_Earth/FutureEO/Swarm/Steve_over_the_picket_fence ), the phenomenon is caused by a long, 20-30 km wide ribbon of fast flowing, hot plasma (charged particles) at an altitude of 130-270 km, with a temperature of 3000 degrees (Archer et al. 2019 - https://agupubs.onlinelibrary.wiley.com/doi/full/10.1029/2019GL084473 ). Studies have shown that it is not related to particle precipitation, and is most likely ionospheric in origin (Gallardo-Lacourt 2018 - https://agupubs.onlinelibrary.wiley.com/doi/10.1029/2018GL078509 ). This makes its formation mechanism quite different from that of aurora. STEVE phenomena may be spotted further from the poles than the aurora, and show a preference to occur around the times of equinoxes (Patel, 2023 - https://www.washingtonpost.com/climate-environment/2023/04/01/steve-aurora-northern-lights-space-find/ ). The image underneath show STEVE's general outlook (on the left) and position with respect to the typical aurora (to the right).
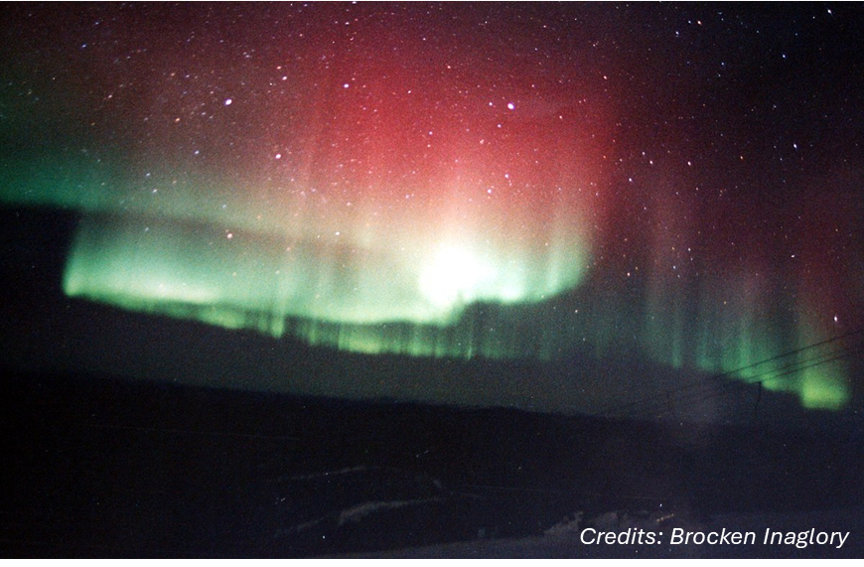
Another aurora lookalike are the Stable Auroral Red arcs (SARs) which were observed for the first time in the 1950s. Not knowing what they were, they were initially thought to be linked to aurora and named after them, but that was premature. SARs are pure red arcs of light that ripple across the sky during strong geomagnetic storms. They are a sign of heat energy leaking into the upper atmosphere from Earth's ring current system (SWIC space weather course - https://events.spacepole.be/event/124/contributions/1084/attachments/591/1082/SWIC09_Magnetosphere_Notes.pdf ). SAR arcs occur during geomagnetic storms when the inner edge of the ring current interacts with a contracted plasmasphere. A portion of ring current energy is dissipated as heat that gets conducted along geomagnetic field lines into the topside ionosphere. If ambient ionospheric electrons at about 400 km get heated to temperatures near 3000 degrees, collisions with thermospheric oxygen atoms can transfer the necessary energy to make them emit the familiar red colour (Mendillo et al. 2015 - https://agupubs.onlinelibrary.wiley.com/doi/full/10.1002/2015JA021722 ). SARs can also be observed at low latitudes, such as e.g. in November 2021 when a SAR was photographed as far south as Texas, USA (Spaceweatherarchive at https://spaceweatherarchive.com/2021/11/22/3308/ ). If you perceive some similarities with STEVE, then you may be just right. A recent paper used images made by citizen scientists during the St-Patrick Day's geomagnetic storm (17 March 2015) to show for the first time the evolution of a SAR arc into a STEVE ribbon (Martinis et al. 2022 - https://agupubs.onlinelibrary.wiley.com/doi/10.1029/2022GL098511 ; EOS - https://eos.org/research-spotlights/from-sar-arc-to-steve-an-atmospheric-evolution ). A portion of this event is shown underneath, with the SAR arc (on the left) transforming into a STEVE ribbon (on the right) in just half an hour. The typical aurora are in the bottom half of each image.

There are other ways in which the Earth's atmosphere may light up. In fact, our atmosphere glows constantly during both day and night as sunlight interacts with atoms and molecules within the atmosphere, a phenomenon commonly called "airglow". Most of the airglow emanates from the region about 50 to 300 km above the surface of Earth, with the brightest area concentrated at altitudes around 100 km. Unlike the aurora, airglow does not exhibit structures such as arcs and is emitted from the entire sky at all latitudes at all times. Nightglow results from the recombination of molecules that have been broken apart by solar radiation during the day. The light is emitted when the excited atoms or molecules return to their original unexcited state during the night. One of the brightest emissions on Earth stems from night glow, more particularly from excited oxygen atoms radiating light at a particular wavelength of light (557.7 nm), a green radiation emitted in the spectral region where our eyes are most sensitive. The green layer of nightglow is quite faint to the naked eye, so that it can only be seen at night by looking "edge on" at the emission layer, such as astronauts can view it in orbit (BIRA-IASB - https://www.aeronomie.be/index.php/en/encyclopedia/airglow-day-and-night-mechanisms-explained ; Britannica - https://www.britannica.com/science/airglow ). Studies have confirmed a link with the solar cycle, with airglow up to 40% brighter when the Sun is most active. An amazingly bright airglow was observed over Colorado (USA) on 22 June 2023 (image underneath ; Spaceweatherarchive - https://spaceweatherarchive.com/2023/06/28/solar-max-is-boosting-airglow/ ).

Nacreous clouds, also called polar stratospheric clouds or mother-of-pearl clouds, are clouds in the stratosphere at altitudes of 15 to 25 km. They are best observed during civil twilight, when the Sun is just a few degrees below the horizon, as well as in winter and in more northerly latitudes. Ice polar stratospheric clouds (nacreous clouds) form at temperatures below the ice frost point, typically near -85 degrees Celsius, which is colder than the average lower stratosphere temperature. The characteristic bright iridescent colours, resulting from diffraction and interference of light waves, suggest that the clouds are composed of similarly sized spherical crystals of about 10 μm in diameter. They are most common in Antarctica, but have also been observed in the Arctic, Scotland, Scandinavia, Alaska, Canada and the northern Russian Federation (Cloudatlas - https://cloudatlas.wmo.int/en/nacreous-clouds.html ).

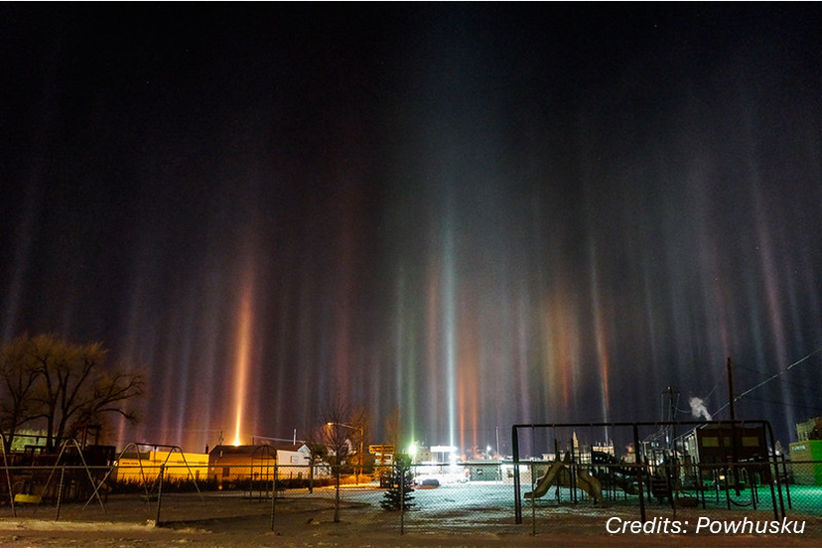
A light pillar is an atmospheric optical phenomenon in which a vertical beam of light appears to extend above and/or below a light source. The effect is created by the reflection of light from tiny ice crystals that are suspended in the atmosphere or that comprise high-altitude clouds (e.g. cirrostratus or cirrus clouds ; 2-6 km). Unlike a light beam, a light pillar is not physically located above or below the light source. Its appearance as a vertical line is an optical illusion, resulting from the collective reflection off the ice crystals. Since they are caused by the interaction of light with ice crystals, light pillars belong to the family of halos. The crystals responsible for light pillars usually consist of flat, hexagonal plates, which tend to orient themselves more or less horizontally as they fall through the air. Each flake acts as a tiny mirror which reflects light sources that are appropriately positioned below it, and the presence of flakes at a spread of altitudes causes the reflection to be elongated vertically into a column. The larger and more numerous the crystals, the more pronounced this effect becomes (Wikipedia - https://en.wikipedia.org/wiki/Light_pillar). The image below shows a series of light pillars over Laramie, Wyoming (USA) on 20 April 2013 (Powhusku, https://www.flickr.com/photos/hubbardcoe/ ), creating the impression of curtain-like aurora. More images are at Atmospheric Optics - https://atoptics.co.uk/blog/light-pillars/ (old: https://old.atoptics.co.uk/halo/lpil.htm ) and e.g. APOD - https://apod.nasa.gov/apod/ap131218.html
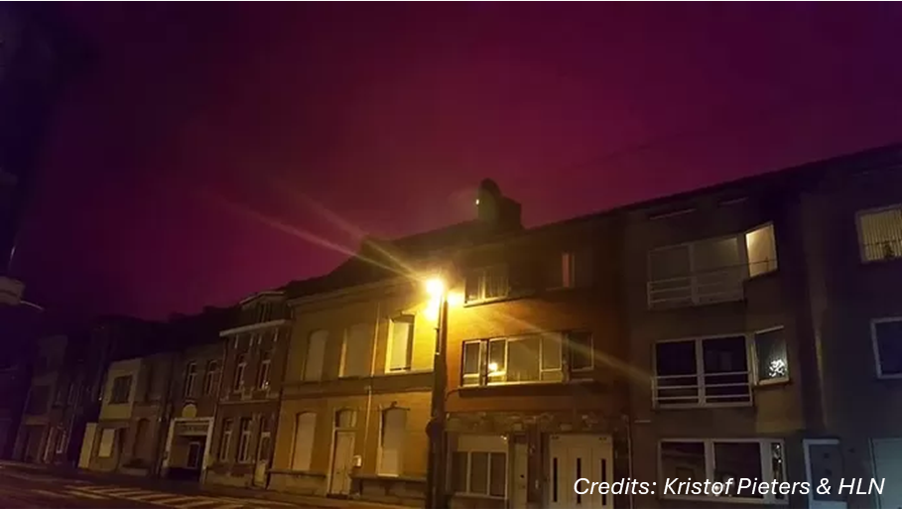
And then there are... tomatoes!? The second strongest geomagnetic storm so far this solar cycle took place on 5 November 2023. Despite being faint at mid- to low-latitudes, deep red aurora were observed and photographed from Belgium and locations as far south as Arizona and Texas in the USA, and Portugal and Italy in Europe (see the STCE newsitem at https://www.sidc.be/article/filament-eruptions-and-polar-lights ). Only, in Belgium, not all of the reported aurora were factual aurora. Indeed, the celestial spectacle unfolding over Tournai and Mouscron turned out to be the glow from a nearby tomato greenhouse. The luminous pink hue, a result of the blue-red spectrum of LED lights used for tomato cultivation ("light-therapy"), painted the night sky, leading to considerable confusion amongst observers. The tomato greenhouse company clarified that the pink sky was the result of an oversight in closing the greenhouse roof's shutter. The usual screens that prevent the light from leaking outside at night were not activated, causing the Tournai sky to glow. The company issued an apology for the oversight and clarified that the bright red or pink lights in the sky were unrelated to the aurora. By that time though, the mistake had already gone international (BNN Hong Kong - https://bnnbreaking.com/breaking-news/agriculture/pink-sky-in-belgium-tomato-greenhouse-lights-not-aurora-borealis/ ). This kind of confusion apparently happens quite often, with other reports e.g. early February 2022 (yes, the storms that crippled the Starlink satellites) in the Netherlands (Hortidaily - https://www.hortidaily.com/article/9396970/aurora-borealis-no-it-s-actually-a-greenhouse/ ), and also in December 2016 over the Waasland, Belgium (HLN - https://www.hln.be/zwijndrecht/lichttherapie-voor-tomaten-kleurt-hemel-roze~abcb6754/ ).
Call to work at a PITHIA-NRF research facility
PITHIA-NRF is a European research project on the plasmasphere, ionosphere and thermosphere. It is a network of facilities that provides observations, data processing tools and prediction models.
You are invited to come to work and run your own project or research at one of these facilities. This Trans-National Access (TNA) - program might be something for you. Check it out on: https://pithia-nrf.eu/pithia-nrf-users/tna/tna-calls/sixth-tna-call
Overview of the facilities
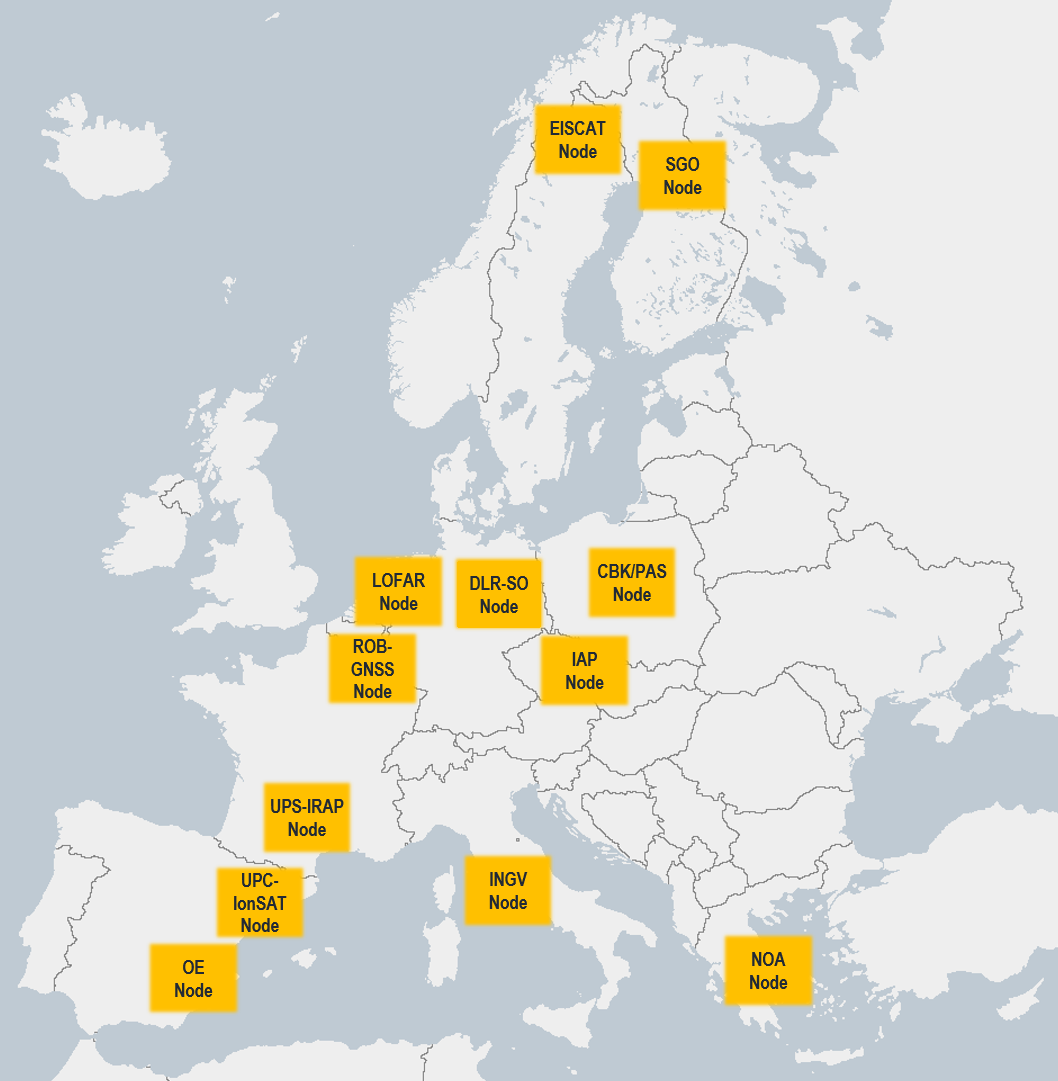
The call is open until May 31, 2024. Applications are handled as they arrive with an evaluation time of 2 to 3 weeks.
Don't hesitate to apply.
Review of space weather
Solar Active Regions (ARs) and flares
Solar flaring activity over the past week started low, increased to moderate levels on January 10-11, and then went back to low levels for the rest of the week. There were 18 active regions visible. 48 C-class flares and 6 M-class flares were recorded, the strongest being an M1.9-flare with peak time 23:28 UTC on January 10, from NOAA AR 3538. In the first part of the week, most of the flaring activity came from NOAA AR 3536, NOAA AR 3538, NOAA AR 3539 and NOAA AR 3540. In the second part of the week, most of the flaring activity came from NOAA AR 3538, NOAA AR 3539, NOAA AR 3540 and NOAA AR 3541. At the start of the week 8 active regions were on the visible disk, while at the end of the week the number had increased to 13 active regions due to active regions emerging and rotating on the disk
Coronal mass ejections
Five notable coronal mass ejections (CMEs) were observed over the course of the week. The first two CMEs (observed on January 08 at 13:25 UTC, and January 09 at 01:25 UTC in SOHO/LASCO C2 coronagraph images) erupted from the south-east quadrant of the visible disk (around E56S22). The last three CMEs (observed on January 09 at 15:12 UTC, January 11 around 06:00 UTC, and January 12 at 22:12 UTC) were partial halos associated with filament eruptions close to the solar limb. None of these CMEs had an Earth-directed component.
Coronal Holes
Two small high-latitude positive polarity coronal holes, one in the northern hemisphere and one in the southern hemisphere, passed the central meridian from January 07 to January 09. No high-speed stream from these coronal holes was observed at Earth during the week. Towards the end of the week, a small mid-latitude coronal hole in the northern hemisphere (with positive magnetic polarity) crossed the central meridian on January 12-13.
Proton flux levels
At the start of the week, the 10 MeV proton flux was slightly enhanced but below the 10 pfu threshold. It then gradually decreased towards background levels over the course of the week. A slight enhancement from background levels occurred on late January 14.
Electron fluxes at GEO
The greater than 2 MeV electron flux measured by GOES-16 was at background levels throughout the week. The 24h electron fluence was at nominal levels.
Solar wind
This week was characterised by a slow solar wind. The solar wind speed gradually increased from around 300 km/s to around 510 km/s over the course of the week, possibly due to the influence of a slightly faster solar wind stream associated with a large positive polarity coronal hole crossing the central meridian near the end of the previous week (January 04-06). The interplanetary magnetic field fluctuated between 1 nT and 10 nT, with a minimum Bz value of -8 nT on January 10. At the beginning of the week, the phi-angle was in the negative sector (directed towards the Sun), and it transitioned to the positive sector (away from the Sun) around 17:15 UTC on January 07. For the rest of the week, the phi-angle remained in the positive sector except for isolated periods on January 12
Geomagnetism
The geomagnetic conditions over the past week reached unsettled conditions both globally and locally (Kp 3 and K Bel 3), due to prolonged periods of negative Bz on January 08 and January 09. Locally, the geomagnetic conditions reached unsettled values also on January 11 and January 14. Geomagnetic conditions were quiet for the rest of the week
PROBA2 Observations (8 Jan 2024 - 14 Jan 2024)
Solar Activity
Solar flare activity fluctuated from low to moderate during the week.
In order to view the activity of this week in more detail, we suggest to go to the following website from which all the daily (normal and difference) movies can be accessed: https://proba2.oma.be/ssa
This page also lists the recorded flaring events.
A weekly overview movie (SWAP week 720) can be found here: https://proba2.sidc.be/swap/data/mpg/movies/weekly_movies/weekly_movie_2024_01_08.mp4.
Details about some of this week's events can be found further below.
If any of the linked movies are unavailable they can be found in the P2SC movie repository here: https://proba2.oma.be/swap/data/mpg/movies/.
Thursday January 11
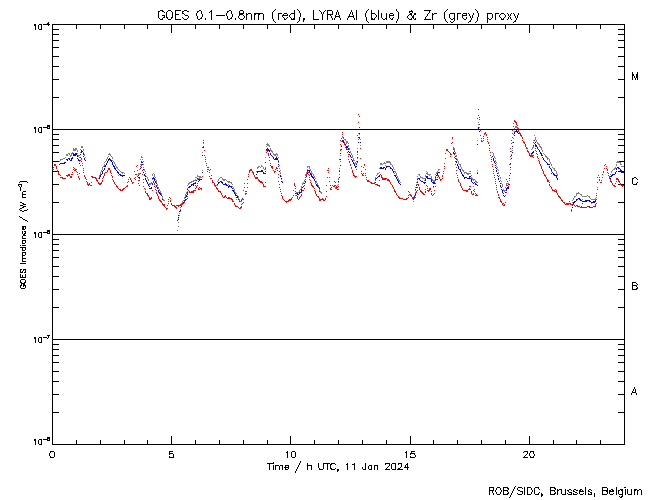
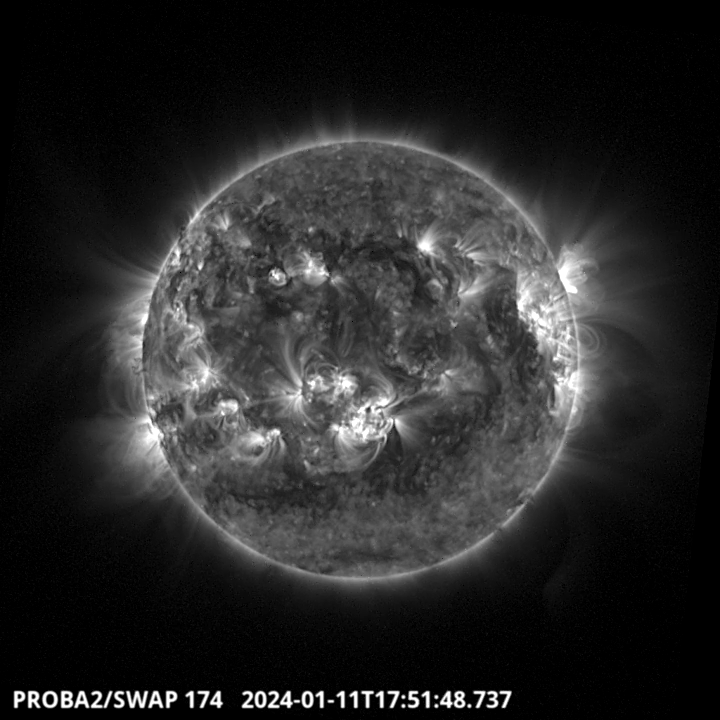
The second largest flare of this week, an M1.5 (the largest one, M1.9, occurred during a SWAP mosaic campaign), was observed by LYRA (top panel) and SWAP (bottom panel). The flare peaked on 2024-Jan-11 at 17:52 UT. It occurred on the western limb, and it originated from the active region NOAA AR3539.
Find a SWAP movie of the event here: https://proba2.sidc.be/swap/movies/20240111_swap_movie.mp4.
International Sunspot Number by SILSO

The daily Estimated International Sunspot Number (EISN, red curve with shaded error) derived by a simplified method from real-time data from the worldwide SILSO network. It extends the official Sunspot Number from the full processing of the preceding month (green line), a few days more than one solar rotation. The horizontal blue line shows the current monthly average. The yellow dots give the number of stations that provided valid data. Valid data are used to calculate the EISN. The triangle gives the number of stations providing data. When a triangle and a yellow dot coincide, it means that all the data is used to calculate the EISN of that day.
Noticeable Solar Events
| DAY | BEGIN | MAX | END | LOC | XRAY | OP | 10CM | TYPE | Cat | NOAA |
| 10 | 1239 | 1255 | 1305 | M1.4 | ||||||
| 10 | 2318 | 2328 | 2335 | N22W77 | M1.9 | SF | III/1 | 15 | 3538 | |
| 11 | 1244 | 1251 | 1255 | M1.3 | 15 | 3538 | ||||
| 11 | 1749 | 1752 | 1759 | M1.5 | 17 | 3539 | ||||
| 11 | 1908 | 1923 | 1949 | M1.2 | 15 | 3538 | ||||
| 12 | 0255 | 0258 | 0302 | N18E20 | M1.0 | SN | III/2 | 3547 |
| LOC: approximate heliographic location | TYPE: radio burst type |
| XRAY: X-ray flare class | Cat: Catania sunspot group number |
| OP: optical flare class | NOAA: NOAA active region number |
| 10CM: peak 10 cm radio flux |
Geomagnetic Observations in Belgium
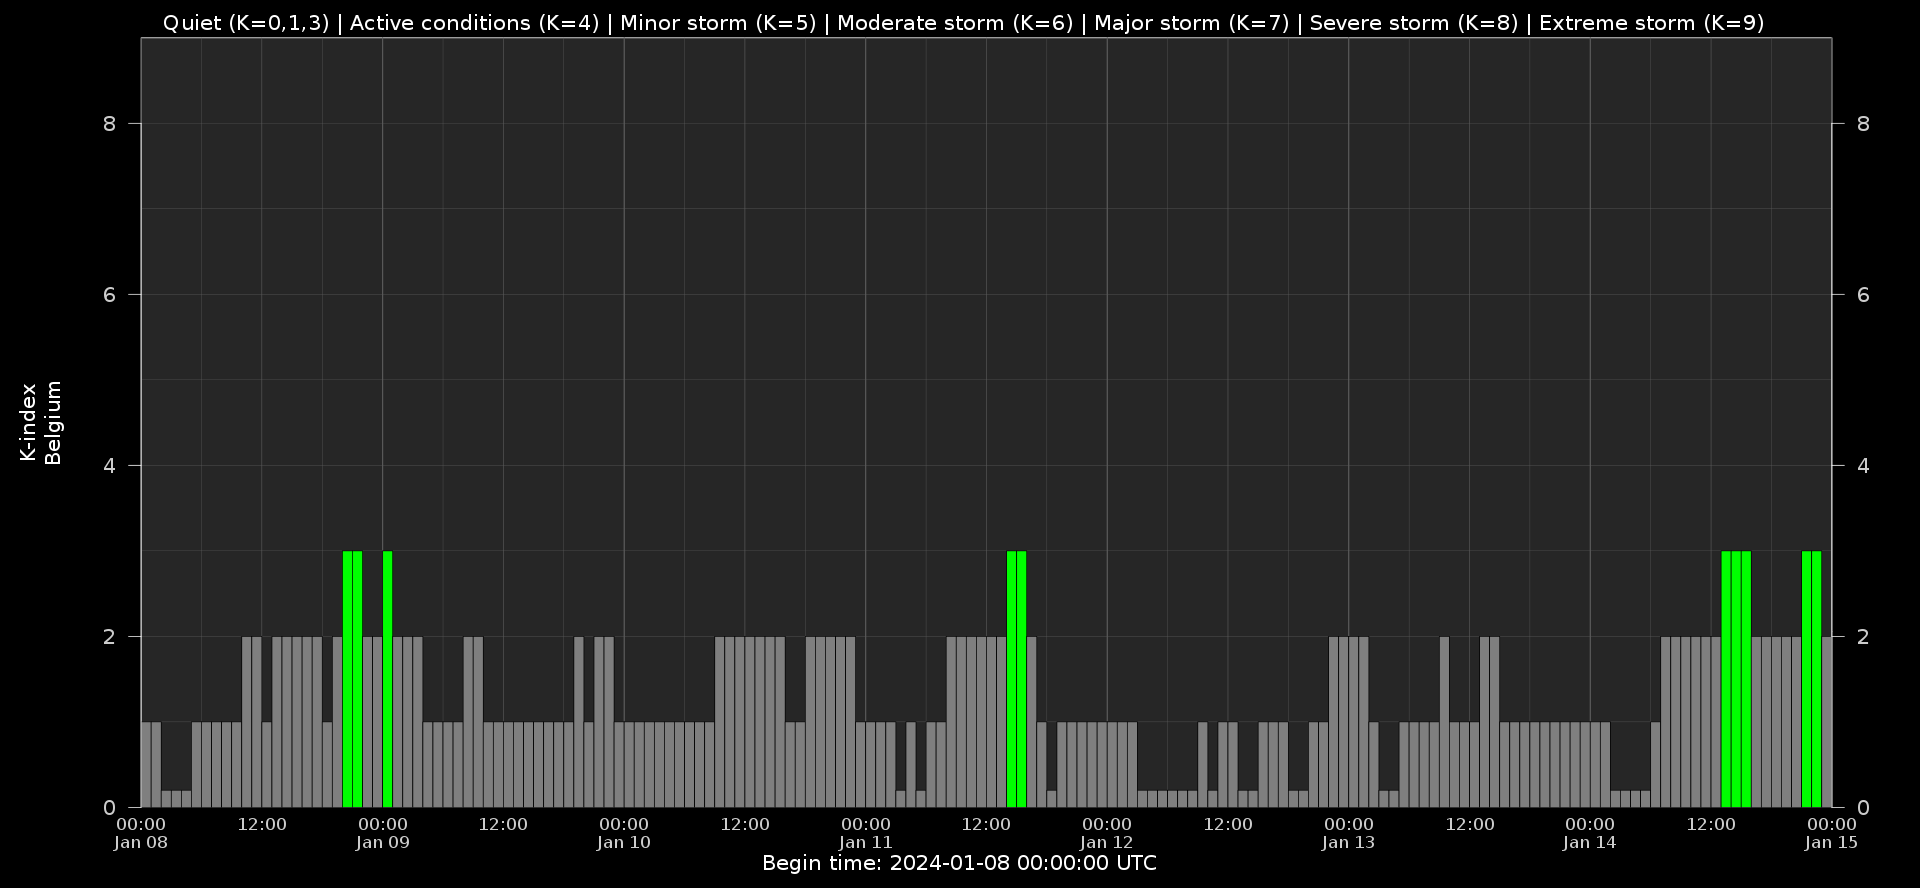
Local K-type magnetic activity index for Belgium based on data from Dourbes (DOU) and Manhay (MAB). Comparing the data from both measurement stations allows to reliably remove outliers from the magnetic data. At the same time the operational service availability is improved: whenever data from one observatory is not available, the single-station index obtained from the other can be used as a fallback system.
Both the two-station index and the single station indices are available here: http://ionosphere.meteo.be/geomagnetism/K_BEL/
The SIDC space weather briefing
The Space Weather Briefing presented by the forecaster on duty from Jan 7 to 14. It reflects in images and graphs what is written in the space weather report: https://www.stce.be/briefings/20240115_SWbriefing.pdf

If you need to access the movies, contact us: stce_coordination at stce.be
Review of Ionospheric Activity
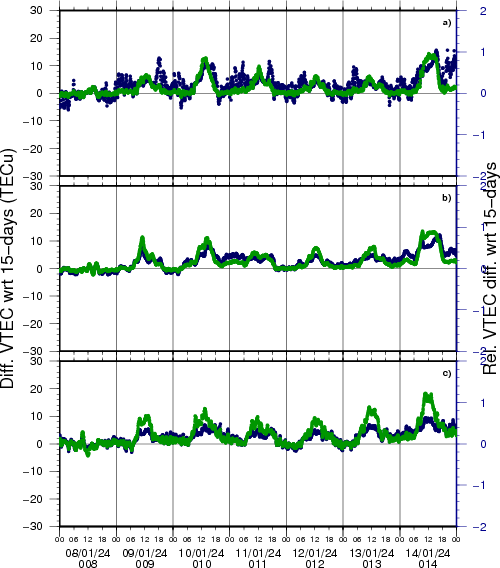
NEW! The time series below illustrates (in green) the VTEC deviation from normal quiet behaviour.
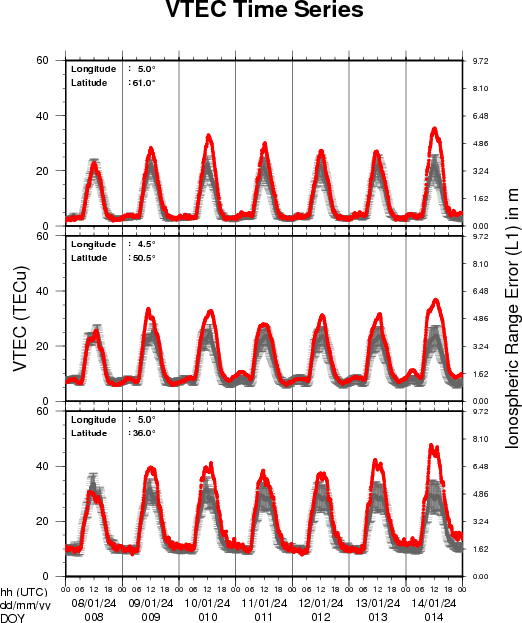
VTEC time series at 3 locations in Europe from 8 Jan 2024 till 14 Jan 2024
The top figure shows the time evolution of the Vertical Total Electron Content (VTEC) (in red) during the last week at three locations:
a) in the northern part of Europe(N 61deg E 5deg)
b) above Brussels(N 50.5deg, E 4.5 deg)
c) in the southern part of Europe(N 36 deg, E 5deg)
This top figure also shows (in grey) the normal ionospheric behaviour expected based on the median VTEC from the 15 previous days.
The time series below shows the VTEC difference (in green) and relative difference (in blue) with respect to the median of the last 15 days in the North, Mid (above Brussels) and South of Europe. It thus illustrates the VTEC deviation from normal quiet behaviour.
The VTEC is expressed in TECu (with TECu=10^16 electrons per square meter) and is directly related to the signal propagation delay due to the ionosphere (in figure: delay on GPS L1 frequency).
The Sun's radiation ionizes the Earth's upper atmosphere, the ionosphere, located from about 60km to 1000km above the Earth's surface.The ionization process in the ionosphere produces ions and free electrons. These electrons perturb the propagation of the GNSS (Global Navigation Satellite System) signals by inducing a so-called ionospheric delay.
See http://stce.be/newsletter/GNSS_final.pdf for some more explanations; for more information, see https://gnss.be/SpaceWeather
STCE activities
Check out our activity calendar: activities and encounters with the Sun-Space-Earth system and Space Weather as the main theme. We provide occasions to get submerged in our world through educational, informative and instructive activities.
If you want your event in our calendar, contact us: stce_coordination at stce.be
* Jan 22-24, 2024, STCE Space Weather Introductory Course, Brussels, Belgium - Registrations are open on https://www.stce.be/
* Jan 25, 2024, post-Space Weather Introductory Course, by JMG and MeteoWing, Brussels, Belgium - registration is included in the Jan SWIC
* Jan 30, 2024, public lecture on solar observations from ground, Urania, Hove, Belgium
* Feb 2, 2024, 15u - STCE Seminar, Identifying and Tracking Coronal Flux Ropes in Magnetic Field Simulations by Andreas Wagner, Brussels, Belgium
* Mar 4-5, 2024, STCE Space Weather Introductory Course, focus on aviation, online - Registrations are open on https://www.stce.be/
* Apr 22-24, 2024, STCE Space Weather Introductory Course, Brussels, Belgium - Registrations are open on https://www.stce.be/
More info needed? Contact us: stce_coordination at stce.be
Check: https://www.stce.be/