- Table of Content
- 1.M-class flare ...
- 2.Space Weather ...
- 3.Review of spac...
- 4.PROBA2 Observa...
- 5.Noticeable Sol...
- 6.International ...
- 7.Geomagnetic Ob...
- 8.The SIDC space...
- 9.Review of Iono...
2. Space Weather Introductory Course Jan 2024
3. Review of space weather
4. PROBA2 Observations (22 Jan 2024 - 28 Jan 2024)
5. Noticeable Solar Events
6. International Sunspot Number by SILSO
7. Geomagnetic Observations in Belgium
8. The SIDC space weather briefing
9. Review of Ionospheric Activity
M-class flare competition
Two active regions dominated the solar activity last week. Initially all eyes were on NOAA 3559 following its production of a strong M5.1 flare on 23 January (see the newsitem at https://www.sidc.be/article/work-progress ). Fairly quickly, the sunspot group became quiet and a new region in the southern solar hemisphere took over. NOAA 3561 emerged near and to the southwest of quiet active region NOAA 3555. It produced a total of 14 M-class flares on 22-24 January. They were mostly located over its central portion which consisted of a heap of small, opposite polarity sunspots. White light images and magnetograms of both regions are shown underneath.

Flaring activity in both sunspot regions contributed to a total of 8 M-class flares on 23 January. That's a lot for a single day, but is not unusual, even for this solar cycle. A total of 12 M-class flares were recorded on 14 December 2022, and 8 M-class events were also recorded on e.g. 20 May and 1 August 2023. NOAA 3561 outperformed NOAA 3559 in the production of M-class events (14 to 6), but NOAA 3559 produced the most intense ones with the aforementioned M5.1 flare on 23 January, and a long duration M6.8 flare on 29 January. The latter event is shown underneath combining AIA 171 (yellow; temperatures around 700,000 degrees) and AIA 131 (blue-reddish; multi-million degrees) from SDO (http://sdo.gsfc.nasa.gov/data/aiahmi/ ). The clip at https://www.sidc.be/index.php/article/m-class-flare-competition shows the prominent post-eruption coronal loops topped by very hot plasma from the reconnection site. The brief interruption in the clip is from an eclipse of the Sun by the Earth as seen from SDO's circular, geosynchronous orbit at an altitude of 35,789 km (inclined at 28.5 degrees). This orbit was chosen for continuous 24/7 communications with the fixed ground station, and to reduce the duration of solar eclipses to only about an hour a day for a few weeks a year.

Associated with the M6 flare was a moderate proton event with a maximum of 137 pfu (particle flux units) that was reached at 18:05 UTC, as well as a partial halo coronal mass ejection (CME). SOHO's coronagraphic imagery (https://soho.nascom.nasa.gov/data/realtime-images.html ) reveals that the bulk of this CME is directed away from Earth, but a glancing blow cannot be excluded and is forecasted to reach Earth on 31 January, with little geomagnetic effects expected. The images underneath show the coronagraphic view a few hours before and after the M6 flare. Note in the post-eruption image not only the CME, but also the increased noise from the impact of the energetic particles on the camera pixels.

Space Weather Introductory Course Jan 2024
The STCE Space Weather Introductory Course (SWIC) provides an elementary overview of the relevant aspects of space weather and how space weather impacts the Earth and the Earth's environment. Navigation, positioning, timing, communication, energy transport is critical for several businesses. The infrastructure (both in space and on the ground) is vulnerable for Space Weather and can lead to less good performance or even failure.
It is therefore key to understand space weather. During the SWIC, participants learn to read and interpret space weather bulletins and warnings. They learn to find their way in this highly scientific world.
The class of January 2024 was again a group of very enthusiastic and interested people.

A special thank to the guest lecturers Antonio, Jean-Marie, Lenka, Michaela, Sabrina, Tobias
More courses: https://events.spacepole.be/category/4/
Review of space weather
Solar Active Regions (ARs) and flares
Solar flaring activity reached high levels in the past week on 22 Jan with seven M-class flares and on 23 Jan with nine M-class flares. It dropped to moderate activity on 24 Jan with four M1 flares and it was further reduced to low levels for the rest of the week.
Coronal mass ejections
Several partial halo Coronal Mass Ejection (CME) were observed by LASCO-C2/SOHO. Five of those, launched between Jan 21 and Jan 24, were predicted to have a glancing blow to the Earth's environment.
Coronal Holes
Two Coronal Holes (CH) of negative polarity started crossing the Solar central meridian on Jan 25. The first one was located close to the solar North pole and probably connected to the polar CH. The second was southern but close to the solar equator.
Proton flux levels
The greater than 10 MeV proton flux reached but did not exceed the 10 pfu alert threshold level on Jan 22. This was the result of proton event associated with the M1 flare at 06:22 UTC that day. The next day it dropped to nominal levels.
Electron fluxes at GEO
The greater than 2 MeV electron flux, as measured by the GOES-16 satellite, was bellow the 1000 pfu threshold. The 24h electron fluence was at nominal levels.
Solar wind at L1
Three to four of the predicted glancing blows were recorded. The High Speed Stream (HSS) linked to the coronal holes did not arrive. The Solar Wind (SW) speed ranged between 330 km/s and 500 km/s, the total interplanetary magnetic field (Bt) varied between 1 nT and 11 nT, and its North-South component (Bz) fluctuated between -12 nT and 11 nT. The interplanetary magnetic field phi angle was directed both towards and away from the Sun in almost equal measures during the same period.
Geomagnetism
Geomagnetic conditions were globally quiet to unsettled (NOAA Kp 0+ to 3), with short period of active conditions (NOAA Kp 4-) on 23 and 24 Jan. Local conditions were quiet to unsettled (K BEL 1-3).
PROBA2 Observations (22 Jan 2024 - 28 Jan 2024)
Solar Activity
Solar flare activity fluctuated from low to moderate during the week.
In order to view the activity of this week in more detail, we suggest to go to the following website from which all the daily (normal and difference) movies can be accessed: https://proba2.oma.be/ssa
This page also lists the recorded flaring events.
A weekly overview movie (SWAP week 722) can be found here: https://proba2.sidc.be/swap/data/mpg/movies/weekly_movies/weekly_movie_2024_01_22.mp4.
Details about some of this week's events can be found further below.
If any of the linked movies are unavailable they can be found in the P2SC movie repository here: https://proba2.oma.be/swap/data/mpg/movies/.
Tuesday January 23


The largest flare of this week was an M5.1, but after a careful inspection of the SWAP data, it is likely that this flux resulted from a summed contribution of two nearly simultaneous flaring regions, NOAA 3559 and 3561. Therefore, the second largest flare was an M4.3, and it was observed by LYRA (top panel) and SWAP (bottom panel). The flare peaked on 2024-Jan-23 at 16:40 UT. It occurred in the south-western quadrant, and it originated from NOAA AR3561.
Find a SWAP movie of the event here: https://proba2.sidc.be/swap/movies/20240123_swap_movie.mp4.
Noticeable Solar Events
| DAY | BEGIN | MAX | END | LOC | XRAY | OP | 10CM | TYPE | Cat | NOAA |
| 22 | 0609 | 0622 | 0630 | N29E27 | M1.5 | 1N | III/3CTM/2 | 43 | 3559 | |
| 22 | 1928 | 1932 | 1936 | M1.2 | 43 | 3559 | ||||
| 22 | 1943 | 1947 | 1953 | S15W30 | M2.0 | 1F | 35 | 3561 | ||
| 22 | 2114 | 2121 | 2132 | M3.4 | 35 | 3561 | ||||
| 22 | 2136 | 2143 | 2158 | M1.6 | 35 | 3561 | ||||
| 22 | 2219 | 2222 | 2226 | M2.1 | 35 | 3561 | ||||
| 23 | 0309 | 0331 | 0338 | M5.1 | III/3 | 43 | 3559 | |||
| 23 | 0752 | 0811 | 0818 | M2.4 | 36 | 3561 | ||||
| 23 | 0818 | 0822 | 0826 | S19W37 | M2.3 | 1F | 36 | 3561 | ||
| 23 | 1240 | 1258 | 1303 | M1.0 | ||||||
| 23 | 1303 | 1308 | 1313 | M1.0 | 43 | 3559 | ||||
| 23 | 1445 | 1459 | 1505 | M1.3 | 36 | 3561 | ||||
| 23 | 1636 | 1640 | 1647 | M4.3 | 36 | 3561 | ||||
| 23 | 1835 | 1844 | 1849 | M1.1 | 36 | 3561 | ||||
| 23 | 1957 | 2001 | 2005 | M1.0 | VI/2 | 36 | 3561 | |||
| 24 | 0021 | 0038 | 0043 | M1.0 | 45 | 3561 | ||||
| 24 | 0131 | 0140 | 0153 | S20W48 | M2.6 | SF | 45 | 3561 | ||
| 24 | 0518 | 0543 | 0600 | M1.4 | 45 | 3561 | ||||
| 24 | 2044 | 2058 | 2111 | M1.3 | 45 | 3561 |
| LOC: approximate heliographic location | TYPE: radio burst type |
| XRAY: X-ray flare class | Cat: Catania sunspot group number |
| OP: optical flare class | NOAA: NOAA active region number |
| 10CM: peak 10 cm radio flux |
International Sunspot Number by SILSO
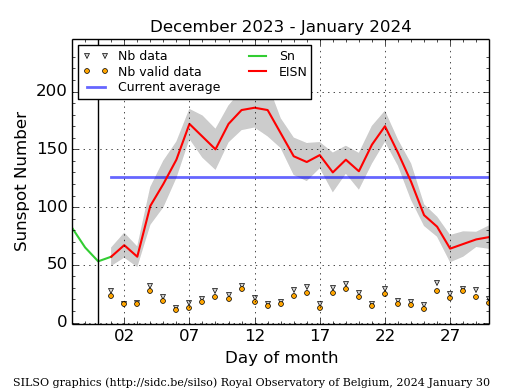
The daily Estimated International Sunspot Number (EISN, red curve with shaded error) derived by a simplified method from real-time data from the worldwide SILSO network. It extends the official Sunspot Number from the full processing of the preceding month (green line), a few days more than one solar rotation. The horizontal blue line shows the current monthly average. The yellow dots give the number of stations that provided valid data. Valid data are used to calculate the EISN. The triangle gives the number of stations providing data. When a triangle and a yellow dot coincide, it means that all the data is used to calculate the EISN of that day.
Geomagnetic Observations in Belgium
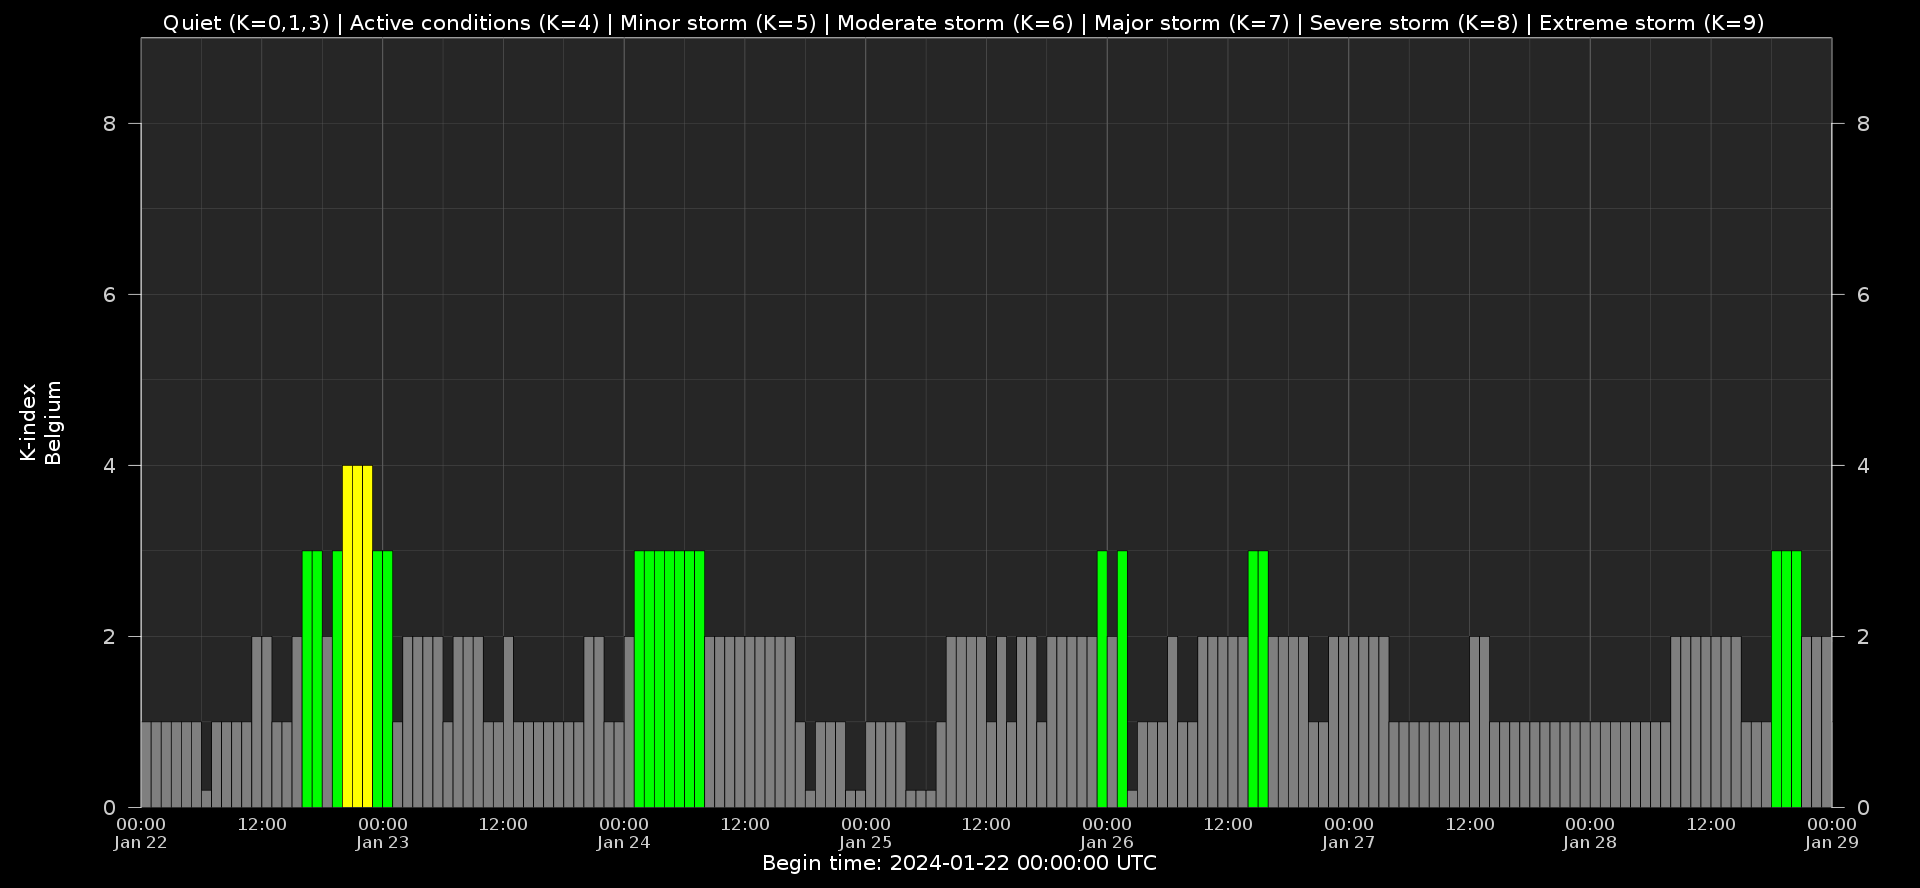
Local K-type magnetic activity index for Belgium based on data from Dourbes (DOU) and Manhay (MAB). Comparing the data from both measurement stations allows to reliably remove outliers from the magnetic data. At the same time the operational service availability is improved: whenever data from one observatory is not available, the single-station index obtained from the other can be used as a fallback system.
Both the two-station index and the single station indices are available here: http://ionosphere.meteo.be/geomagnetism/K_BEL/
The SIDC space weather briefing
The Space Weather Briefing presented by the SIDC (https://www.sidc.be) forecaster on duty from Jan 21 to 28. It reflects in images and graphs what is written in the space weather report: https://www.stce.be/briefings/20240129_SWbriefing.pdf

Review of Ionospheric Activity
NEW! The time series below illustrates (in green) the VTEC deviation from normal quiet behaviour.
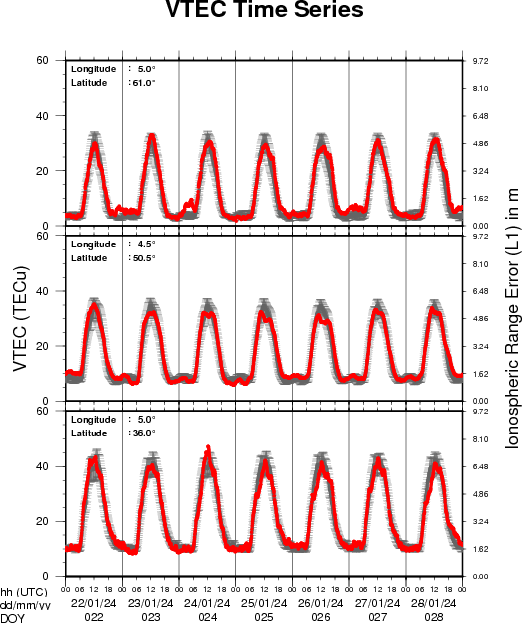

VTEC time series at 3 locations in Europe from 22 Jan 2024 till 28 Jan 2024
The top figure shows the time evolution of the Vertical Total Electron Content (VTEC) (in red) during the last week at three locations:
a) in the northern part of Europe(N 61deg E 5deg)
b) above Brussels(N 50.5deg, E 4.5 deg)
c) in the southern part of Europe(N 36 deg, E 5deg)
This top figure also shows (in grey) the normal ionospheric behaviour expected based on the median VTEC from the 15 previous days.
The time series below shows the VTEC difference (in green) and relative difference (in blue) with respect to the median of the last 15 days in the North, Mid (above Brussels) and South of Europe. It thus illustrates the VTEC deviation from normal quiet behaviour.
The VTEC is expressed in TECu (with TECu=10^16 electrons per square meter) and is directly related to the signal propagation delay due to the ionosphere (in figure: delay on GPS L1 frequency).
The Sun's radiation ionizes the Earth's upper atmosphere, the ionosphere, located from about 60km to 1000km above the Earth's surface.The ionization process in the ionosphere produces ions and free electrons. These electrons perturb the propagation of the GNSS (Global Navigation Satellite System) signals by inducing a so-called ionospheric delay.
See http://stce.be/newsletter/GNSS_final.pdf for some more explanations; for more information, see https://gnss.be/SpaceWeather