- Table of Content
- 1.Solar flares i...
- 2.From low to hi...
- 3.Review of spac...
- 4.Noticeable Sol...
- 5.International ...
- 6.PROBA2 Observa...
- 7.Geomagnetic Ob...
- 8.The SIDC space...
- 9.Review of Iono...
- 10.Courses and pr...
2. From low to high
3. Review of space weather
4. Noticeable Solar Events
5. International Sunspot Number by SILSO
6. PROBA2 Observations (5 Feb 2024 - 11 Feb 2024)
7. Geomagnetic Observations in Belgium
8. The SIDC space weather briefing
9. Review of Ionospheric Activity
10. Courses and presentations
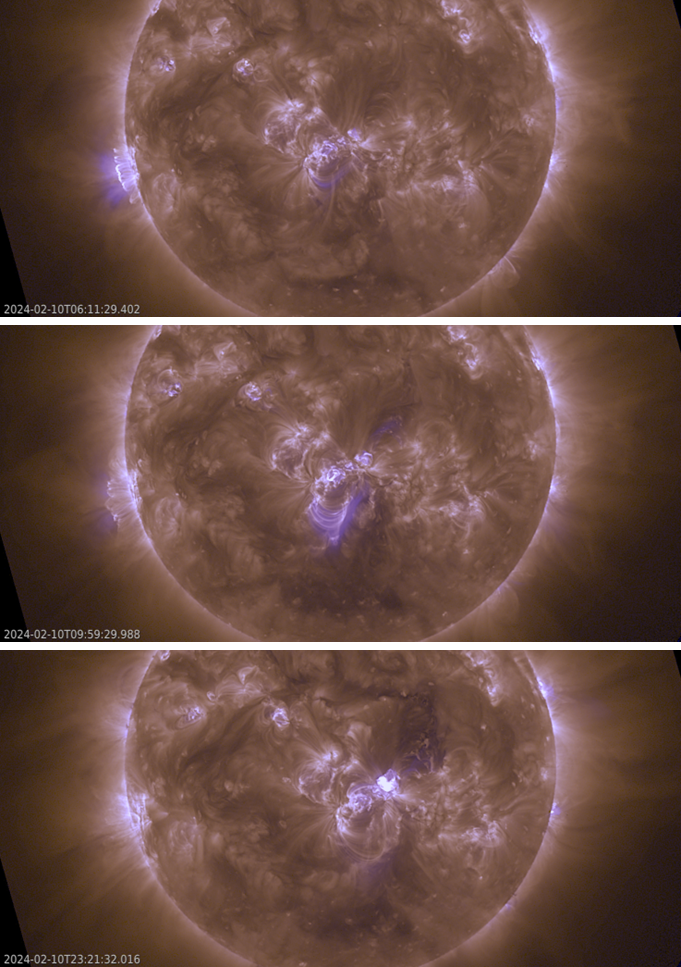
Solar flares in images
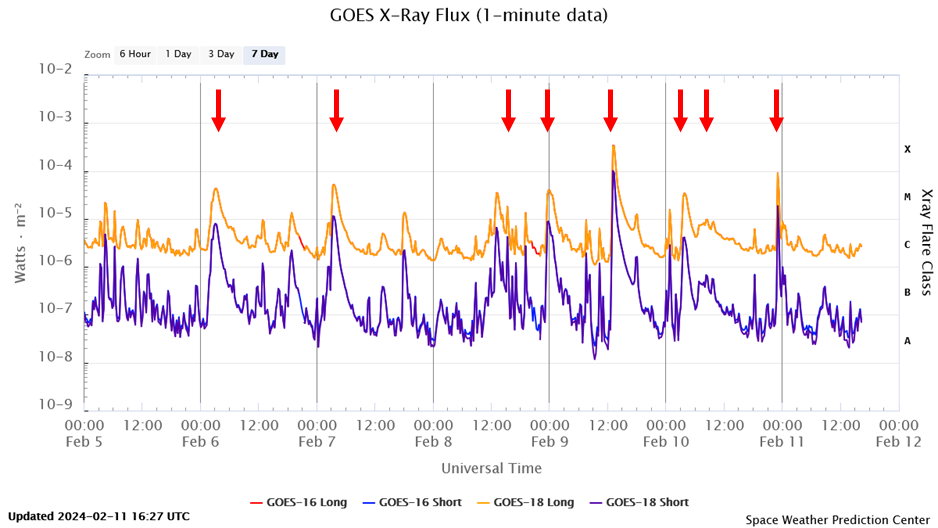
According to the NOAA statistics, the Sun produced 1 X-class and 18 M-class flares during the week of 5-11 February. The graph underneath shows the GOES measurements in x-rays (https://www.swpc.noaa.gov/products/goes-x-ray-flux ). The red arrows indicate the cherry-picked 8 events for which imagery has been made. Indeed, there were quite a few flaring events worthwhile to just take a look at it. Clips are in the online version of this article at https://www.stce.be/news/684/welcome.html
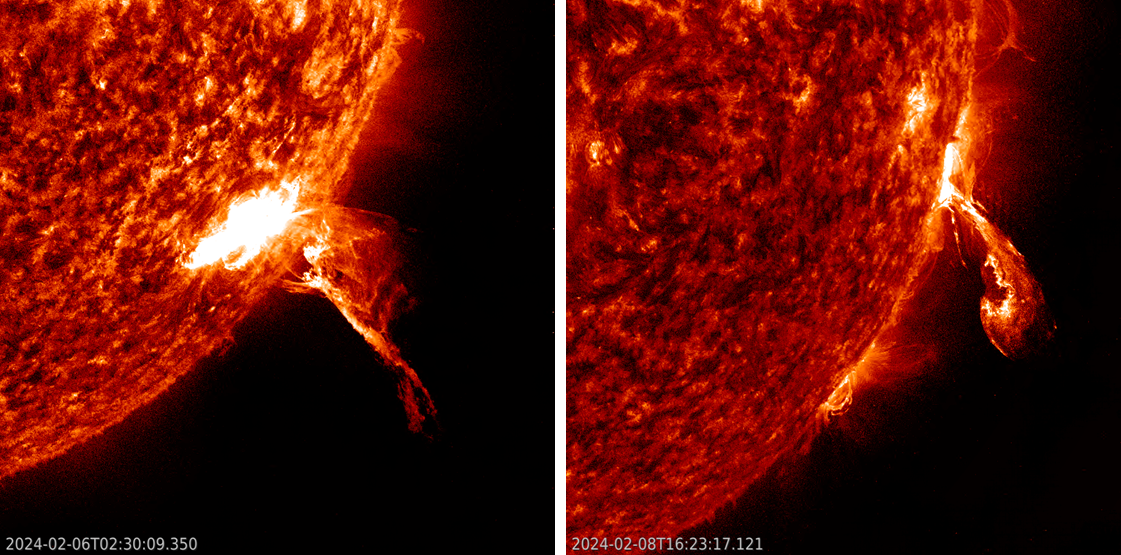
The first 2 images concern the M4.2 flare in NOAA 3575 on 6 February, and limb activity associated with the M1.2 flare in NOAA 3564 on 8 February. This active region is located about 20 degrees closer to the solar equator than NOAA 3575. The images were taken with the SDO/AIA 304 (http://sdo.gsfc.nasa.gov/data/aiahmi/ ) filter, showing the solar atmosphere at temperatures around 80.000 degrees.
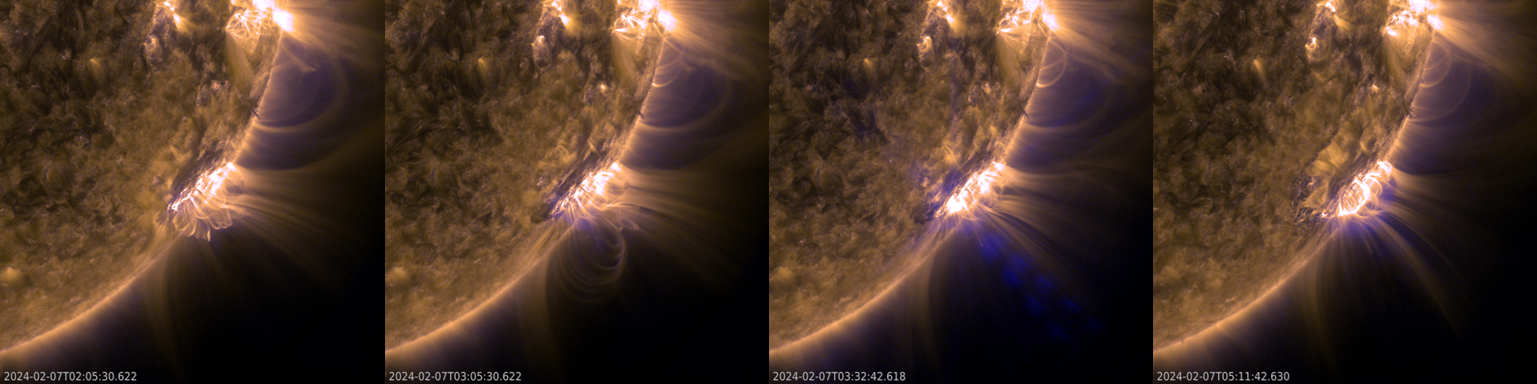
Then follow images combining SDO/AIA 171 and 131 filters, showing the solar corona at temperatures of resp. 700.000 and multi-million degrees. In the imagery they are shown with resp. yellowish and blue colours. Most prominent here are the series of fine post-eruption coronal loops and the hot plasma present above these loops. All 3 eruptions took place in NOAA 3575 and concern the M5.1 flare on 7 February, the M3.9 flare that peaked early on 9 February, and of course the strong X3 flare later that day as discussed in this newsflash (https://www.stce.be/news/683/welcome.html ).
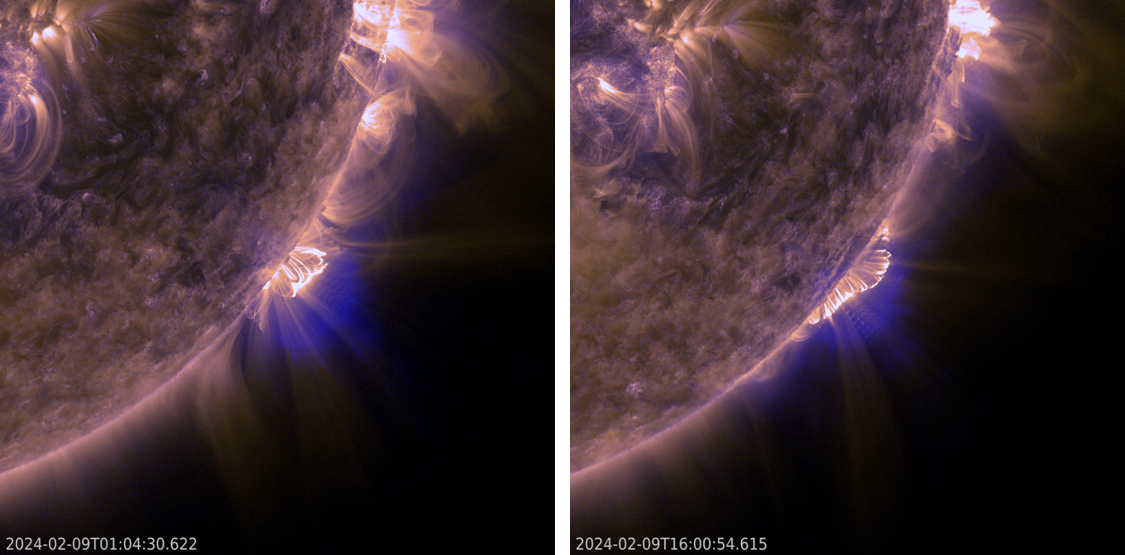
Last but not least follow (almost) full disk images from solar activity that took place on 10 February. The images were made with the SUVI camera on board GOES (Solar Ultraviolet imager ; https://www.swpc.noaa.gov/products/goes-solar-ultraviolet-imager-suvi ), combining again filters that show the Sun at multi-million degrees (SUVI 094 ; bluish hue) and at 1.25 million degrees (SUVI 195; brownish). The latter shows very well coronal dimming, i.e. a darkening in areas of the solar atmosphere consistent with material being ejected into space. These dimmings can be seen to resp. the south and north of active region NOAA 3576 (near disk centre) and were associated with a C8.1 and M9.0 flare that peaked at 07:46 and 23:07 UTC. The first of the 3 eruptions in the imagery shows a spectacular long-duration M3.4 flare near the Sun's east limb (left), that peaked at 03:54UTC.
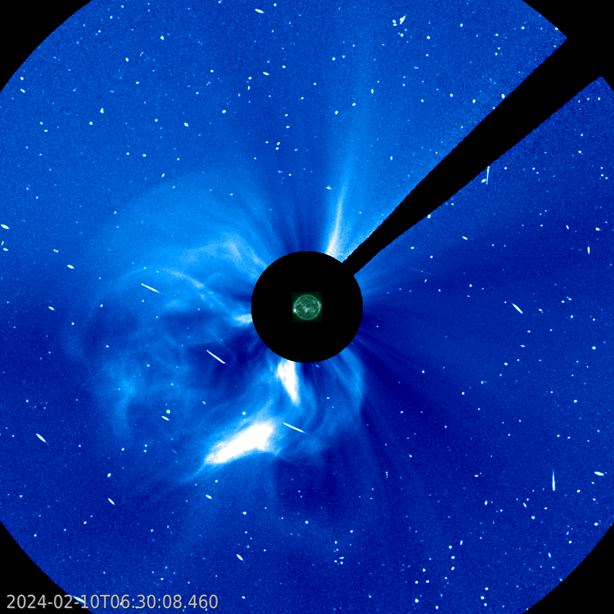
The 8 events discussed above all had an associated coronal mass ejection (CME). Most of the CMEs had plane-of the-sky speeds around 1000 km/s, except the ones generated by NOAA 3564 which had speeds closer to 500 km/s and were also much narrower. A clip with coronagraphic images (SOHO / LASCO C3 - http://sohowww.nascom.nasa.gov/data/realtime-images.html ) for the entire week can be found online, the image underneath shows the CME associated with the M3 flare near the Sun's east limb. Some of the CMEs in the clip are related to smaller, front-side eruptive events, or events having their origin on the far-side as they have no bright counterpart in the overlying AIA 094 imagery.
From low to high
The instrument EUI onboard of Solar Orbiter is following the solar cycle from the first row in space. Just after the last solar minimum, Solar Orbiter was launched. In the beginning of the mission, EUI was capturing the quiet Sun on film. These days, EUI is witnessing an active Sun in its high season. We can admire a canvas of magnetic loops painted with plasma.
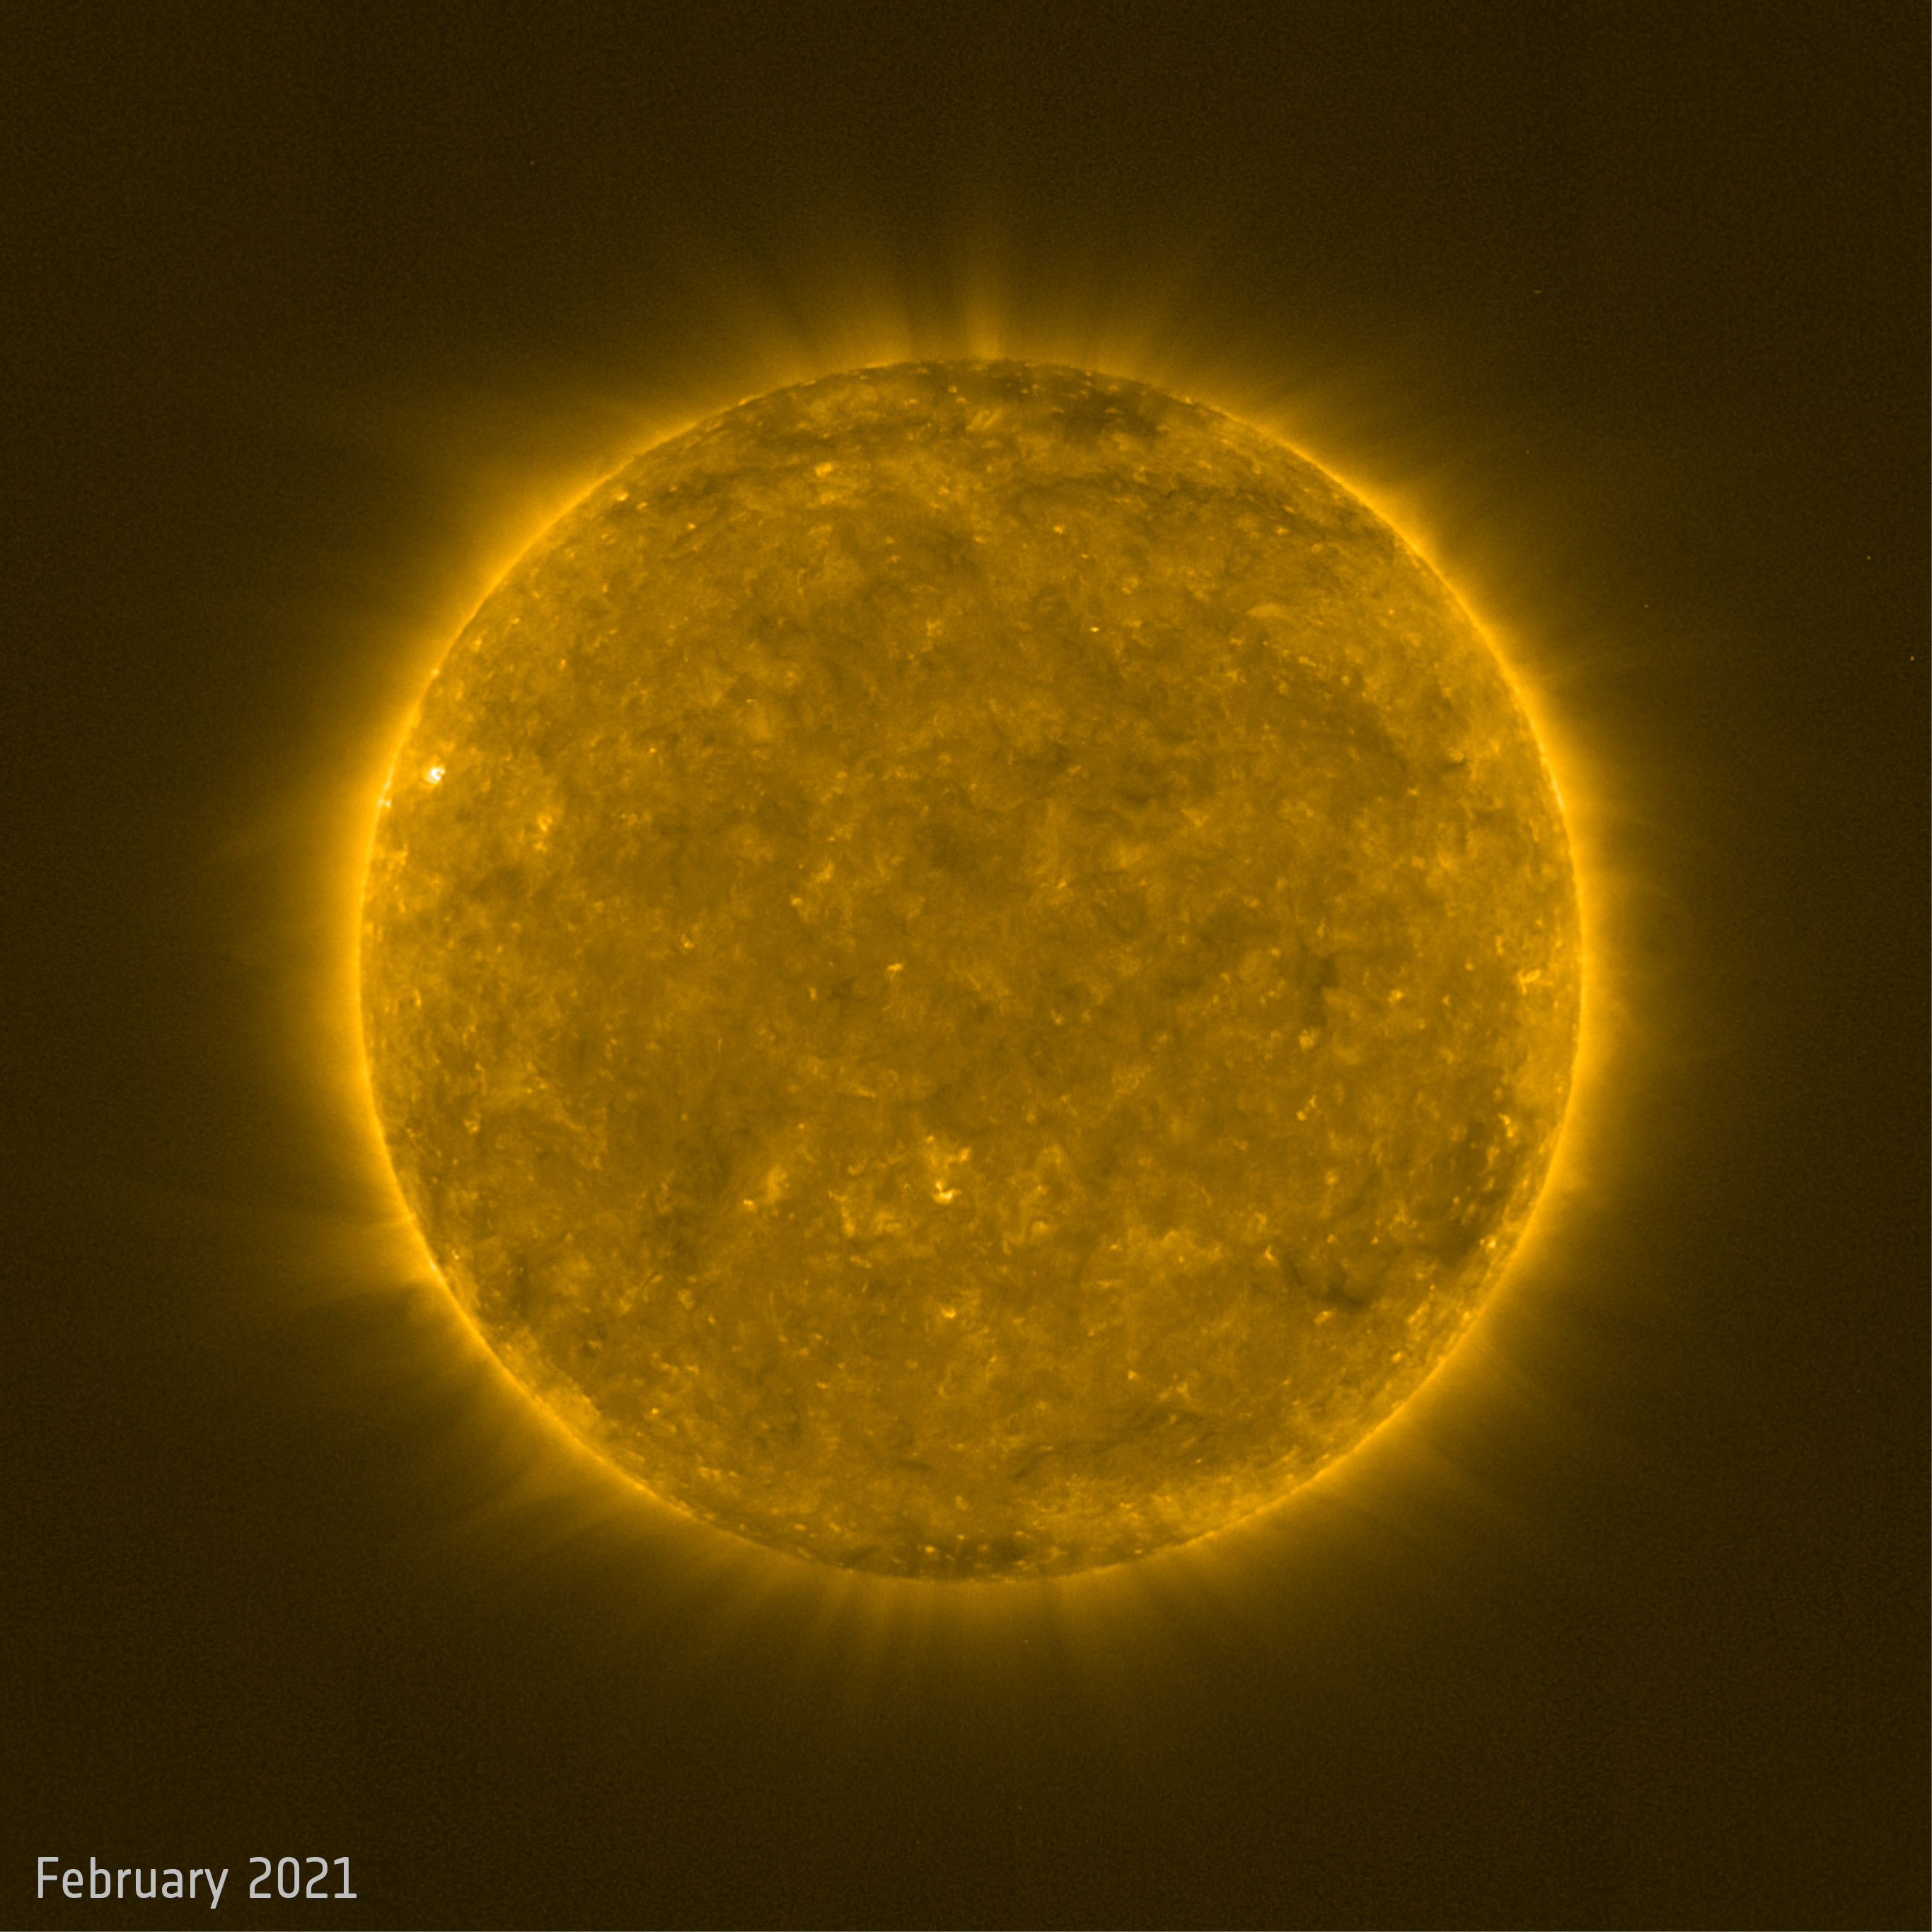
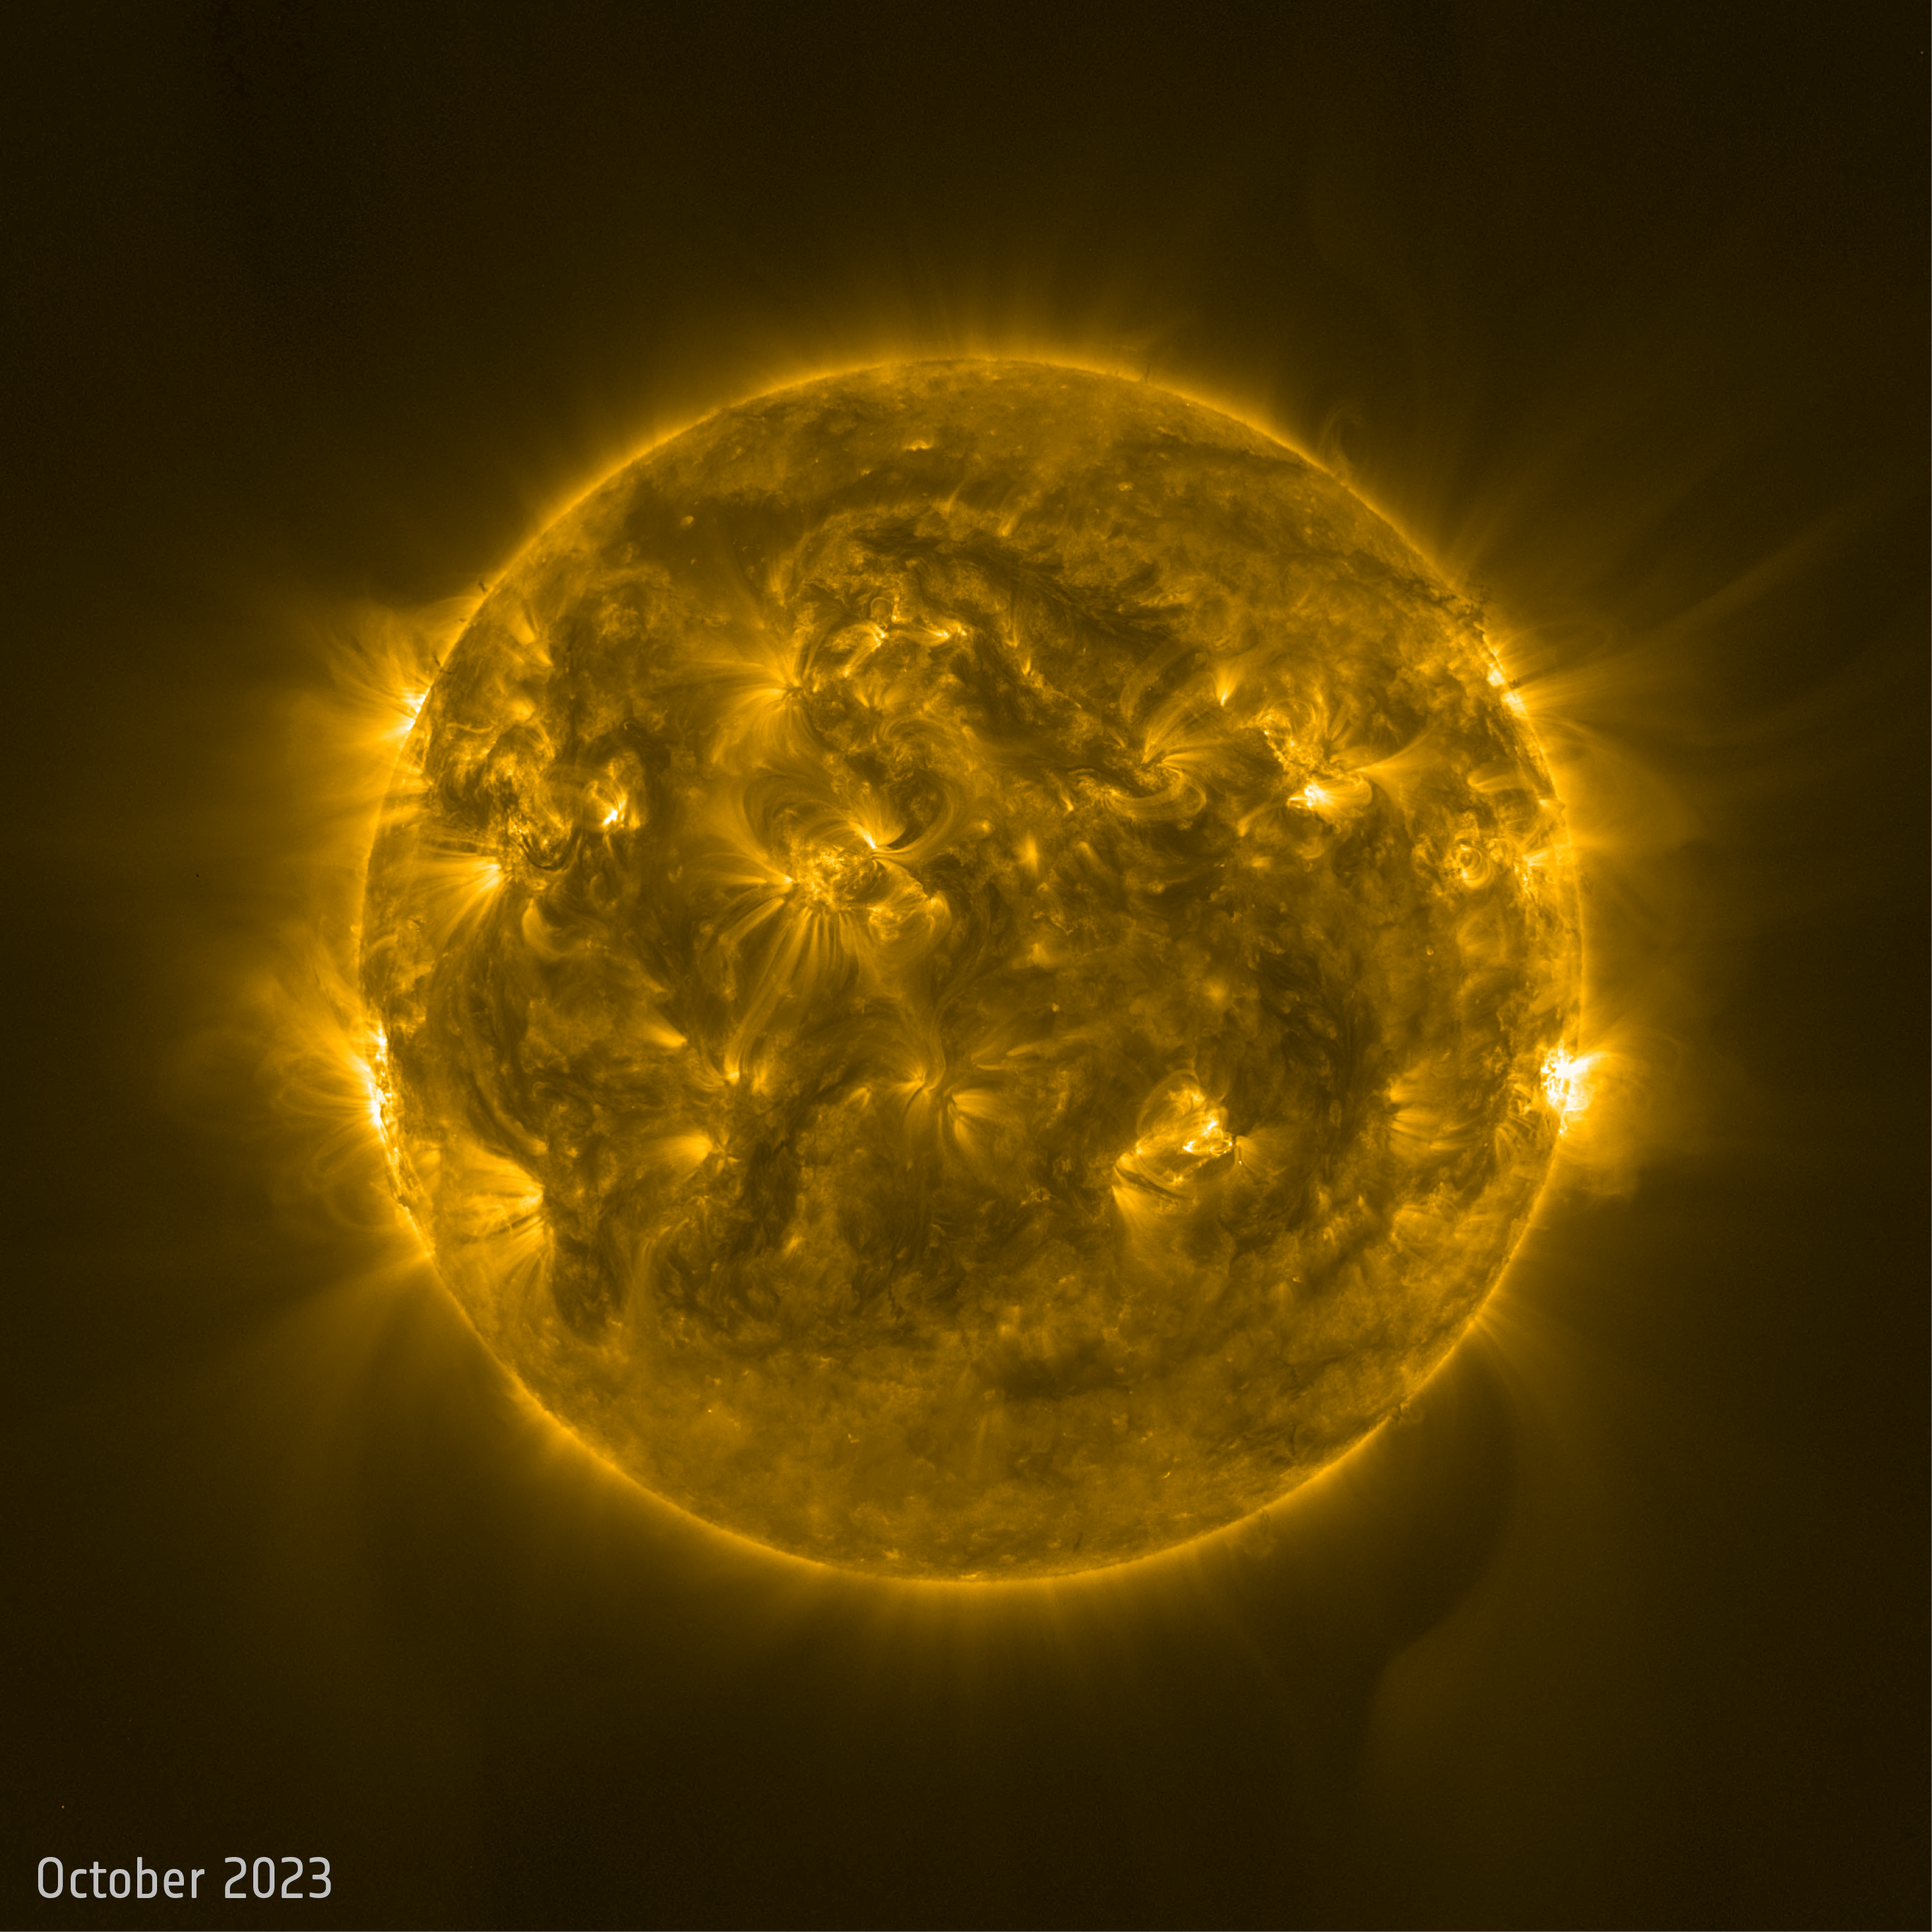
Use the tool on the ESA website to swap from low to high: https://www.esa.int/ESA_Multimedia/Images/2024/02/Sun_s_surprising_activity_surge_in_Solar_Orbiter_snapshot/?2
Review of space weather
Solar Active Regions (ARs) and flares
The solar flaring activity was moderate to high with daily M-class flares. Sixteen (16) numbered active regions on the visible solar disc were noted. NOAA AR 3575 (beta-gamma-delta) and NOAA AR 3576 (beta-gamma-delta) contributed to most of the flaring activity. The strongest flare was an X3.3, start time 12:53 UTC, end time 13:31 UTC, peak time 13:14 UTC on Feb 9th, produced by NOAA AR 3575 from a day behind the south-west limb. NOAA 3576 also produced several notable M-class flares, including an M9 flare with start time 22:56 UTC, end time 23:14 UTC and peak time 23:07 UTC on Feb 10th. Two new regions formed towards the end of the week, NOAA 3583 (beta) and NOAA 3582 (beta), exhibiting very quick growth and producing mid to high C-class flares. The remaining regions were mostly simply and quiet.
Coronal mass ejections
Multiple back-sided halo and partial halo coronal mass ejections (CMEs) were seen. Some were produced by regions behind or on the east limb. NOAA AR 3575 from behind the west limb was also the source of strong CMEs. A large filament eruption in the northern hemisphere resulted in a northward CME launched at around 13:48 UTC on Feb 6th. The bulk of this filament-related CME was estimated to head north and out of the Sun-Earth line and a very minor possible glancing blow impact on Earth was expected on Feb 9th. A possibly related arrival was registered in the solar wind data in the evening of Feb 9th.
A filament in the southern hemisphere located to the west of NOAA AR 3576 erupted producing a medium intensity coronal dimming visible in the SDO/AIA images around 21:00 UTC on Feb 8th. The eruption was associated with a narrow south-ward CME. The bulk was expected to be off the Sun-Earth line, but a weak glancing blow was expected on Feb 12th and possibly arrived to the Earth earlier on Feb 11th.
A notable back-sided event was an almost full halo CME first observed in the LASCO/C2 coronagraph imagery around 13:25 UTC on Feb 9th. The eruption was related to the X3.3 flaring from NOAA AR 3575 from behind the south-west limb. A type IV radio burst, a fast shock and a clearly detectable coronal wave accompanied the event. The CME was back-sided with no significant impact on Earth expected (expect for a radiation storm and possible Ground Level Enhancement).
Coronal Holes
A long patchy positive polarity coronal hole had crossed the central meridian previous week and continued to be at geo-effective position at the beginning of the week. No other geo-effective coronal holes were observed this week.
Solar Proton flux near Earth
The greater than 10 MeV proton flux showed a minor enhancement, remaining below radiation storm levels, on Feb 6th and Feb 7th due to the eruptive activity originating from NOAA AR 3575. The proton flux experienced a sharp increase on Feb 09th related to the X3.3 flare and an associated fast coronal mass ejection. The greater than 10 MeV proton flux exceeded the moderate radiation storm levels, 100 pfu, on Feb 10th and remained close to the threshold throughout the entire day. The proton flux decreased to minor radiation storm levels on Feb 11th.
Electron fluxes at GEO
The greater than 2 MeV electron flux was below the 1000 pfu threshold throughout the entire week. The corresponding electron fluence was at nominal levels.
Solar wind at L1
The week started with a slightly enhanced solar wind due to a connection to a high speed stream from a positive polarity coronal hole. The influence of the high speed stream continued until the UTC afternoon of Feb 09th with speeds up to about 555 km/s. A weak shock was detected in the solar wind (ACE and DSCOVR) around 21:47 UTC on Feb 9th. The interplanetary magnetic field mildly increased from 7 nT to 9.3 nT and the solar wind speed jumped from 395 km/s to 503 km/s. The solar wind density at the shock slightly decreased and the temperature jumped from about 2.4e4 K to 3.6e5 K. The shock was related to an expected weak glancing blow ICME arrival related to the Feb 6th filament eruption and associated CME.
A more prominent solar wind shock was detected at 01:20 UTC on Feb 11th, possibly related to an early ICME arrival of the expected Feb 8th CME. The solar wind speed jumped from 355 km/s to 440 km/s. The magnitude of the interplanetary magnetic field quickly increased from 4 nT to 16 nT and soon after reached a maximum value of 19 nT. With the ICME arrival the solar wind velocity increased to above 600 km/s.
Geomagnetism
The geomagnetic conditions were mostly quiet to unsettled on Feb 10th. Quiet to active conditions were registered on Feb 11th with isolated minor storm over Belgium between 05 and 06 UTC on Feb 11th.
Noticeable Solar Events
| DAY | BEGIN | MAX | END | LOC | XRAY | OP | 10CM | TYPE | Cat | NOAA |
| 05 | 0413 | 0428 | 0444 | S16E71 | M2.1 | SF | 3576 | |||
| 05 | 0610 | 0622 | 0626 | S21E79 | M1.4 | SF | V/3III/2 | 3576 | ||
| 06 | 0215 | 0228 | 0237 | M2.2 | II/2 | 56 | 3575 | |||
| 06 | 0237 | 0312 | 0337 | M4.2 | CTM/2VII/2II/1IV/2 | 56 | 3575 | |||
| 06 | 1838 | 1849 | 1907 | M1.3 | 56 | 3575 | ||||
| 07 | 0304 | 0331 | 0411 | S40W78 | M5.1 | SF | CTM/1 | 56 | 3575 | |
| 07 | 1741 | 1805 | 1835 | M1.3 | 65 | 3576 | ||||
| 08 | 1241 | 1312 | 1337 | M3.4 | 65 | 3576 | ||||
| 08 | 1411 | 1418 | 1425 | M1.2 | 62 | 3564 | ||||
| 08 | 1517 | 1523 | 1527 | S15E25 | M1.8 | 1F | 65 | 3576 | ||
| 08 | 1856 | 1902 | 1906 | S15E24 | M1.3 | 1F | III/1 | 65 | 3576 | |
| 09 | 0036 | 0041 | 0045 | S16E17 | M3.1 | 1N | VI/1 | 65 | 3576 | |
| 08 | 2316 | 2355 | 0036 | M3.9 | ||||||
| 09 | 1253 | 1314 | 1332 | S16E14 | X3.3 | SF | CTM/1VII/3IV/2III/2 | 3575 | ||
| 09 | 1754 | 1800 | 1807 | M1.2 | 65 | 3576 | ||||
| 10 | 0042 | 0051 | 0100 | S14E6 | M1.5 | SF | 65 | 3576 | ||
| 10 | 0304 | 0354 | 0429 | S15E4 | M3.4 | SF | ||||
| 10 | 2256 | 2307 | 2314 | S10W12 | M9.0 | 1F | III/2IV/3II/3 | 65 | 3576 | |
| 11 | 2235 | 2245 | 2250 | M1.0 |
| LOC: approximate heliographic location | TYPE: radio burst type |
| XRAY: X-ray flare class | Cat: Catania sunspot group number |
| OP: optical flare class | NOAA: NOAA active region number |
| 10CM: peak 10 cm radio flux |
International Sunspot Number by SILSO
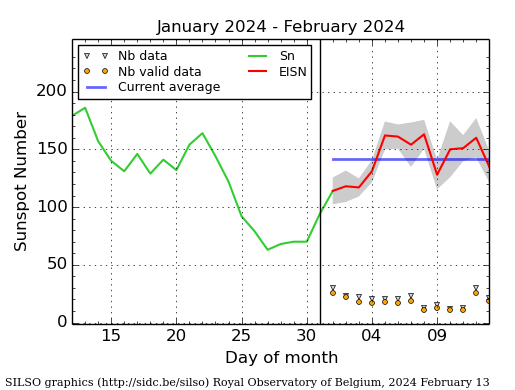
The daily Estimated International Sunspot Number (EISN, red curve with shaded error) derived by a simplified method from real-time data from the worldwide SILSO network. It extends the official Sunspot Number from the full processing of the preceding month (green line), a few days more than one solar rotation. The horizontal blue line shows the current monthly average. The yellow dots give the number of stations that provided valid data. Valid data are used to calculate the EISN. The triangle gives the number of stations providing data. When a triangle and a yellow dot coincide, it means that all the data is used to calculate the EISN of that day.
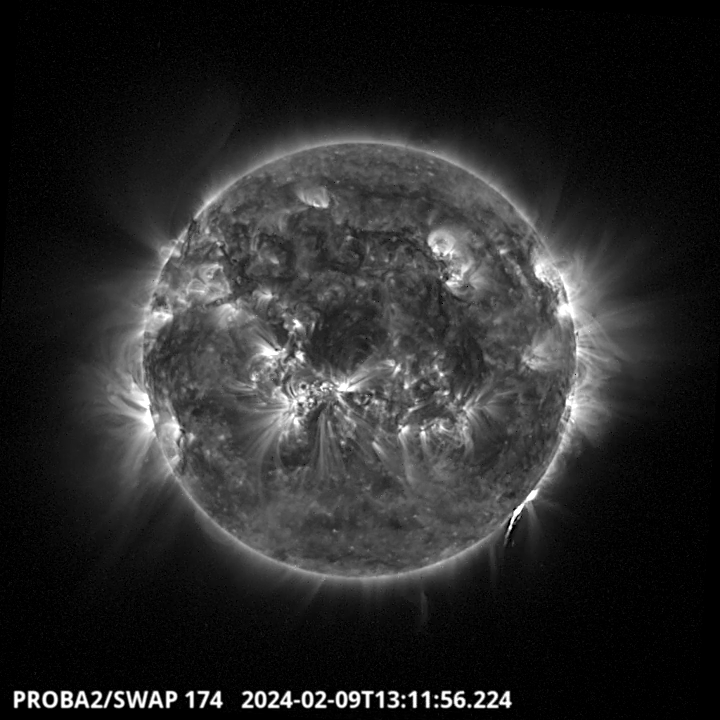
PROBA2 Observations (5 Feb 2024 - 11 Feb 2024)
Solar Activity
Solar flare activity fluctuated from moderate to high during the week.
In order to view the activity of this week in more detail, we suggest to go to the following website from which all the daily (normal and difference) movies can be accessed: https://proba2.oma.be/ssa
This page also lists the recorded flaring events.
A weekly overview movie (SWAP week 724) can be found here: https://proba2.sidc.be/swap/data/mpg/movies/weekly_movies/weekly_movie_2024_02_05.mp4.
Details about some of this week's events can be found further below.
If any of the linked movies are unavailable they can be found in the P2SC movie repository here: https://proba2.oma.be/swap/data/mpg/movies/.
Friday February 09
The largest flare of this active week was an X3.3, and it was observed by LYRA (top panel) and SWAP (bottom panel). The flare peaked on 2024-Feb-09 at 13:14 UT. It occurred at the south-western limb, and it originated from NOAA AR3575.
Find a SWAP movie of the event here: https://proba2.sidc.be/swap/movies/20240209_swap_movie.mp4.
Geomagnetic Observations in Belgium
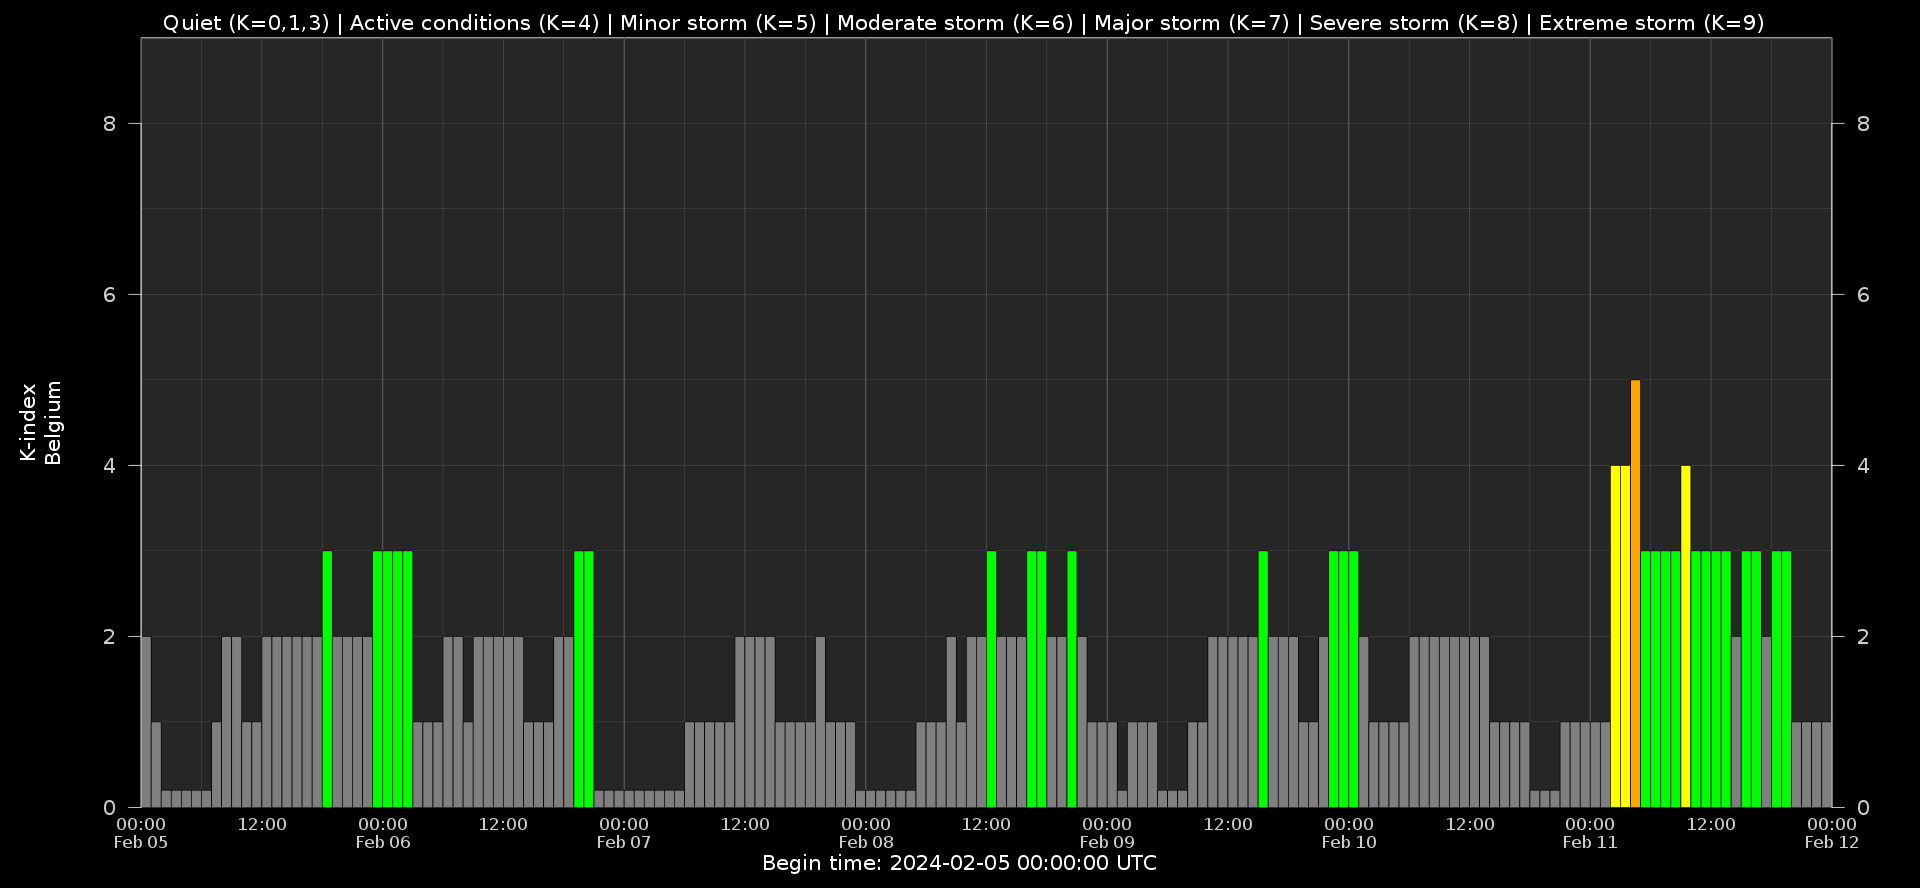
Local K-type magnetic activity index for Belgium based on data from Dourbes (DOU) and Manhay (MAB). Comparing the data from both measurement stations allows to reliably remove outliers from the magnetic data. At the same time the operational service availability is improved: whenever data from one observatory is not available, the single-station index obtained from the other can be used as a fallback system.
Both the two-station index and the single station indices are available here: http://ionosphere.meteo.be/geomagnetism/K_BEL/
The SIDC space weather briefing
The Space Weather Briefing presented by the SIDC (https://www.sidc.be) forecaster on duty from Feb 4 to 11. It reflects in images and graphs what is written in the space weather overview of the week: https://www.stce.be/briefings/20240212_SWbriefing.pdf
Review of Ionospheric Activity
NEW! The time series below illustrates (in green) the VTEC deviation from normal quiet behaviour.
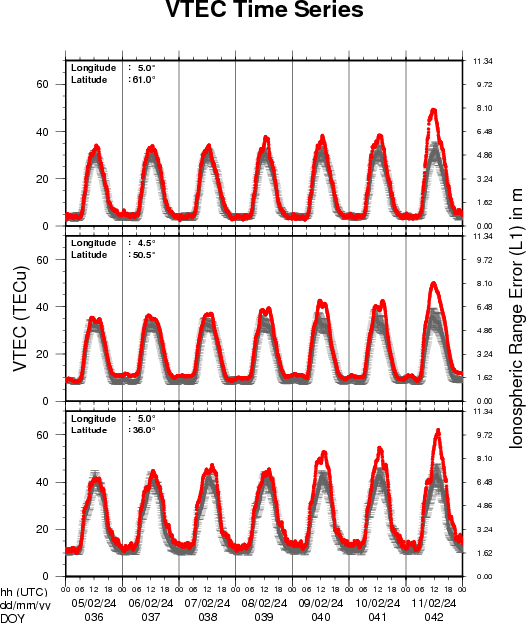
VTEC time series at 3 locations in Europe from 5 Feb 2024 till 11 Feb 2024
The top figure shows the time evolution of the Vertical Total Electron Content (VTEC) (in red) during the last week at three locations:
a) in the northern part of Europe(N 61deg E 5deg)
b) above Brussels(N 50.5deg, E 4.5 deg)
c) in the southern part of Europe(N 36 deg, E 5deg)
This top figure also shows (in grey) the normal ionospheric behaviour expected based on the median VTEC from the 15 previous days.
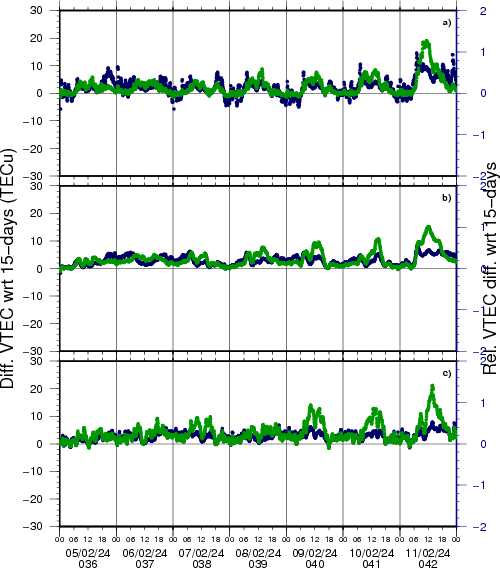
The time series below shows the VTEC difference (in green) and relative difference (in blue) with respect to the median of the last 15 days in the North, Mid (above Brussels) and South of Europe. It thus illustrates the VTEC deviation from normal quiet behaviour.
The VTEC is expressed in TECu (with TECu=10^16 electrons per square meter) and is directly related to the signal propagation delay due to the ionosphere (in figure: delay on GPS L1 frequency).
The Sun's radiation ionizes the Earth's upper atmosphere, the ionosphere, located from about 60km to 1000km above the Earth's surface.The ionization process in the ionosphere produces ions and free electrons. These electrons perturb the propagation of the GNSS (Global Navigation Satellite System) signals by inducing a so-called ionospheric delay.
See http://stce.be/newsletter/GNSS_final.pdf for some more explanations; for more information, see https://gnss.be/SpaceWeather
Courses and presentations
Courses and presentations with the Sun-Space-Earth system and Space Weather as the main theme. We provide occasions to get submerged in our world through educational, informative and instructive activities.
* February 27, Solar physics and Space Weather: history and introduction, online course - Registrations are open on https://www.stce.be/
* Mar 4-5, 2024, STCE Space Weather Introductory Course, focus on aviation, online - fully booked
* March 26, Solar physics and Space Weather: Sunspots and Solar Radio Astronomy , online course - Registrations are open
* Apr 22-24, 2024, STCE Space Weather Introductory Course, Brussels, Belgium - Registrations are open
* Apr 26, Public presentation, The PROBA-3 Mission: Artificial Total Solar Eclipse in Space, MIRA, Grimbergen, Belgium
* April 30, Solar physics and Space Weather: Solar Orbiter Spacecraft, online course - Registrations are open
* May 13, lecture by the STCE, From physics to forecasting, ESA Space Weather Training Course 2024, Euro Space Center, Redu, Belgium
* May 13 - 17, lectures by the STCE, solar and heliospheric weather; magnetosphere, ionosphere, aviation, and ground based impact, Course Operational Space Weather Fundamentals, L'Aquila, Italy
* May 18, Public presentation, The PROBA-3 Mission: Artificial Total Solar Eclipse in Space, FotonFest, Urania, Hove, Belgium
* May 28, Solar physics and Space Weather: Proba-2 and Proba-3, online course - Registrations are open
* June 25, Solar physics and Space Weather: predictions and services, online course - Registrations are open
To register for a course, check the page of the STCE Space Weather Education Center: https://www.stce.be/SWEC
If you want your event in the STCE newsletter, contact us: stce_coordination at stce.be