- Table of Content
- 1.When the dust ...
- 2.The STCE Annua...
- 3.Review of sola...
- 4.PROBA2 Observa...
- 5.Noticeable Sol...
- 6.International ...
- 7.Geomagnetic Ob...
- 8.The SIDC Space...
- 9.Review of Iono...
- 10.STCE courses a...
2. The STCE Annual meeting - June 27
3. Review of solar activity
4. PROBA2 Observations (13 May 2024 - 19 May 2024)
5. Noticeable Solar Events
6. International Sunspot Number by SILSO
7. Geomagnetic Observations in Belgium
8. The SIDC Space Weather Briefing
9. Review of Ionospheric Activity
10. STCE courses and seminars
When the dust has settled...
Solar observers and space weather forecasters are recovering from the craziness after NOAA 13664 unleashed dozens of strong solar flares and earth-directed coronal mass ejections (CMEs) during the first half of May. They could barely keep up with sending alerts and analyzing all the events which happened in quick succession. This article provides some perspective on the space weather activity as a result of NOAA 13664's eruptiveness.
We can be very clear on NOAA 13664's flare productivity: It belongs to the highest in decades. In fact, based on the NOAA/SWPC weekly reports ((preliminary data), active region NOAA 13664 now occupies the 4th spot in terms of highest M- and X-class flare production since the start of the GOES measurements in 1976. With 65 flares, only the legendary NOAA 5395 (March 1989 - 66 M- and 14 X-class flares) and 2 groups from solar cycle 21 (SC21) are doing better. Note that all the flare intensities prior to SC25 have been upscaled by a factor 1.43 to allow comparison of the flare numbers on equal footing with the current GOES measurements (see the NOAA/SWPC note at https://ngdc.noaa.gov/stp/satellite/goes/doc/GOES_XRS_readme.pdf ). NOAA 13664 also got the bronze medal for having produced the most X-class flares during its transit over the solar disk. With 12 "eXtreme" flares, it's just shy of NOAA 5395 (14) and NOAA 5312 (13). NOAA 13664 also produced the strongest flare so far this solar cycle (SC25), an X8.7 on 14 May (STCE Newsitem at https://www.stce.be/news/700/welcome.html ). It also contributed to the very high solar activity levels observed on 8 May. This term is only given when there are at least 5 flares with an intensity of M5 or larger. This hadn't happened since 7 March 1991, and only in June 1982 there are days with even more such strong (M5 or larger) flares. Finally, May 2024 is shaping up to be one of the most flare productive ever. With still 1 week to go, it has already 102 M- and 18 X-class flares, ranking 11th in most flare productive months. March 1991 tops this list with a mind-blowing 156 M- and 23 X-class flares. Underneath a picture of NOAA 13664 taken by Pascal Hilkens on 9 May. The sunspot group is obviously the largest of the solar cycle so far (2400 MH, or 14 times the total surface of the Earth). This makes it somewhat larger than the Carrington group from 1859, but smaller than NOAA 12192 from 2014 and the Halloween group NOAA 10486 (see this STCE Newsitem at https://www.stce.be/news/688/welcome.html for more info).

In terms of solar radiation storms, NOAA 13664 was a bit of a bummer with only 3 moderate proton events (STCE newsitem: https://www.stce.be/news/233/welcome.html ). The greater than 10 MeV proton flux reached a maximum of only 207 pfu on 10 May. However, associated with another strong X5.8 solar flare produced by NOAA 13664 early on 11 May, the greater than 100 MeV proton flux rose to 7 pfu. That was sufficient for a Ground Level Enhancement (GLE), only the second so far this solar cycle and number 74 since the measurements started back in the 1940s (Oulu, https://gle.oulu.fi/#/ ). The graph underneath shows the small bump in the neutron count, which happened right during the raging geomagnetic storm of 10-11 May. The drop prior to the GLE is called a "Forbush decrease" and is the result of the passing CMEs responsible for this geomagnetic storm. They provide a strong magnetic shield against the cosmic ray particles from outside our solar system. GLE 74 will certainly not be remembered for being particularly strong. More info on GLEs in the STCE Newsitems at https://www.stce.be/news/554/welcome.html and https://www.stce.be/news/450/welcome.html

The geomagnetic storm of 10-11 May also managed to squeeze itself in a Top 10 list. Indeed, with the Disturbance storm-time index (Dst) reaching a preliminary value of -412 nT on 11 May, it is ranked as the 7th day with the most negative Dst value since the measurements started in 1957 (WDC Kyoto - https://wdc.kugi.kyoto-u.ac.jp/ ). It dwarfs the strongest storm of the previous solar cycle -the St-Patrick's Day storm of 17 March 2015 (-234 nT ; https://www.stce.be/news/301/welcome.html )- and we have to go back to October-November 2003 and November 2004 to find storms of comparable strength. The 10-11 May storm ranks just behind 20 November 2003 but before other major storms such as on 26 May 1967, 31 March 2001 and the Halloween storm on 30 October 2003. Only the famous 13-14 March 1989 storm (-589 nT) and 3 days in the late 1950s have a more negative Dst. That being said, as Dst values are only available since 1957, one should not forget there are also other big storms such as the Carrington event, the 4 February 1872 storm, and the 13-15 May 1921 storm. For these events, individual Dst values of resp. -949 nT, -834 nT (Hayakawa et al. 2023- https://iopscience.iop.org/article/10.3847/1538-4357/acc6cc ) and -907 nT (Love et al. 2019 - https://agupubs.onlinelibrary.wiley.com/doi/10.1029/2019SW002250 ) have been calculated. These are clearly much stronger than the one of 10-11 May, a sobering realization! The image of the aurora underneath was taken by Yash Soorma from Melbourne (Australia) on 11 May.

The STCE Annual meeting - June 27
It is the season of the STCE annual meeting. Time to present the highlights of the past year!
In 2023 we tried to re-vitilise the STCE and re-invent ourselves. We defined the key domains and topics covering the activities funded by the STCE. We are still shaping and restructuring it. It is a continuous process that keeps the STCE dynamic.
This years annual meeting gives the floor to everybody at the space pole involved in an STCE domain and topic that should be highlighted.
Submission and registration: https://events.spacepole.be/event/203/
All sorts of presentations are welcomed

Review of solar activity
Solar Active Regions (ARs) and flares
Solar flaring activity reached high levels in the past week with five X-class flares.
NOAA Active Region (AR) 3664 (magnetic configuration Beta-Gamma-Delta, Catania sunspot group 86) produced an X1.7 at 14 May 02:09 UTC, an X1.2 at 14 May 12:55 UTC, an X8.7 at 14 May 16:51 UTC, and an X3.4 at 15 May 08:37 UTC. The fifth X class flare came from NOAA AR 3685 (magnetic configuration Beta-Gamma, Catania Sunspot group no 11). It was a triple-peaked flare with its highest peak reaching X2.9 on 15 May 14:38 UTC.
Coronal mass ejections (CME)
An Earth-directed CME was seen in STEREO-A/COR2 images on 13 May 09:44 UTC. It became geo-effective on May 16 05:15 UTC.
Another CME seen in SOHO/LASCO images launched on 15 May 08:27 UTC was judged to be two separate CMEs originating from NOAA Active Regions (AR) 3670 and 3664. Both were Earth-directed, although the second was expected to deliver only a glancing blow. The former arrived on 17 May 12:40 UTC, while the glancing blow possibly merged with the CME which arrived on 19 May.
Coronal Holes
No Coronal Hole crossed the central solar meridian were observed during the past week.
Proton flux levels
A long-lasting proton event was registered in GOES-18.
The greater than 10 MeV proton flux data crossed the 10 pfu alert level on 13 May 14:20 UTC and stayed above the threshold until 16 May 14:50 UTC.
Electron fluxes at GEO
The greater than 2 MeV electron flux, as measured by the GOES-18 satellite, increased to levels around the 1000 pfu alert threshold starting from 13 May and lasting until 16 May. It increased again to these levels at the second half of 19 May. The 24h electron fluence increased to moderate levels at 14 May 22:15 UTC and stayed at those levels until 16 May 08:00 UTC. It remained at nominal levels for the rest of the week.
Solar wind
The Earth was under the waning influence of a CME at the start of the week, with the Solar Wind (SW) speed decreasing from 980 km/s to 400 km/s on 16 May. It increased again to 530 km/s at 16 May 05:15 UTC as the result of a CME arrival. However the SW conditions returned to a slow SW regime by the end of the same day. A second CME became geo-effective at 17 May 12:40, with the SW speed increasing to 520 km/s.
The total interplanetary magnetic field (Bt) was around 10 nT at the start of the week and dropped to 5 nT within the first 12 hours. It increased again to 17 nT as a result of the CME arrival on 16 May, but dropped to low levels within a few hours. The second CME arrival on 17 May caused an increase to 17 nT with the disturbance lasting for the rest of the past week.
The North-South component (Bz) fluctuated between -13 and 14 nT as a result of the CME arrival on 16 May. The second CME arrival, of 17 May caused again a fluctuation between -15 and 13 nT for approximately 24 hours.
The interplanetary magnetic field was directed towards the Sun at the time of the CME arrivals. For the rest of the week the magnetic field was directed away from the Sun.
Geomagnetism
The global geomagnetic conditions reached moderate storm levels (NOAA Kp 6- to 6) during the period from 13 May 00:00 UTC to 06:00 UTC. They then dropped to quiet or unsettled levels until the arrival of the CME on 16 May. This caused a moderate storm (NOAA Kp 6 between 06:00-09:00 UTC) and minor storm (NOAA Kp 5- between 09:00-12:00 UTC). The second CME arrival of the week also caused stormy conditions on 17 May with NOAA Kp 5 at 15:00-18:00 UTC, 6 at 18:00-21:00 UTC, and 5+ at 21:00-24:00 UTC. For the remaining of the week the global conditions returned to unsettled to quiet levels.
Locally the conditions followed a very similar pattern, although the disturbances were much milder. More specifically, during the first 3-hours interval the conditions were at active level (K BEL 4 at 00:00-03:00 UTC) and dropped to quiet levels by 06:00 UTC. The CME of 16 May increased the local conditions to only active levels (K BEL 4 06:00-18:00 UTC). The same pastern was seen with the CME arrival of 17 May with minor storm conditions (K BEL 5) between 18:00-21:00 UTC and active conditions (K BEL 4) for six hours before and six hours after the event. The remaining of the past week was dominated by quiet local geomagnetic conditions.
PROBA2 Observations (13 May 2024 - 19 May 2024)
Solar Activity
Solar flare activity fluctuated from low to very high during the week.
In order to view the activity of this week in more detail, we suggest to go to the following website from which all the daily (normal and difference) movies can be accessed: https://proba2.oma.be/ssa
This page also lists the recorded flaring events.
A weekly overview movie (SWAP week 738) can be found here: https://proba2.sidc.be/swap/data/mpg/movies/weekly_movies/weekly_movie_2024_05_13.mp4.
Details about some of this week's events can be found further below.
If any of the linked movies are unavailable they can be found in the P2SC movie repository here: https://proba2.oma.be/swap/data/mpg/movies/.
Tuesday May 14


The largest flare of this week and so far of the current solar cycle was an X8.7, and it was observed by LYRA (top panel) and SWAP (bottom panel). The flare peaked on 2024-May-14 at 16:51 UT. It occurred in the southern hemisphere, just behind the western limb of the Sun (encircled in green), and it originated from NOAA AR3664.
Find a SWAP movie of the event here: https://proba2.sidc.be/swap/movies/20240514_swap_movie.mp4.
Noticeable Solar Events
| DAY | BEGIN | MAX | END | LOC | XRAY | OP | 10CM | TYPE | Cat | NOAA |
| 13 | 0123 | 0133 | 0138 | S20W72 | M1.2 | SF | 86 | 3664 | ||
| 13 | 0806 | 0820 | 0823 | S19W80 | M1.2 | SF | 86 | 3664 | ||
| 13 | 0823 | 0829 | 0833 | S19W80 | M1.4 | SF | 86 | 3664 | ||
| 13 | 0847 | 0933 | 0936 | S21E6 | M4.9 | SF | CTM/1II/2 | 86 | 3664 | |
| 13 | 0848 | 0944 | 1057 | S20W81 | M6.6 | SF | CTM/1II/2IV/2III/2 | 86 | 3664 | |
| 13 | 1256 | 1311 | 1323 | M3.7 | 86 | 3664 | ||||
| 13 | 1732 | 1747 | 1823 | S10E43 | M1.0 | SF | 3 | 3674 | ||
| 13 | 2148 | 2159 | 2207 | M1.5 | III/2 | 86 | 3664 | |||
| 14 | 0203 | 0209 | 0219 | X1.7 | III/2II/2 | 86 | 3664 | |||
| 14 | 1240 | 1255 | 1305 | X1.2 | III/1II/2 | 86 | 3664 | |||
| 14 | 1646 | 1651 | 1702 | X8.7 | IV/1II/2 | 86 | 3664 | |||
| 14 | 1725 | 1738 | 1818 | N19E72 | M4.4 | 2N | II/2III/2 | 3682 | ||
| 15 | 0818 | 0837 | 0852 | X3.4 | III/3VI/3IV/1 | |||||
| 15 | 1356 | 1406 | 1410 | M2.9 | III/1IV/1II/1 | 3685 | ||||
| 15 | 1410 | 1417 | 1420 | M3.2 | III/1IV/1II/1 | 3685 | ||||
| 15 | 1420 | 1438 | 1451 | X2.9 | III/1IV/1II/1 | 3685 | ||||
| 16 | 0750 | 0804 | 0810 | M1.0 | VI/2 | 3685 | ||||
| 17 | 2033 | 2108 | 2126 | S12E62 | M7.2 | 2B | II/2IV/2 | 9 | 3685 | |
| 19 | 1337 | 1344 | 1348 | S10E36 | M1.9 | 1N | III/3 | 10 | 3685 | |
| 19 | 1747 | 1756 | 1800 | S10E34 | M2.5 | 1B | III/3 | 10 | 3685 | |
| 19 | 2153 | 2159 | 2203 | S9E34 | M1.6 | 1N | III/2 | 10 | 3685 |
| LOC: approximate heliographic location | TYPE: radio burst type |
| XRAY: X-ray flare class | Cat: Catania sunspot group number |
| OP: optical flare class | NOAA: NOAA active region number |
| 10CM: peak 10 cm radio flux |
International Sunspot Number by SILSO
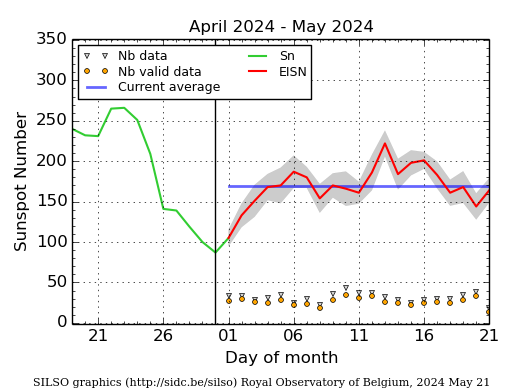
The daily Estimated International Sunspot Number (EISN, red curve with shaded error) derived by a simplified method from real-time data from the worldwide SILSO network. It extends the official Sunspot Number from the full processing of the preceding month (green line), a few days more than one solar rotation. The horizontal blue line shows the current monthly average. The yellow dots give the number of stations that provided valid data. Valid data are used to calculate the EISN. The triangle gives the number of stations providing data. When a triangle and a yellow dot coincide, it means that all the data is used to calculate the EISN of that day.
Geomagnetic Observations in Belgium
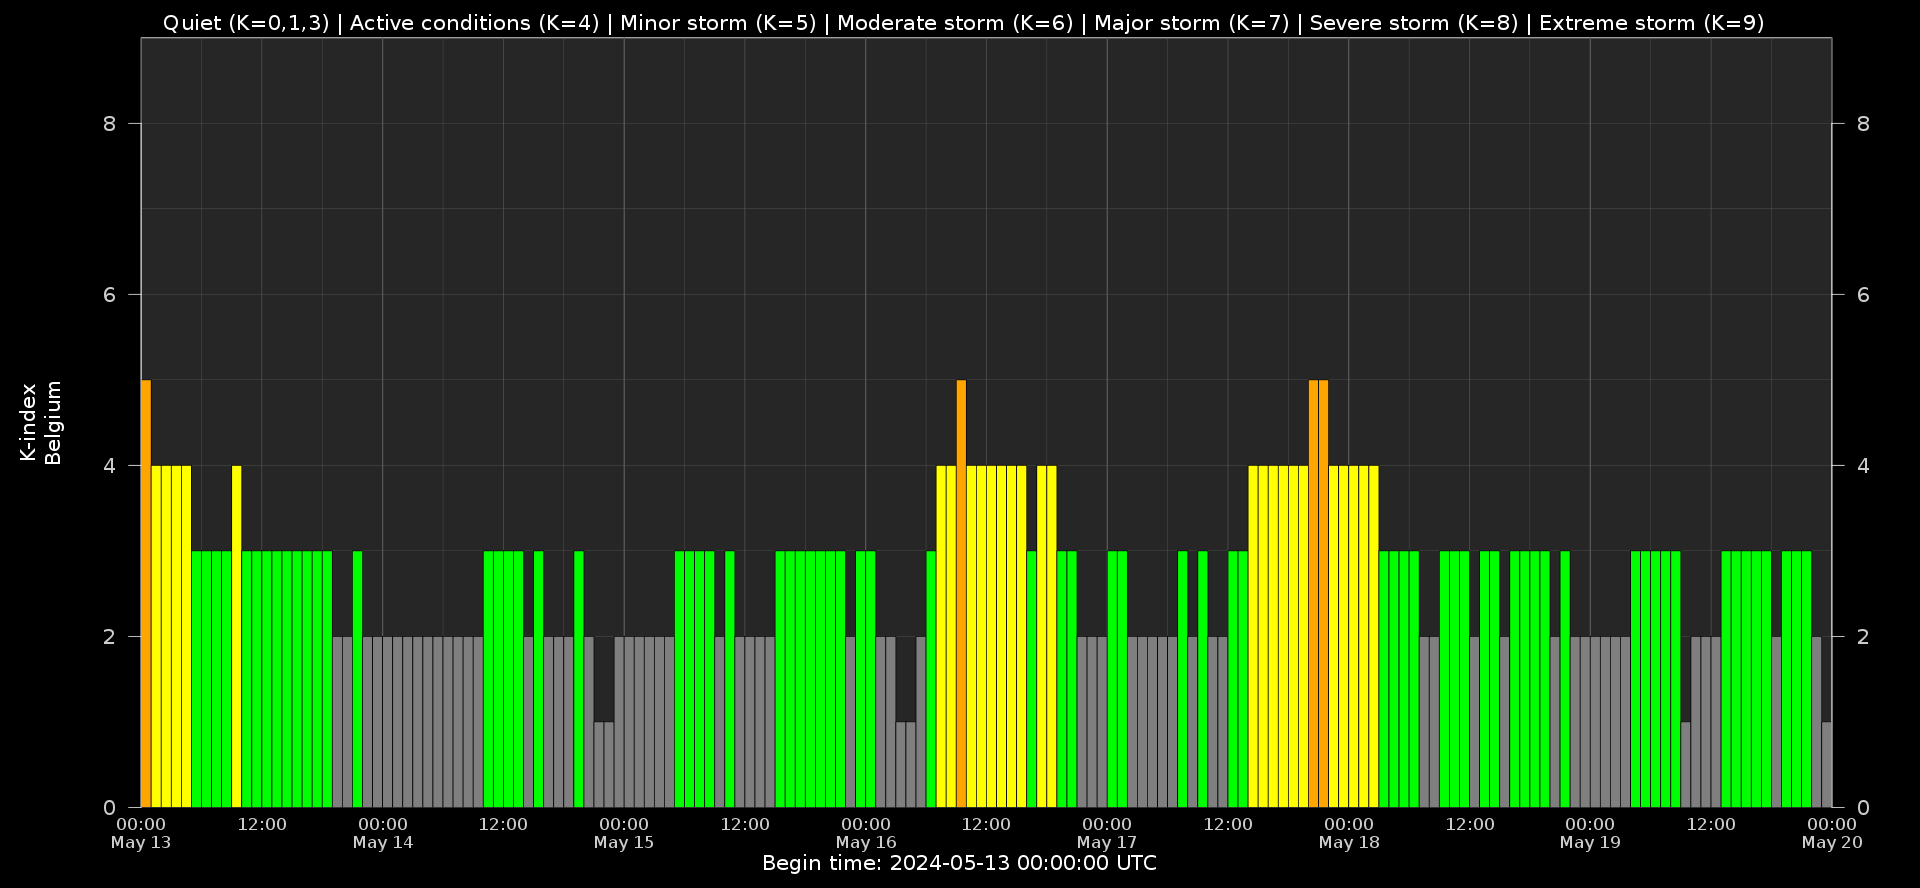
Local K-type magnetic activity index for Belgium based on data from Dourbes (DOU) and Manhay (MAB). Comparing the data from both measurement stations allows to reliably remove outliers from the magnetic data. At the same time the operational service availability is improved: whenever data from one observatory is not available, the single-station index obtained from the other can be used as a fallback system.
Both the two-station index and the single station indices are available here: http://ionosphere.meteo.be/geomagnetism/K_BEL/
The SIDC Space Weather Briefing
The forecaster on duty presented the SIDC briefing that gives an overview of space weather from May 12 to 19.
The pdf of the presentation can be found here: https://www.stce.be/briefings/20240520_SWbriefing.pdf
Review of Ionospheric Activity
NEW! The time series below illustrates (in green) the VTEC deviation from normal quiet behaviour.


VTEC time series at 3 locations in Europe from 13 May 2024 till 19 May 2024
The top figure shows the time evolution of the Vertical Total Electron Content (VTEC) (in red) during the last week at three locations:
a) in the northern part of Europe(N 61deg E 5deg)
b) above Brussels(N 50.5deg, E 4.5 deg)
c) in the southern part of Europe(N 36 deg, E 5deg)
This top figure also shows (in grey) the normal ionospheric behaviour expected based on the median VTEC from the 15 previous days.
The time series below shows the VTEC difference (in green) and relative difference (in blue) with respect to the median of the last 15 days in the North, Mid (above Brussels) and South of Europe. It thus illustrates the VTEC deviation from normal quiet behaviour.
The VTEC is expressed in TECu (with TECu=10^16 electrons per square meter) and is directly related to the signal propagation delay due to the ionosphere (in figure: delay on GPS L1 frequency).
The Sun's radiation ionizes the Earth's upper atmosphere, the ionosphere, located from about 60km to 1000km above the Earth's surface.The ionization process in the ionosphere produces ions and free electrons. These electrons perturb the propagation of the GNSS (Global Navigation Satellite System) signals by inducing a so-called ionospheric delay.
See http://stce.be/newsletter/GNSS_final.pdf for some more explanations; for more information, see https://gnss.be/SpaceWeather
STCE courses and seminars
Courses and presentations with the Sun-Space-Earth system and Space Weather as the main theme. We provide occasions to get submerged in our world through educational, informative and instructive activities.
* May 28, Solar physics and Space Weather: Solar Orbiter Spacecraft, online course - Registrations are open
* June 4, STCE seminar, title TBC
* June 7, STCE seminar, Ground level enhancements: probing conditions of the geospace environment
* June 9, Public presentation Total Eclipse of the Sun, Helios, Averbode, Belgium
* June 13, STCE seminar, Solar Prominence Eruptions: Insights from UV Imaging with EUI/FSI
* June 25, Solar physics and Space Weather: predictions and services, online course - Registrations are open
* June 27, STCE annual meeting, Brussels, Belgium
* June 28, public presentation Help! Het stormt in de ruimte!?, Wetenschappelijke middagen, Brussels, Belgium
To register for a course or lecture, check the page of the STCE Space Weather Education Center: https://www.stce.be/SWEC
If you want your event in the STCE newsletter, contact us: stce_coordination at stce.be
