- Table of Content
- 1.A bit of every...
- 2.Preparing for ...
- 3.International ...
- 4.PROBA2 Observa...
- 5.Noticeable Sol...
- 6.Geomagnetic Ob...
- 7.Review of Iono...
- 8.Upcoming Activ...
2. Preparing for launch
3. International Sunspot Number by SILSO
4. PROBA2 Observations
5. Noticeable Solar Events
6. Geomagnetic Observations in Belgium
7. Review of Ionospheric Activity
8. Upcoming Activities
A bit of everything
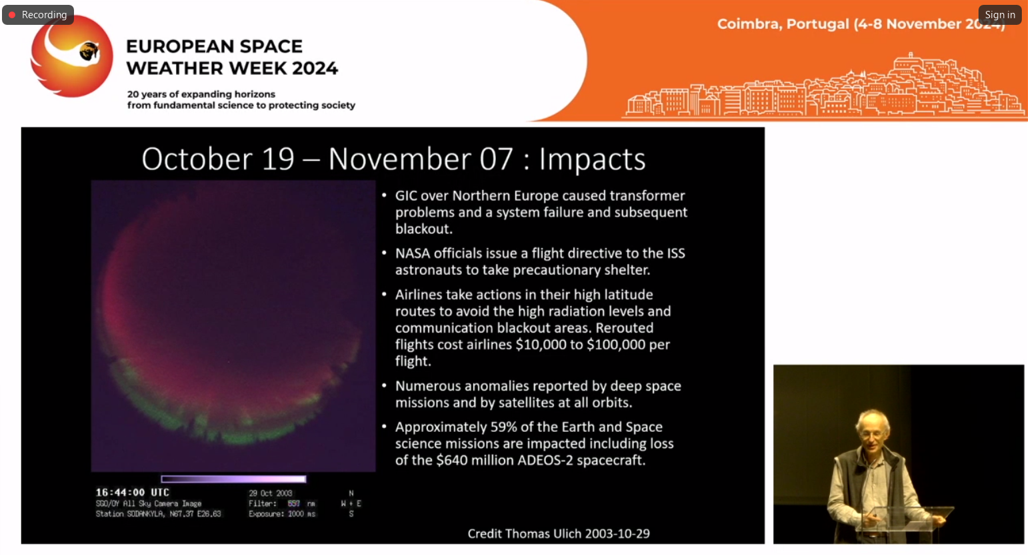
This week (4-8 November), the European Space Weather Week is taking place. This is the 20th edition, taking place in Coimbra, Portugal. There are close to 700 registrations (online and onsite) ranging from scientists, service providers to end users, and from countries all over the world. Take a look at the website at https://esww2024.org/ The screenshot underneath shows Jean Lilensten during his keynote lecture on 20 years evolution of space weather and space climate.
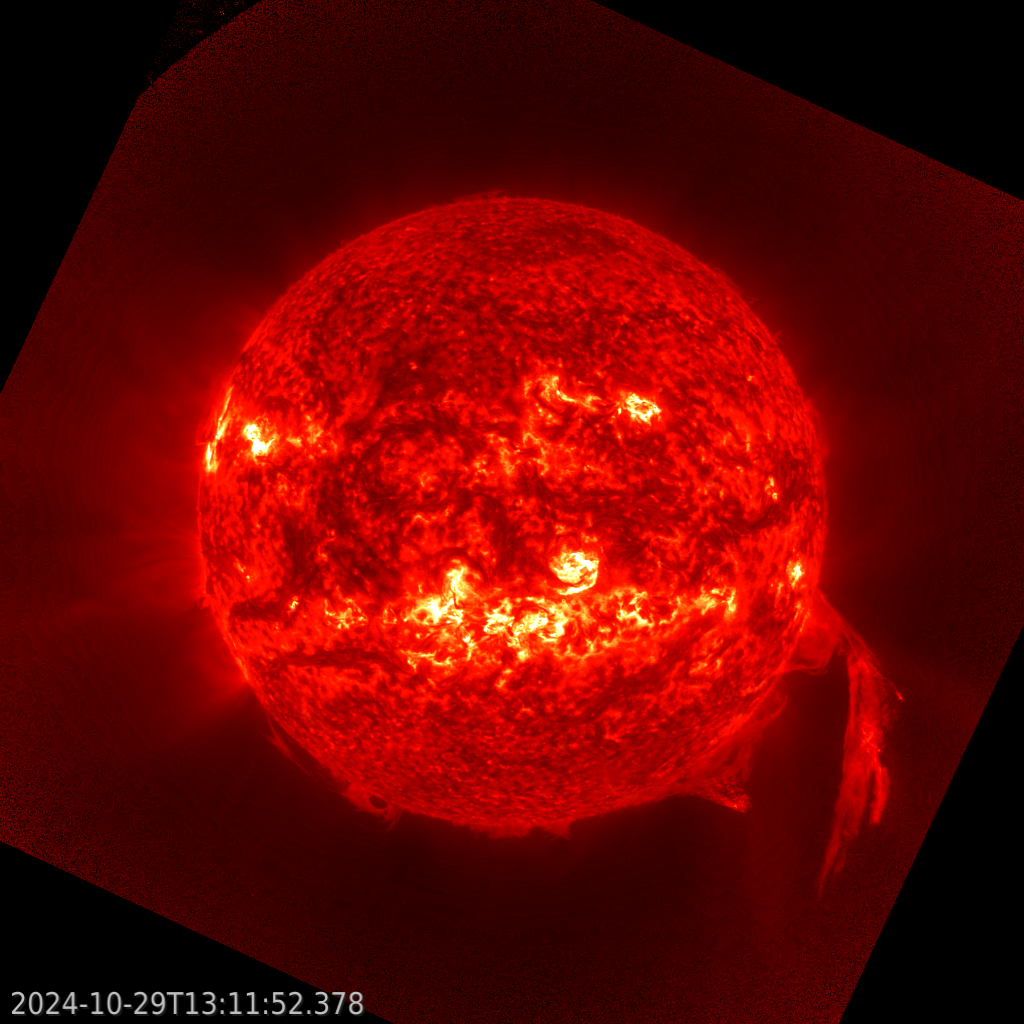
One of the highlight's of last week's solar activity was the eruption of a large prominence from the southwest solar limb on 29 October. Amateur solar observers were able to follow the erupting prominence up to 500.000 km above the solar surface, that is 1.5 times the Earth-Moon distance. The (enhanced) image underneath was made by GOES/SUVI 304 showing the Sun at temperatures around 80.000 degrees.
On 22 October, NOAA shared the first images from the Compact Coronagraph (CCOR-1), a powerful solar telescope onboard the new GOES-19 satellite. CCOR-1 began observing the Sun's corona, the faint outermost layer of the solar atmosphere, on 19 September 2024. GOES-19 is currently undergoing post-launch testing and checkout of its instruments and systems, but expectations are it will be assigned the operational role as NOAA's GOES East satellite in spring 2025. CCOR is the much-needed back-up and future replacement for the aging SOHO/LASCO coronagraphs, which will be 30 years old next year... The image underneath shows a coronal mass ejection on 29 September (upper left), with a movie and additional information at https://www.nesdis.noaa.gov/news/noaa-shares-imagery-worlds-first-operational-space-based-coronagraph

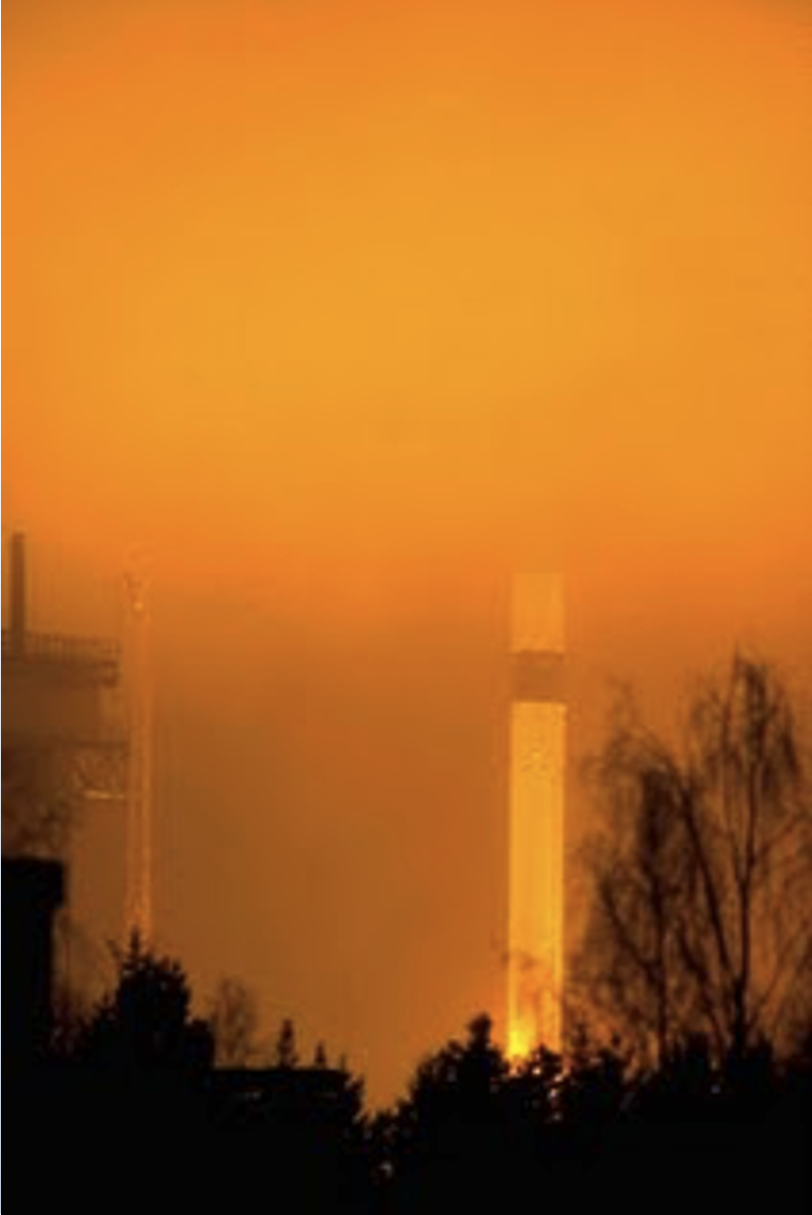
And last but not least, PROBA2 (https://proba2.sidc.be/ ) - ESA micro-satellite to which also Belgium contributed- celebrated its 15th anniversary last weekend. Indeed, PROBA2 was launched from the Russian launch base Plesetsk on 2 November 2009 (image underneath). On 14 December, there was the first light of the SWAP instrument (extreme ultraviolet camera) and LYRA (instrument to observe the intensity of solar flares) followed in January 2010. SWAP has a wide field of view and so is excellent to track large eruptions and coronal features. LYRA, aside being an excellent research tool, is e.g. also an excellent back-up for GOES soft x-ray measurements, for example during eclipse season.
Preparing for launch
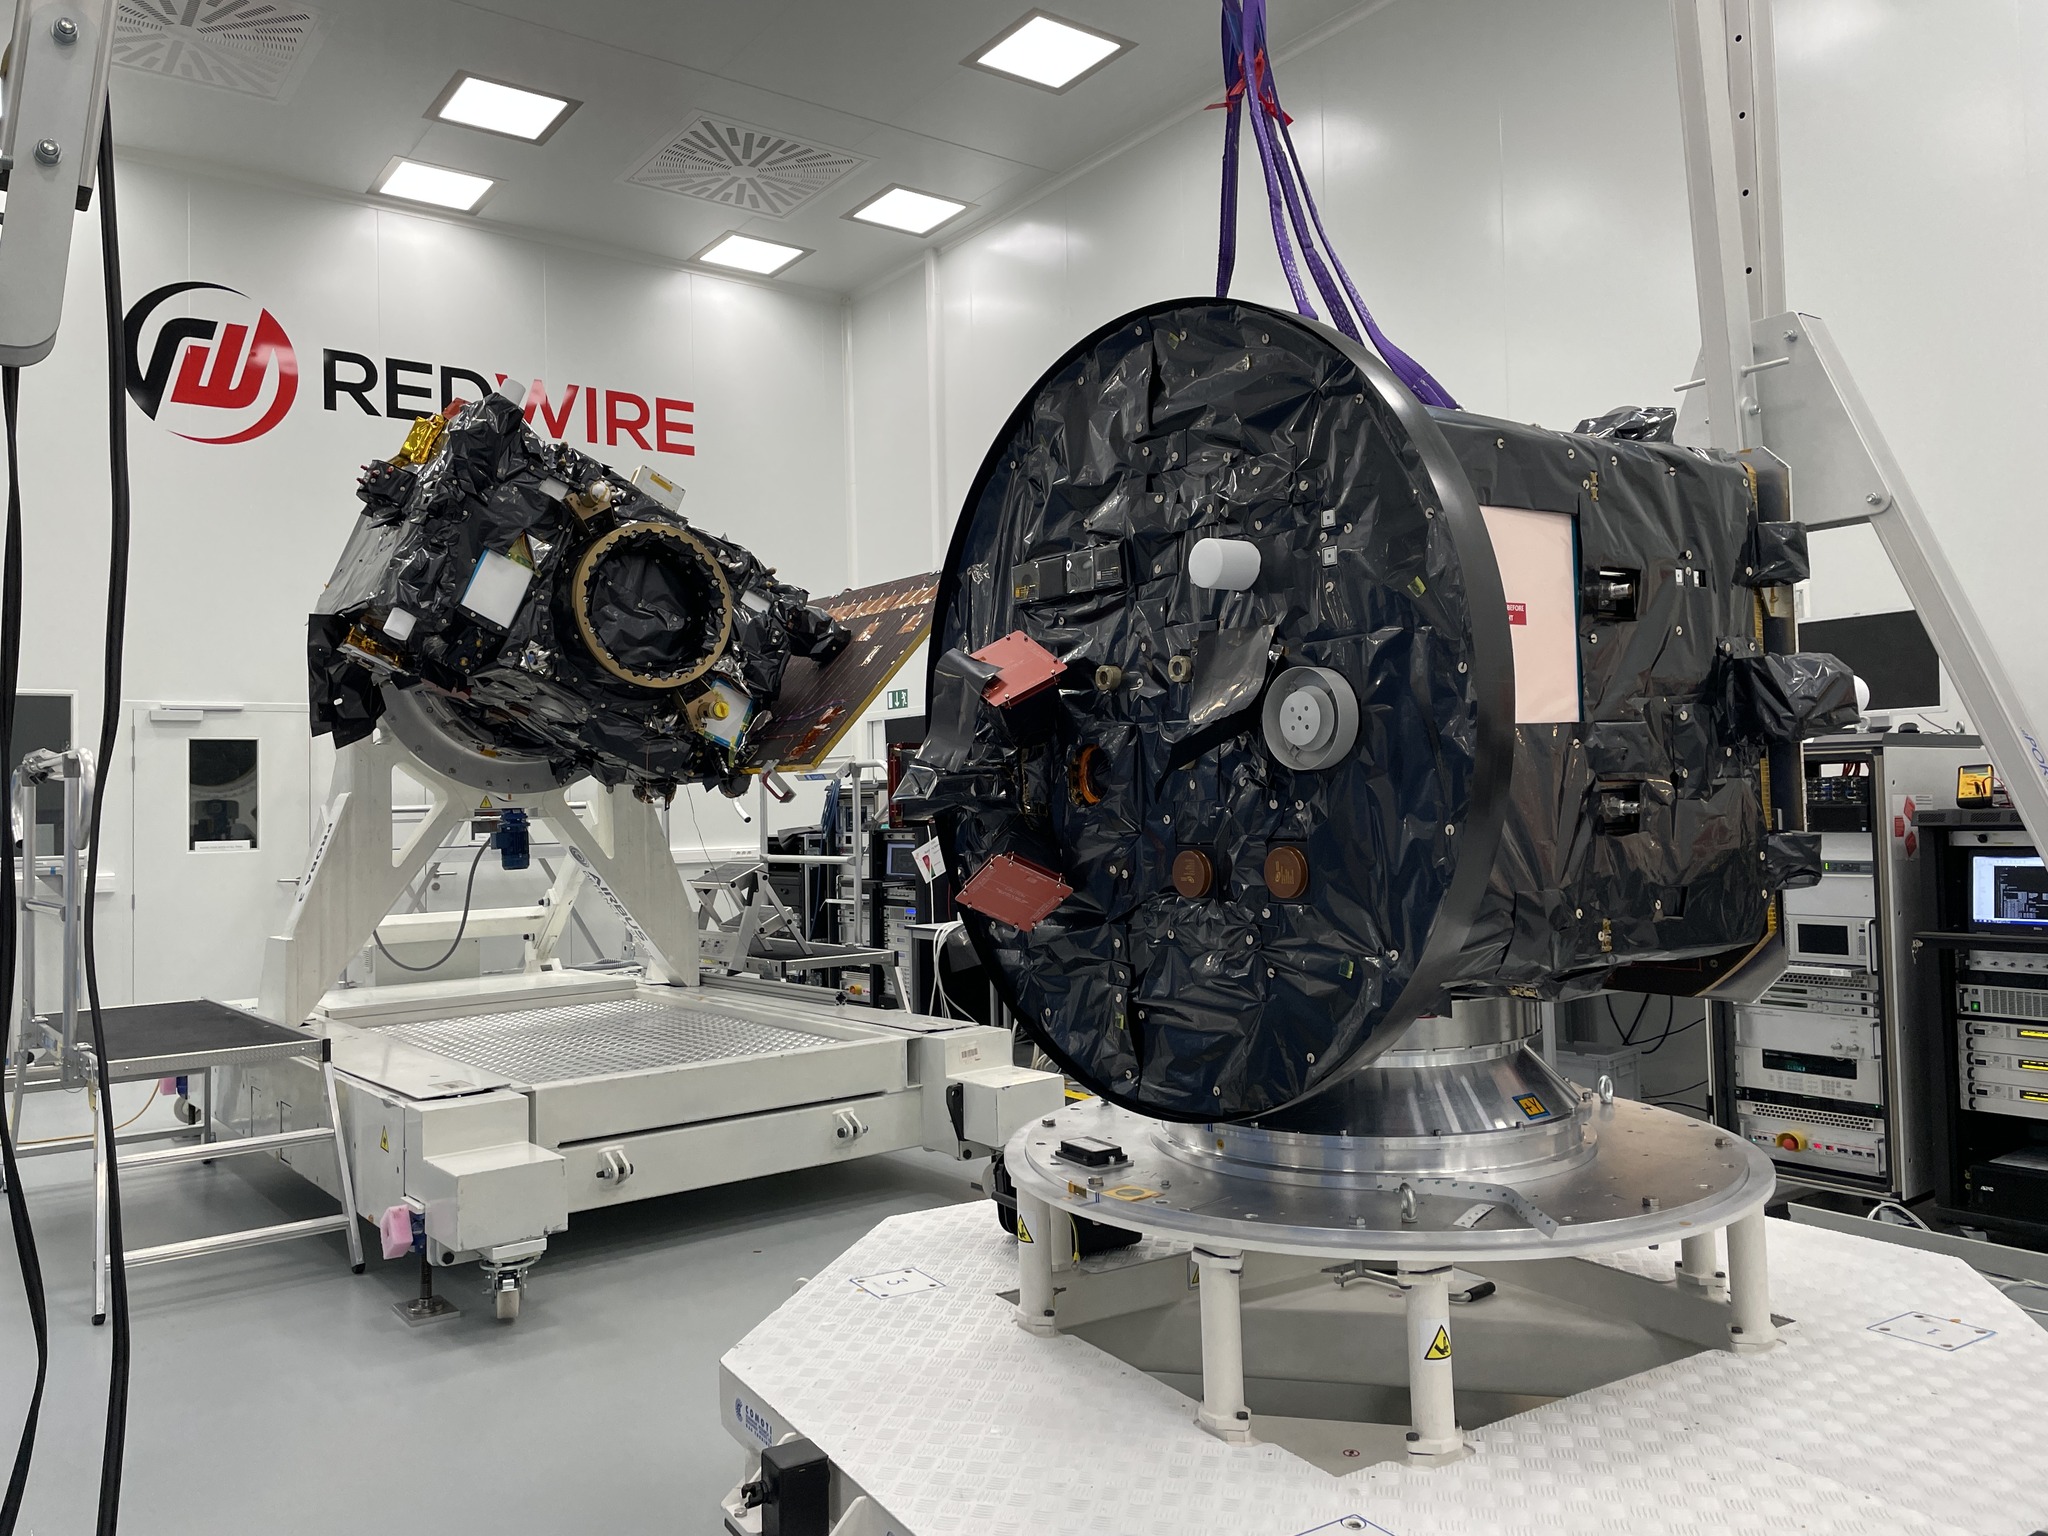
Good news from the Proba-3 front!
After a small delay due to problems with transport, the two satellites finally made it to India. They landed safely on November 5 to be transported to the launch site in Chennai. There, the final preparations for launch are ongoing. Currently the launch of Proba-3 is planned for December 4.
The Proba-3 mission is a solar eclips maker and an exercise in very precise formation flying. It's main instrument, ASPIICS will observe the solar corona very to the solar rim. The Proba-3 science center is hosted by the STCE and many of our scientists will travel to India to see the satellites off.
Stay tuned for more updates on the launch and first observations.
International Sunspot Number by SILSO
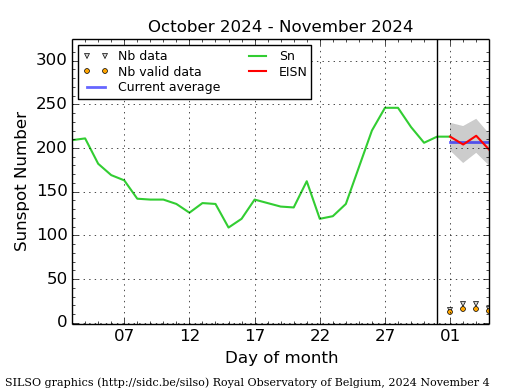
The daily Estimated International Sunspot Number (EISN, red curve with shaded error) derived by a simplified method from real-time data from the worldwide SILSO network. It extends the official Sunspot Number from the full processing of the preceding month (green line), a few days more than one solar rotation. The horizontal blue line shows the current monthly average. The yellow dots give the number of stations that provided valid data. Valid data are used to calculate the EISN. The triangle gives the number of stations providing data. When a triangle and a yellow dot coincide, it means that all the data is used to calculate the EISN of that day.
PROBA2 Observations
Solar Activity
Solar flaring activity fluctuated from moderate to high during the week.
In order to view the activity of this week in more detail, we suggest to go to the following website from which all the daily (normal and difference) movies can be accessed: https://proba2.oma.be/ssa
This page also lists the recorded flaring events.
A weekly overview movie (SWAP week 762) can be found here: https://proba2.sidc.be/swap/data/mpg/movies/weekly_movies/weekly_movie_2024_10_28.mp4.
Details about some of this week's events can be found further below.
If any of the linked movies are unavailable they can be found in the P2SC movie repository here: https://proba2.oma.be/swap/data/mpg/movies/.
Thursday October 31
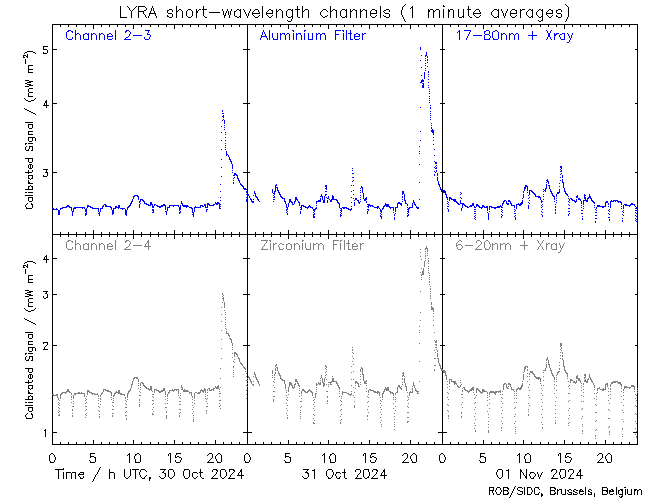
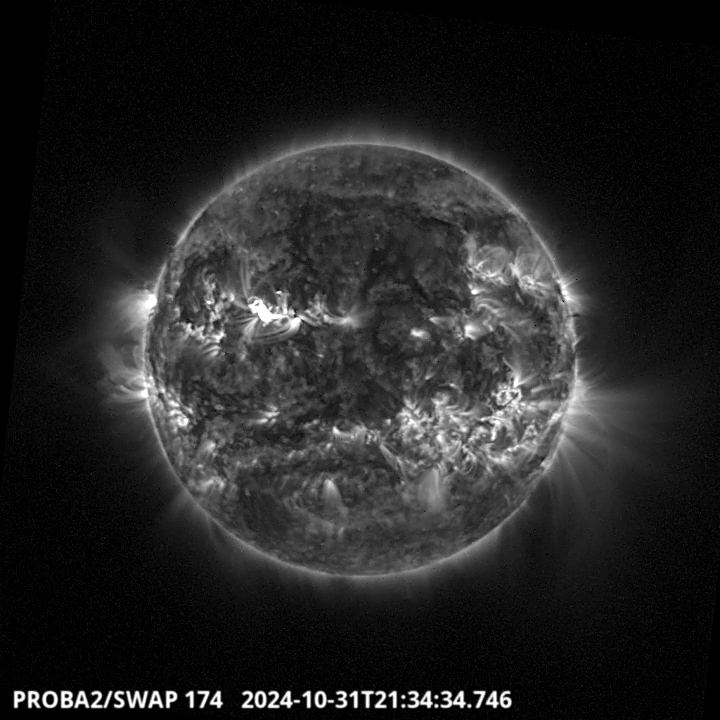
The largest flare of this week was an X2.0, and it was observed by LYRA (top panel) and SWAP (bottom panel). The flare peaked on 2024-Oct-31 at 21:20 UT. It occurred in the north-eastern quadrant, originating from active region NOAA3878.
Find a SWAP movie of the event here: https://proba2.sidc.be/swap/movies/20241031_swap_movie.mp4.
Noticeable Solar Events
| DAY | BEGIN | MAX | END | LOC | XRAY | OP | 10CM | TYPE | Cat | NOAA |
| 28 | 0359 | 0409 | 0416 | M1.3 | 78 | 3878 | ||||
| 28 | 1441 | 1444 | 1448 | M1.2 | 74 | 3869 | ||||
| 28 | 1613 | 1628 | 1644 | N16E67 | M4.2 | 1F | 78 | 3878 | ||
| 29 | 1621 | 1633 | 1641 | S9E9 | M1.1 | 1F | 76 | 3873 | ||
| 30 | 2029 | 2053 | 2114 | M7.2 | 78 | 3878 | ||||
| 31 | 0323 | 0330 | 0337 | N15E36 | M1.0 | SF | 78 | 3878 | ||
| 31 | 0922 | 0937 | 0956 | N17E36 | M1.3 | SF | 78 | 3878 | ||
| 31 | 1241 | 1254 | 1303 | N27W35 | M2.4 | 1 | III/2 | 73 | 3875 | |
| 31 | 1346 | 1359 | 1411 | S9W38 | M1.2 | SF | 72 | 3876 | ||
| 31 | 0216 | 0252 | 0323 | N15E36 | M1.0 | SF | 78 | 3878 | ||
| 31 | 1857 | 1907 | 1918 | S11W44 | M1.0 | 2 | III/1 | 72 | 3876 | |
| 31 | 2103 | 2110 | 2112 | M4.6 | 78 | 3878 | ||||
| 31 | 2112 | 2120 | 2127 | N18E24 | X2.0 | 3 | 78 | 3878 | ||
| 01 | 0205 | 0216 | 0220 | N17E27 | M1.3 | SF | 78 | 3878 | ||
| 01 | 0946 | 1014 | 1108 | M1.0 | 72 | 3876 | ||||
| 01 | 1239 | 1252 | 1300 | M1.3 | 72 | 3876 | ||||
| 01 | 1418 | 1431 | 1442 | N16E16 | M2.0 | 1 | CTM/1 | 78 | 3878 | |
| 02 | 0727 | 0738 | 0753 | S20W50 | M1.0 | SN | 74 | 3869 | ||
| 02 | 0813 | 0831 | 0845 | S14W62 | M1.2 | SF | III/1CTM/2 | 72 | 3876 | |
| 03 | 0302 | 0311 | 0316 | S15W61 | M1.1 | SF | III/1VI/2 | 74 | 3869 | |
| 03 | 0839 | 0849 | 0911 | N15W6 | M1.1 | 1F | 78 | 3878 | ||
| 03 | 1511 | 1524 | 1529 | M1.4 | 74 | 3869 | ||||
| 03 | 1738 | 1753 | 1758 | M1.3 | 3883 |
| LOC: approximate heliographic location | TYPE: radio burst type |
| XRAY: X-ray flare class | Cat: Catania sunspot group number |
| OP: optical flare class | NOAA: NOAA active region number |
| 10CM: peak 10 cm radio flux |
Geomagnetic Observations in Belgium
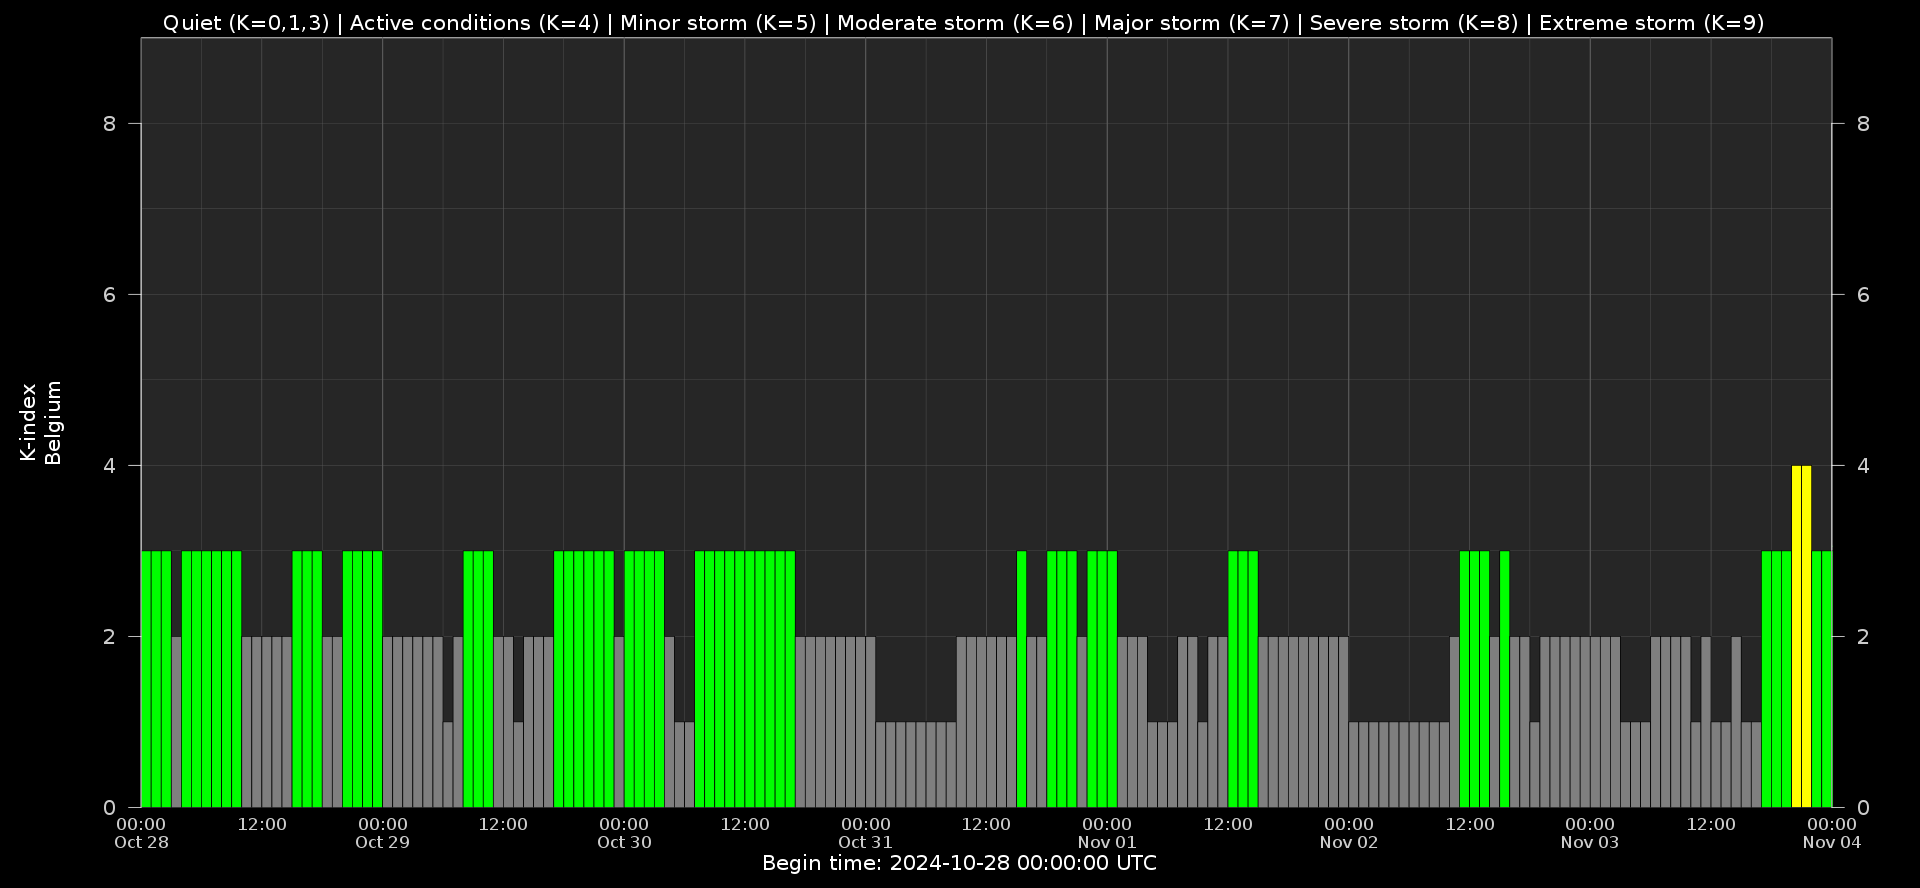
Local K-type magnetic activity index for Belgium based on data from Dourbes (DOU) and Manhay (MAB). Comparing the data from both measurement stations allows to reliably remove outliers from the magnetic data. At the same time the operational service availability is improved: whenever data from one observatory is not available, the single-station index obtained from the other can be used as a fallback system.
Both the two-station index and the single station indices are available here: http://ionosphere.meteo.be/geomagnetism/K_BEL/
Review of Ionospheric Activity


VTEC time series at 3 locations in Europe from 28 Oct 2024 till 3 Nov 2024
The top figure shows the time evolution of the Vertical Total Electron Content (VTEC) (in red) during the last week at three locations:
a) in the northern part of Europe(N 61deg E 5deg)
b) above Brussels(N 50.5deg, E 4.5 deg)
c) in the southern part of Europe(N 36 deg, E 5deg)
This top figure also shows (in grey) the normal ionospheric behaviour expected based on the median VTEC from the 15 previous days.
The time series below shows the VTEC difference (in green) and relative difference (in blue) with respect to the median of the last 15 days in the North, Mid (above Brussels) and South of Europe. It thus illustrates the VTEC deviation from normal quiet behaviour.
The VTEC is expressed in TECu (with TECu=10^16 electrons per square meter) and is directly related to the signal propagation delay due to the ionosphere (in figure: delay on GPS L1 frequency).
The Sun's radiation ionizes the Earth's upper atmosphere, the ionosphere, located from about 60km to 1000km above the Earth's surface.The ionization process in the ionosphere produces ions and free electrons. These electrons perturb the propagation of the GNSS (Global Navigation Satellite System) signals by inducing a so-called ionospheric delay.
See http://stce.be/newsletter/GNSS_final.pdf for some more explanations; for more information, see https://gnss.be/SpaceWeather
Upcoming Activities
NEW - NEW - NEW: Courses for 2025 have been added
Courses, seminars and presentations with the Sun-Space-Earth system and Space Weather as the main theme. We provide occasions to get submerged in our world through educational, informative and instructive activities.
* Nov 4-8, 2024, European Space Weather Week, Coimbra, Portugal, https://esww2024.org/
* Dec 5-6, 2024, STCE Course Space Weather impacts on aviation, online - full
* Jan 28-30, 2025, Role of the ionosphere and space weather in military communications, Brussels, Belgium - register: https://events.spacepole.be/event/208/
* Mar 17-18, 2025, Inleiding tot het ruimteweer, enkel voor leden van volkssterrenwachten, Brussels, Belgium - register: https://events.spacepole.be/event/213/
* Mar 24, 2025, STCE Lecture From Physics to Forecasting, ESA Academy's Space Weather Training Course
* April 28-30, 2025, STCE Space Weather Introductory Course, Brussels, Belgium - register: https://events.spacepole.be/event/214/
* May 26-27, 2025, STCE Course Space Weather impacts on aviation, online - register: https://events.spacepole.be/event/215/
* Jun 23-25, 2025, STCE Space Weather Introductory Course, Brussels, Belgium - register: https://events.spacepole.be/event/216/
* Sep 15-16, 2025, STCE Course Space Weather impacts on aviation, online - register: https://events.spacepole.be/event/218/
* Nov 17-19, 2025, STCE Space Weather Introductory Course, Brussels, Belgium - register: https://events.spacepole.be/event/217/
To register for a course and check the seminar details, surf to the STCE Space Weather Education Center: https://www.stce.be/SWEC
If you want your event in the STCE newsletter, contact us: stce_coordination at stce.be
Website: https://www.stce.be/SWEC