- Table of Content
- 1.GOES-19/CCOR-1
- 2.Review of spac...
- 3.Noticeable Sol...
- 4.International ...
- 5.Geomagnetic Ob...
- 6.The SIDC Space...
- 7.Review of Iono...
- 8.STCE courses a...
2. Review of space weather
3. Noticeable Solar Events
4. International Sunspot Number by SILSO
5. Geomagnetic Observations in Belgium
6. The SIDC Space Weather Briefing
7. Review of Ionospheric Activity
8. STCE courses and lectures
GOES-19/CCOR-1
Coronal mass ejections (CMEs) are large magnetic clouds filled with charged particles that are billowed away from the Sun. If these CMEs reach Earth, they can trigger geomagnetic storms which manifest themselves in the appearance of aurorae and may impact technologies such as satellites or power grids. To keep an eye on the size, speed and direction of these CMEs, some satellites have been equipped with a coronagraph. This is an instrument that creates an artificial, continuous eclipse of the Sun in white light thus revealing the Sun's much fainter nearby environment and any disturbances (in casu a CME) that may travel through the Sun's outer atmosphere (the "corona") and into the heliosphere.
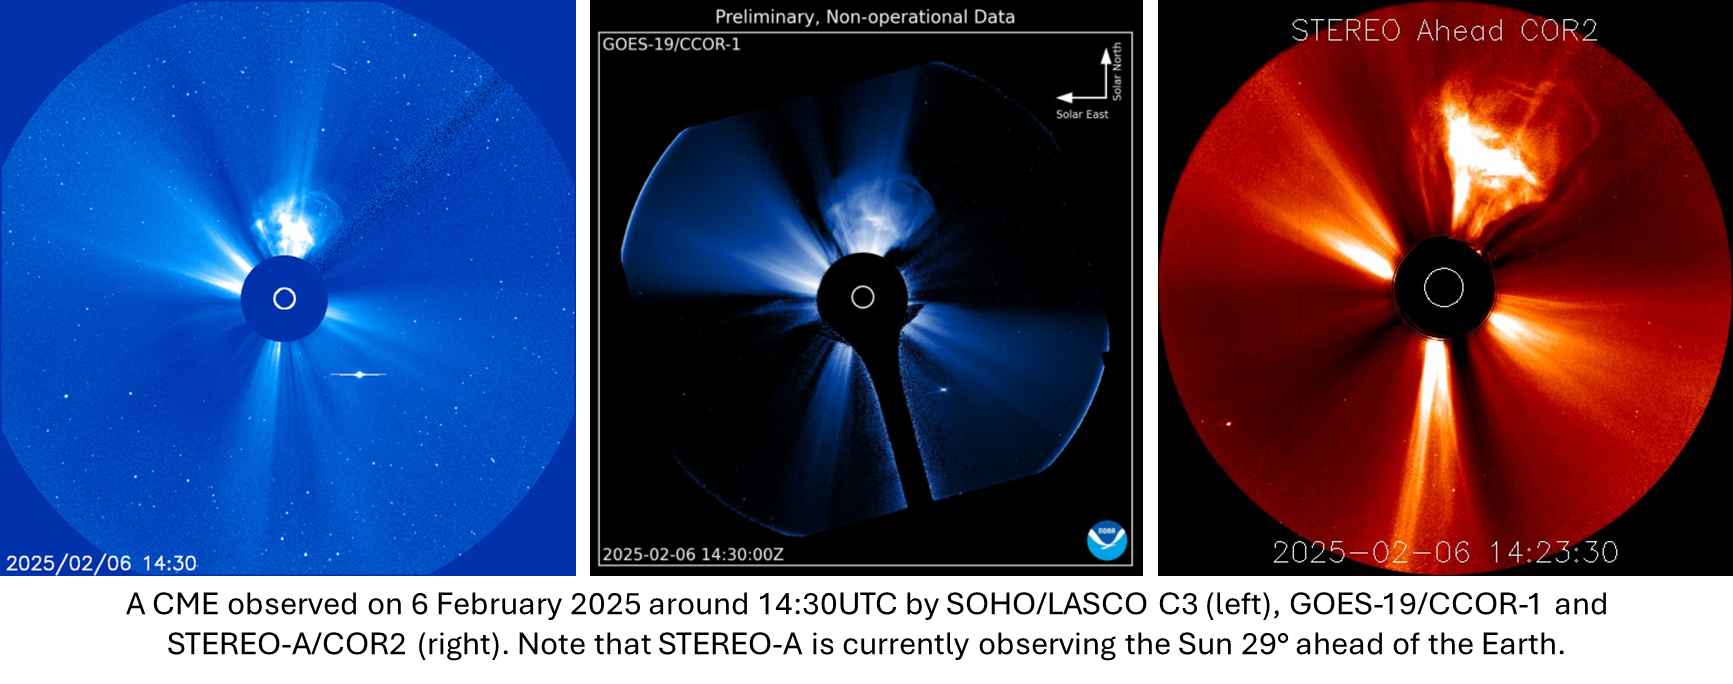
The space weather community is currently using two satellites on an almost daily base for coronagraphic images: SOHO with 2 coronagraphs still operational (LASCO-C2 and -C3), and the STEREO-A satellite also with 2 coronagraphs operational (COR-1 and COR-2). These instruments are still working flawlessly despite being close to their resp. 30th and 20th anniversary. Having exceeded their life expectancy by so many years, there's of course an increasing risk on a sudden breakdown of these instruments and satellites. This would leave the SWx community without the critical coronagraphic imagery. To alleviate this pressing problem, the CCOR-1 instrument was developed and launched on board the GOES-19 on 25 June 2024. CCOR -short for Compact CORonagraph- will be on every future GOES as well. The field of view for CCOR-1 spans from 3.7 solar radii out to 17 solar radii with a spatial resolution of about 50 arcseconds. Preliminary, non-operational images of the GOES-19/CCOR-1 are now available as an animation at the NOAA/SWPC's testbed at https://testbed.spaceweather.gov/products/ccor-1-coronagraph , and will be moved to https://spaceweather.gov/products/ccor-1-coronagraph-experimental on or about 24 February 2025.
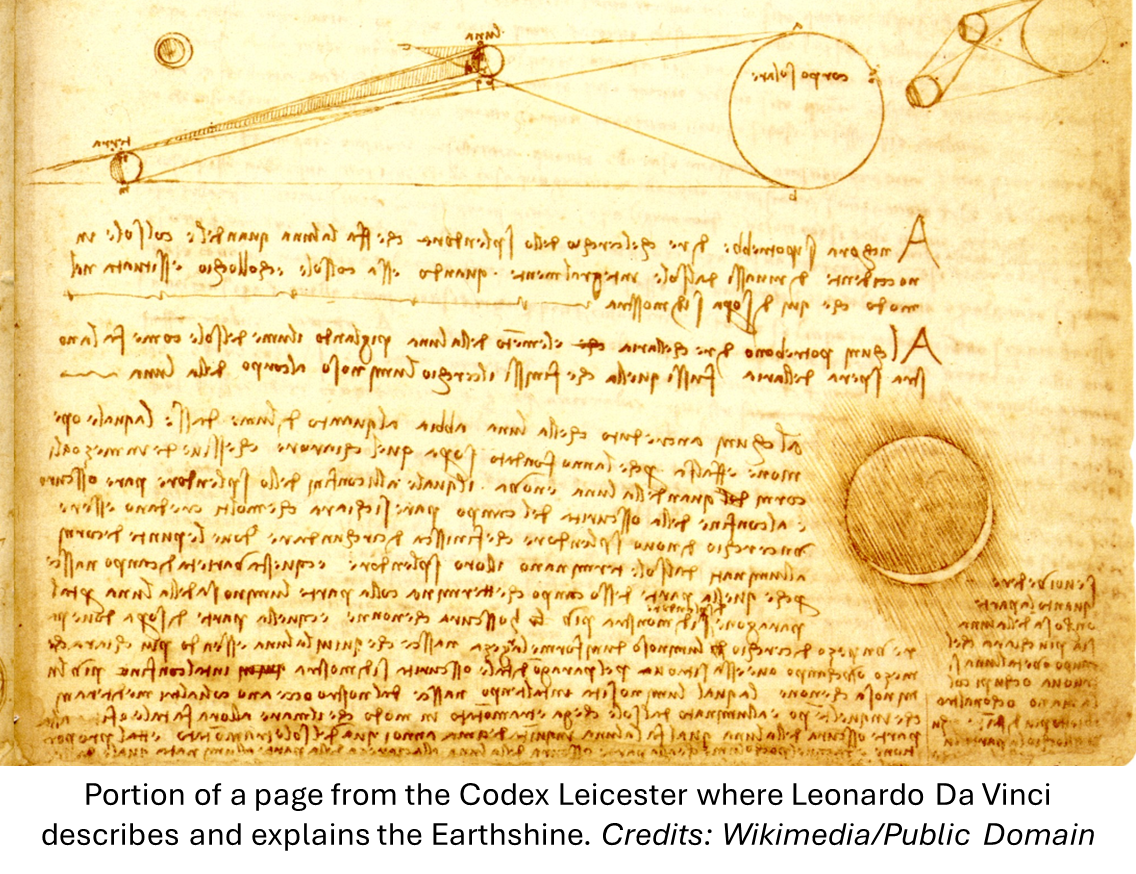
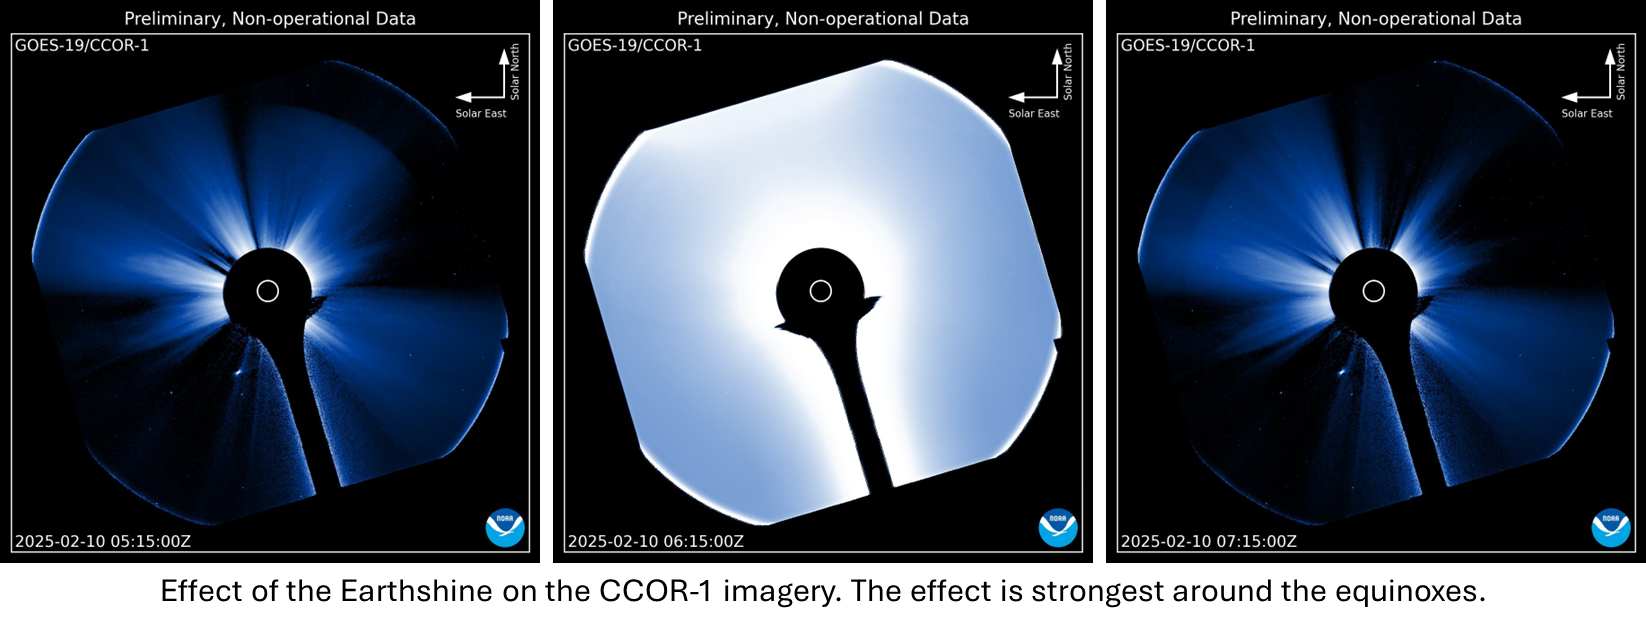
CCOR-1 is the first coronagraph to fly in a geostationary orbit around Earth, and this leads to a number of unique features to its observations. For example, SOHO's coronagraphs have observed from the Lagrange-1 point ("L1 point"), 1.5 million kilometers away from Earth in the direction of the Sun. The STEREO-A coronagraphs have observed the Sun from a heliocentric orbit inside Earth's orbit. Both these orbits are well beyond that of the Moon. Since CCOR-1 rides on the GOES-19 satellite, well within the Moon's orbit, the Moon sometimes makes appearances in the field of view. Another consequence of its proximity to Earth is sunlight that is reflected from the Earth's natural albedo (e.g. clouds, snow, ice, oceans, etc.) can impact CCOR-1 observations. This reflected sunlight is called Earthshine and was first described by none other than Leonardo Da Vinci from his observations of the Moon ca. 1510 (see Kraus 2021 - https://iopscience.iop.org/article/10.1088/1361-6404/abe8e4 ) ; Codex Leicester - https://en.wikipedia.org/wiki/Codex_Leicester ; see the image and caption above). Earthshine impacts CCOR-1 observations primarily during sunrise hours (as shown below) and the degree of the impact depends on the time of year. The effects are most pronounced around the equinoxes in March and September and gradually decay into the solstices. Scientists are working to mitigate this Earthshine effect. Further fascinating details are on the NOAA/SWPC testbed webpage (https://testbed.spaceweather.gov/products/ccor-1-coronagraph).
Review of space weather
Solar Active Regions (ARs) and flares
Solar flaring activity ranged from moderate to high. Fourteen (14) active regions were observed on the side of the sun facing Earth. The largest were SIDC Sunspot Groups 360 (NOAA Active Region 3978) and 391 (NOAA Active Region 3981). Both exhibited beta-gamma-delta configurations indicating a complex magnetic configuration. Together with SIDC Sunspot Groups 368 (NOAA Active Region 3977) and 388 (NOAA Active Region 3976), these regions were the primary drivers of most of the flaring activity. Towards the end of the week, this cluster of active regions began rotating out of view over the west limb. The largest flare was an M8.8 (SIDC Flare 3465), peaking at 03:58 UTC on February 03 and was associated with SIDC Sunspot Group 391 (NOAA Active Region 3981).
Coronal mass ejections
Several coronal mass ejections (CMEs) were detected, most of which were not expected to impact Earth.
On February 02, two halo CMEs were observed in LASCO/C2 coronagraph data at 05:36 UTC and 21:24 UTC, directed primarily south/southwest from Earth's perspective. Both CMEs had no clear on-disk signatures and were deemed to be back-sided, so no impact on Earth's solar wind environment was anticipated.
A faint CME was also observed at 23:24 UTC on February 02, directed primarily to the east from Earth's perspective. The CME was likely associated with an M4.1 flare from SIDC Sunspot Group 391 (NOAA Active Region 3981). While the bulk of the ejecta was expected to miss Earth, a glancing blow was expected in the second half of February 06. The ICME probably arrived around 06:24 UTC on February 07.
A filament near S29W48 erupted around 23:45 UTC on February 04. The associated CME was visible in SOHO/LASCO-C2 imagery from 02:12 UTC on February 05, directed primarily to the southwest from Earth's perspective. The CME was expected to miss Earth.
Finally, on February 08 at 10:12 UTC, a faint and slow CME was detected in LASCO/C2 data, directed primarily westward. It was likely associated with an M2.0 flare (SIDC Flare 3554) from SIDC Sunspot Group 391 (NOAA AR 3981). This CME was very faint, not clearly visible in STEREO A COR2, and was not expected to impact Earth.
Coronal Holes
The returning equatorial negative polarity coronal hole (SIDC Coronal Hole 88) began to cross the central meridian on February 06. An associated high-speed stream arrived at Earth late on February 08. A recurrent low-latitude, negative-polarity coronal hole (SIDC Coronal Hole 87) began to cross the central meridian on February 09. An associated high-speed stream was expected to arrive at Earth late on February 12.
Proton flux levels
The greater than 10 MeV GOES proton flux remained at nominal levels throughout the week.
Electron fluxes at GEO
The greater than 2-MeV electron flux measured by the GOES-16 satellite, remained below the 1000 pfu threshold, except during a short interval on February 02 when it slightly exceeded the threshold. The greater than 2 MeV electron flux measured by the GOES-18 satellite, stayed below the 1000 pfu threshold. The 24-hour electron fluence remained normal.
Solar wind
At the beginning of the week, the solar wind parameters reflected the waning influence of a high-speed stream from Coronal Hole 82 (an equatorial, positive polarity coronal hole) and Coronal Hole 60 (a mid-latitude, positive polarity coronal hole), which crossed the central meridian between January 28 and February 01. The interplanetary magnetic field reached 11 nT, while the solar wind speed decreased from about 650 km/s to 400 km/s. Around 06:00 UTC on February 07, a rotation in the magnetic field possibly marked the passage of a magnetic cloud associated with the expected CME that lifted off the Sun on February 02. After returning to slow solar wind regime, the solar wind conditions became slightly disturbed from late on February 08 likely due to the compression region in front of the high-speed stream from a negative polarity coronal hole (SIDC Coronal Hole 88). The interplanetary magnetic field reached 22 nT at 11:35 UTC on February 09, with its southward component ranging between -13 nT and 14 nT. The solar wind speed also increased from 310 km/s to 550 km/s. The interplanetary magnetic field switched to the negative sector (field directed towards the Sun) from 08:50 UTC on February 09.
Geomagnetism
At the start of the week, geomagnetic conditions reached active levels (NOAA Kp: 4+ and K-Bel: 4) both globally and locally over Belgium, due to the impact of high-speed streams from Coronal Hole 82 (an equatorial, positive-polarity coronal hole) and Coronal Hole 60 (a mid-latitude, positive-polarity coronal hole). Early on February 3, the geomagnetic activity decreased to quiet and unsettled. The global geomagnetic conditions became again active (NOAA Kp: 4-) between 06:00 and 09:00 UTC on February 8, likely due to an ICME arrival. By the end of the past week, minor storm periods were observed (NOAA Kp: 5-, K-Bel: 5) both globally and locally over Belgium, caused by the arrival of a high-speed stream from a negative-polarity coronal hole (SIDC Coronal Hole 88).
Noticeable Solar Events
| DAY | BEGIN | MAX | END | LOC | XRAY | OP | 10CM | TYPE | Cat | NOAA |
| 03 | 0334 | 0347 | 0352 | M1.0 | 24 | 3981 | ||||
| 03 | 0352 | 0358 | 0404 | M8.8 | 24 | 3981 | ||||
| 03 | 0426 | 0432 | 0437 | M1.0 | II/1 | |||||
| 03 | 0537 | 0547 | 0554 | M3.1 | 24 | 3981 | ||||
| 03 | 0732 | 0744 | 0752 | M2.5 | II/1 | 24 | 3981 | |||
| 03 | 0909 | 0913 | 0917 | N5E20 | M1.4 | S | 24 | 3981 | ||
| 03 | 1307 | 1318 | 1323 | M6.1 | 24 | 3981 | ||||
| 03 | 1825 | 1836 | 1845 | N7E15 | M4.3 | 2B | 24 | 3981 | ||
| 03 | 2104 | 2112 | 2116 | N6E15 | M1.4 | SN | III/1 | 24 | 3981 | |
| 03 | 2314 | 2328 | 2333 | M1.4 | 24 | 3981 | ||||
| 04 | 0043 | 0050 | 0107 | M1.2 | 24 | 3981 | ||||
| 04 | 0135 | 0148 | 0203 | M2.6 | CTM/1 | 24 | 3981 | |||
| 04 | 0507 | 0518 | 0526 | M1.2 | III/2 | 21 | 3977 | |||
| 04 | 1109 | 1121 | 1126 | M4.7 | 24 | 3981 | ||||
| 04 | 1254 | 1313 | 1322 | M3.2 | 21 | 3977 | ||||
| 05 | 0312 | 0315 | 0322 | M1.2 | 24 | 3981 | ||||
| 05 | 0744 | 0750 | 0757 | M2.7 | III/1II/2 | 21 | 3977 | |||
| 06 | 1047 | 1104 | 1116 | N6W12 | M7.6 | 1B | III/1 | 24 | 3981 | |
| 06 | 2312 | 2327 | 2339 | N14W38 | M2.3 | 1 | 22 | 3978 | ||
| 07 | 0618 | 0630 | 0641 | M1.6 | III/1 | 24 | 3981 | |||
| 07 | 0712 | 0721 | 0737 | M3.2 | III/1 | 24 | 3981 | |||
| 07 | 0859 | 0921 | 0936 | M7.5 | III/2 | 24 | 3981 | |||
| 08 | 0857 | 0927 | 0941 | M2.0 | III/1CTM/1 | 24 | 3981 |
| LOC: approximate heliographic location | TYPE: radio burst type |
| XRAY: X-ray flare class | Cat: Catania sunspot group number |
| OP: optical flare class | NOAA: NOAA active region number |
| 10CM: peak 10 cm radio flux |
International Sunspot Number by SILSO

The daily Estimated International Sunspot Number (EISN, red curve with shaded error) derived by a simplified method from real-time data from the worldwide SILSO network. It extends the official Sunspot Number from the full processing of the preceding month (green line), a few days more than one solar rotation. The horizontal blue line shows the current monthly average. The yellow dots give the number of stations that provided valid data. Valid data are used to calculate the EISN. The triangle gives the number of stations providing data. When a triangle and a yellow dot coincide, it means that all the data is used to calculate the EISN of that day.
Geomagnetic Observations in Belgium

Local K-type magnetic activity index for Belgium based on data from Dourbes (DOU) and Manhay (MAB). Comparing the data from both measurement stations allows to reliably remove outliers from the magnetic data. At the same time the operational service availability is improved: whenever data from one observatory is not available, the single-station index obtained from the other can be used as a fallback system.
Both the two-station index and the single station indices are available here: http://ionosphere.meteo.be/geomagnetism/K_BEL/
The SIDC Space Weather Briefing
The forecaster on duty presented the SIDC briefing that gives an overview of space weather from Feb 2 to 9.
The pdf of the presentation: https://www.stce.be/briefings/20250210_SWbriefing.pdf
Review of Ionospheric Activity


VTEC time series at 3 locations in Europe from 3 Feb 2025 till 9 Feb 2025
The top figure shows the time evolution of the Vertical Total Electron Content (VTEC) (in red) during the last week at three locations:
a) in the northern part of Europe(N 61deg E 5deg)
b) above Brussels(N 50.5deg, E 4.5 deg)
c) in the southern part of Europe(N 36 deg, E 5deg)
This top figure also shows (in grey) the normal ionospheric behaviour expected based on the median VTEC from the 15 previous days.
The time series below shows the VTEC difference (in green) and relative difference (in blue) with respect to the median of the last 15 days in the North, Mid (above Brussels) and South of Europe. It thus illustrates the VTEC deviation from normal quiet behaviour.
The VTEC is expressed in TECu (with TECu=10^16 electrons per square meter) and is directly related to the signal propagation delay due to the ionosphere (in figure: delay on GPS L1 frequency).
The Sun's radiation ionizes the Earth's upper atmosphere, the ionosphere, located from about 60km to 1000km above the Earth's surface.The ionization process in the ionosphere produces ions and free electrons. These electrons perturb the propagation of the GNSS (Global Navigation Satellite System) signals by inducing a so-called ionospheric delay.
See http://stce.be/newsletter/GNSS_final.pdf for some more explanations; for more information, see https://gnss.be/SpaceWeather
STCE courses and lectures
Courses, seminars and presentations with the Sun-Space-Earth system and Space Weather as the main theme. We provide occasions to get submerged in our world through educational, informative and instructive activities.
* Mar 17-18, 2025, Inleiding tot het ruimteweer, enkel voor leden van volkssterrenwachten, Brussels, Belgium - register: https://events.spacepole.be/event/213/ - 1 stoel vrij
* Mar 24, 2025, STCE Lecture From Physics to Forecasting, ESA Academy's Space Weather Training Course
* April 28-30, 2025, STCE Space Weather Introductory Course, Brussels, Belgium - register: https://events.spacepole.be/event/214/
* May 26-27, 2025, STCE Course Space Weather impacts on aviation, online - register: https://events.spacepole.be/event/215/
* Jun 23-25, 2025, STCE Space Weather Introductory Course, Brussels, Belgium - register: https://events.spacepole.be/event/216/
* Sep 15-16, 2025, STCE Course Space Weather impacts on aviation, online - register: https://events.spacepole.be/event/218/
* Nov 17-19, 2025, STCE Space Weather Introductory Course, Brussels, Belgium - register: https://events.spacepole.be/event/217/
To register for a course and check the seminar details, navigate to the STCE Space Weather Education Center: https://www.stce.be/SWEC
If you want your event in the STCE newsletter, contact us: stce_coordination at stce.be

Website: https://www.stce.be/SWEC