- Table of Content
- 1.Eruptions à la...
- 2.Solar Orbiter ...
- 3.Future Space W...
- 4.Review of spac...
- 5.International ...
- 6.Noticeable Sol...
- 7.Geomagnetic Ob...
- 8.The SIDC space...
- 9.PROBA2 Observa...
- 10.Review of Iono...
2. Solar Orbiter flying by Venus
3. Future Space Weather experts visiting the STCE
4. Review of space weather
5. International Sunspot Number by SILSO
6. Noticeable Solar Events
7. Geomagnetic Observations in Belgium
8. The SIDC space weather briefing
9. PROBA2 Observations (10 Feb 2025 - 16 Feb 2025)
10. Review of Ionospheric Activity
Eruptions à la carte!
Solar activity was enhanced during the first week of February. As already written in an earlier newsitem (https://www.stce.be/news/747/welcome.html ), a flock of sunspots was the source of numerous M-class flares. Yet many of the coronal mass ejections (CMEs) observed during that time were not only associated with flaring activity from that sunspot nest. The CMEs observed during e.g. the period from 2 till 5 February could also be linked to eruptive activity from other sunspot regions, from filament eruptions, from active regions at or just behind the solar limb, or from the Sun's farside. That's a whole menu, in just a few days!
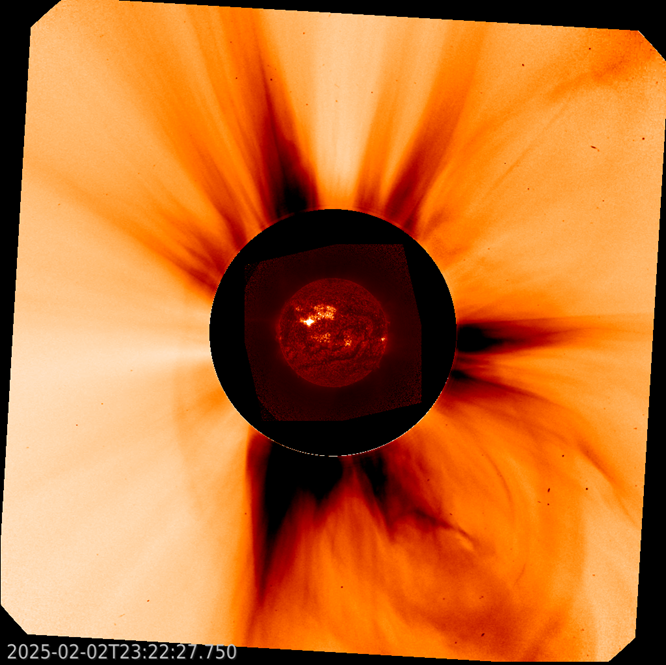
The imagery above shows for this 4-day period the GOES/SUVI 304 imagery (orange; temperatures around 80.000 degrees), with the SOHO/LASCO C2 coronagraphic imagery (white light) overlaid to show the CMEs. Note that, in this case, the colors of the coronagraphic imagery have been inverted (the usually bright structures are now dark and vice versa) to bring out the fainter details. A clip is available in the online version of this article at https://www.stce.be/news/749/welcome.html The 40-second clip contains almost 480 images (per series), thus based on 1 image every 12 minutes for 4 days. Some of the CMEs can literally be traced back to the sunspot nest (the big white structure slightly above the middle in the SUVI 304 images), while other CMEs such as the big CME on 4 February to the north lacking any apparent disk signature, meaning they are linked to farside events. Most of the CMEs visible in the clip did not have an earth-directed component, and for the few that did, it was guessing work if -a few days later- they left a signature in the solar wind parameters or not.
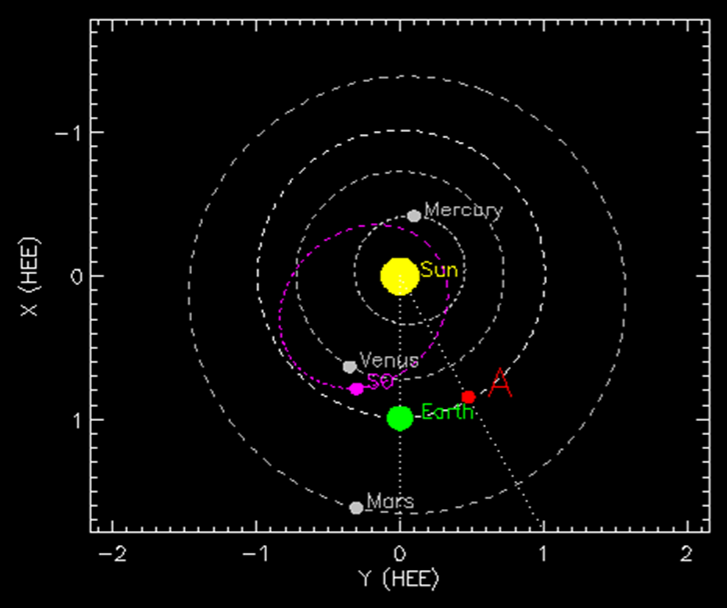
GOES/SUVI was of course not the only instrument observing the Sun. Also SDO, STEREO-A and Solar Orbiter were keeping an eye on our star. Whereas Solar Orbiter is currently trailing the Earth by 21 degrees, STEREO-A is 29 degrees ahead of the Earth. This can be seen in the scheme above (for 4 February), with "SO" being Solar Orbiter, "A" meaning STEREO-A, and SDO and GOES in a geotationary orbit close to Earth. Adding to this is the different field-of-view for each of the instruments, with the one for SDO/AIA the smallest (1.3 solar radii), STEREO-A/EUVI and GOES/SUVI a bit wider at 1.7 solar radii, and the one for Solar Orbiter (FSI: Full Sun Imager) the largest with a whopping 14.3 solar radii at the distance Sun-Earth.
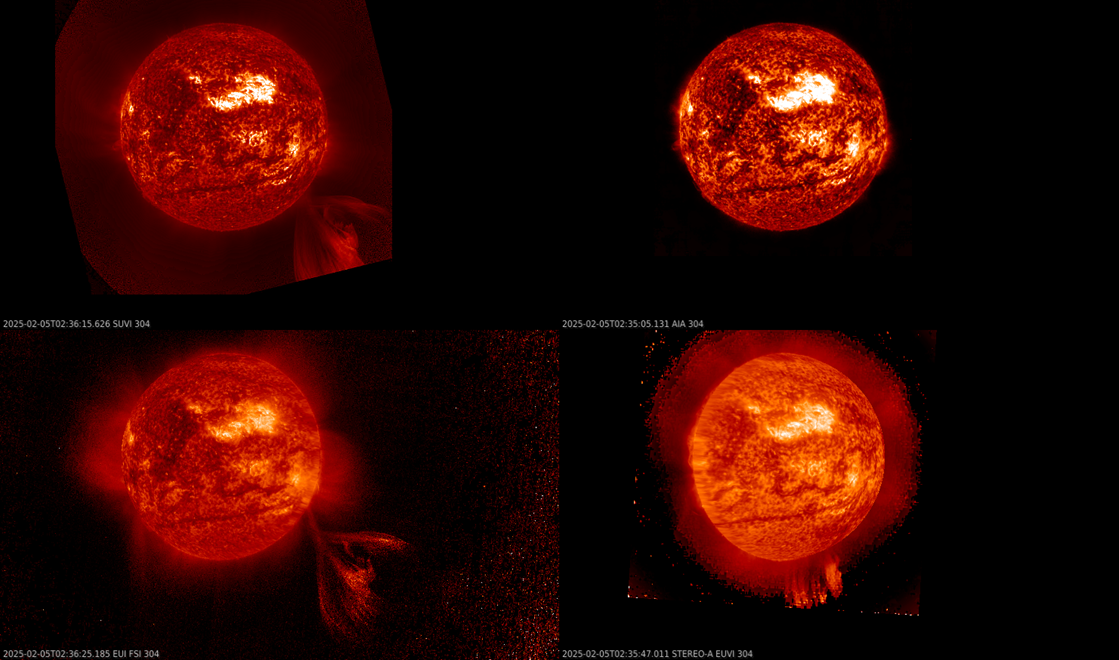
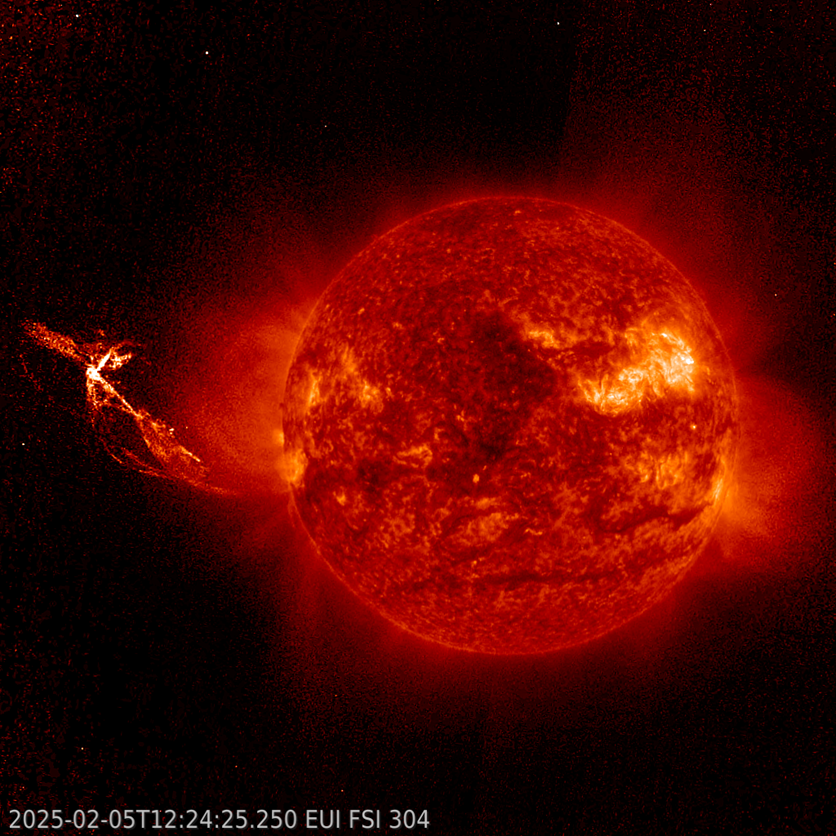
The effect of these differences is illustrated in the next two examples. The first one (above) shows the partial eruption of a filament in the southern solar hemisphere early on 5 February. Using the "multiview" option of the Space Weather JHelioviewer (SWHV - https://swhv.oma.be/user_manual/ ), one can combine the different views of the 4 spacecraft in a single frame, with GOES/SUVI in the upper left, SDO/AIA in the upper right, SolO/FSI in the lower left, and STEREO-A/EUVI in the lower right. All images are in the 30.4 nm passband (304 Angstrom) with the off-disk somewhat enhanced, explaining the noise in some of the images. For STEREO-A, the eruption is taking place close to its central meridian (nearly heads-on), whereas for Solar Orbiter the eruption happens close to its west limb.
In the second example (below), a jet-like eruption takes place near the Sun's east limb as observed by all 4 spacecraft around noon on 5 February. Because of the size of the event, SDO misses nearly all the good stuff from this eruption, GOES/SUVI records some of the fun, whereas Solar Orbiter's view captures the entire event in its full size (with room to spare, but not shown here). STEREO-A has a quite oblique view, making the jet-like eruption look quite smaller (fit in field-of-view!) and different than in the other instruments.
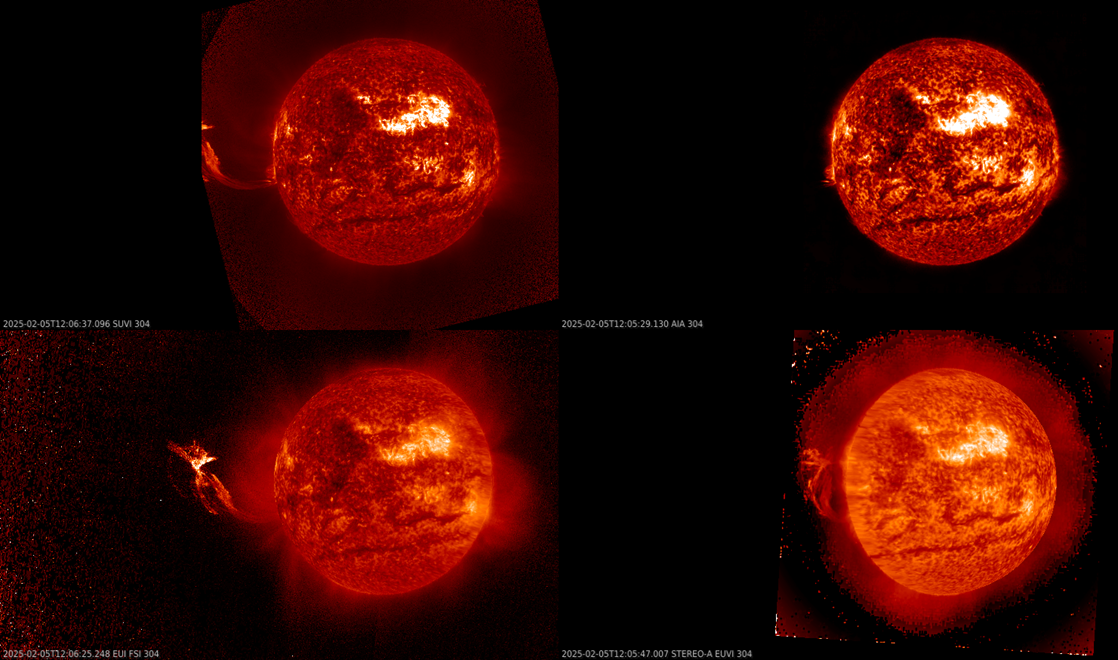
In the above multiviews, one may notice that the Sun is not looking nicely circular in the SolO and STEREO-A images. This is because JHelioviewer -in multiview mode- automatically rotates their images to make them look as if seen from the Earth (the option chosen here). This can be seen from the details on the solar disk such as e.g. the sunspot complex and the filaments that are nicely aligned for all 4 instruments, despite the quite different vantage points. The imagery underneath shows the single, non-rotated view of the jet-like eruption by Solar Orbiter. At its maximum height, the structure towered over 700.000 km above the solar limb, that is close to twice the Earth-Moon distance!
Solar Orbiter flying by Venus
Solar Orbiter will set a next milestone in its solar journey. It will have a close encounter with Venus to tilt its orbit to have a closer look at the solar poles. It is at the poles that magnetic forces come together to spread open into space accelerating the solar wind.
The instrument EUI onboard of Solar Orbiter will film this region in the extreme ultraviolet light to give access to more and new science.
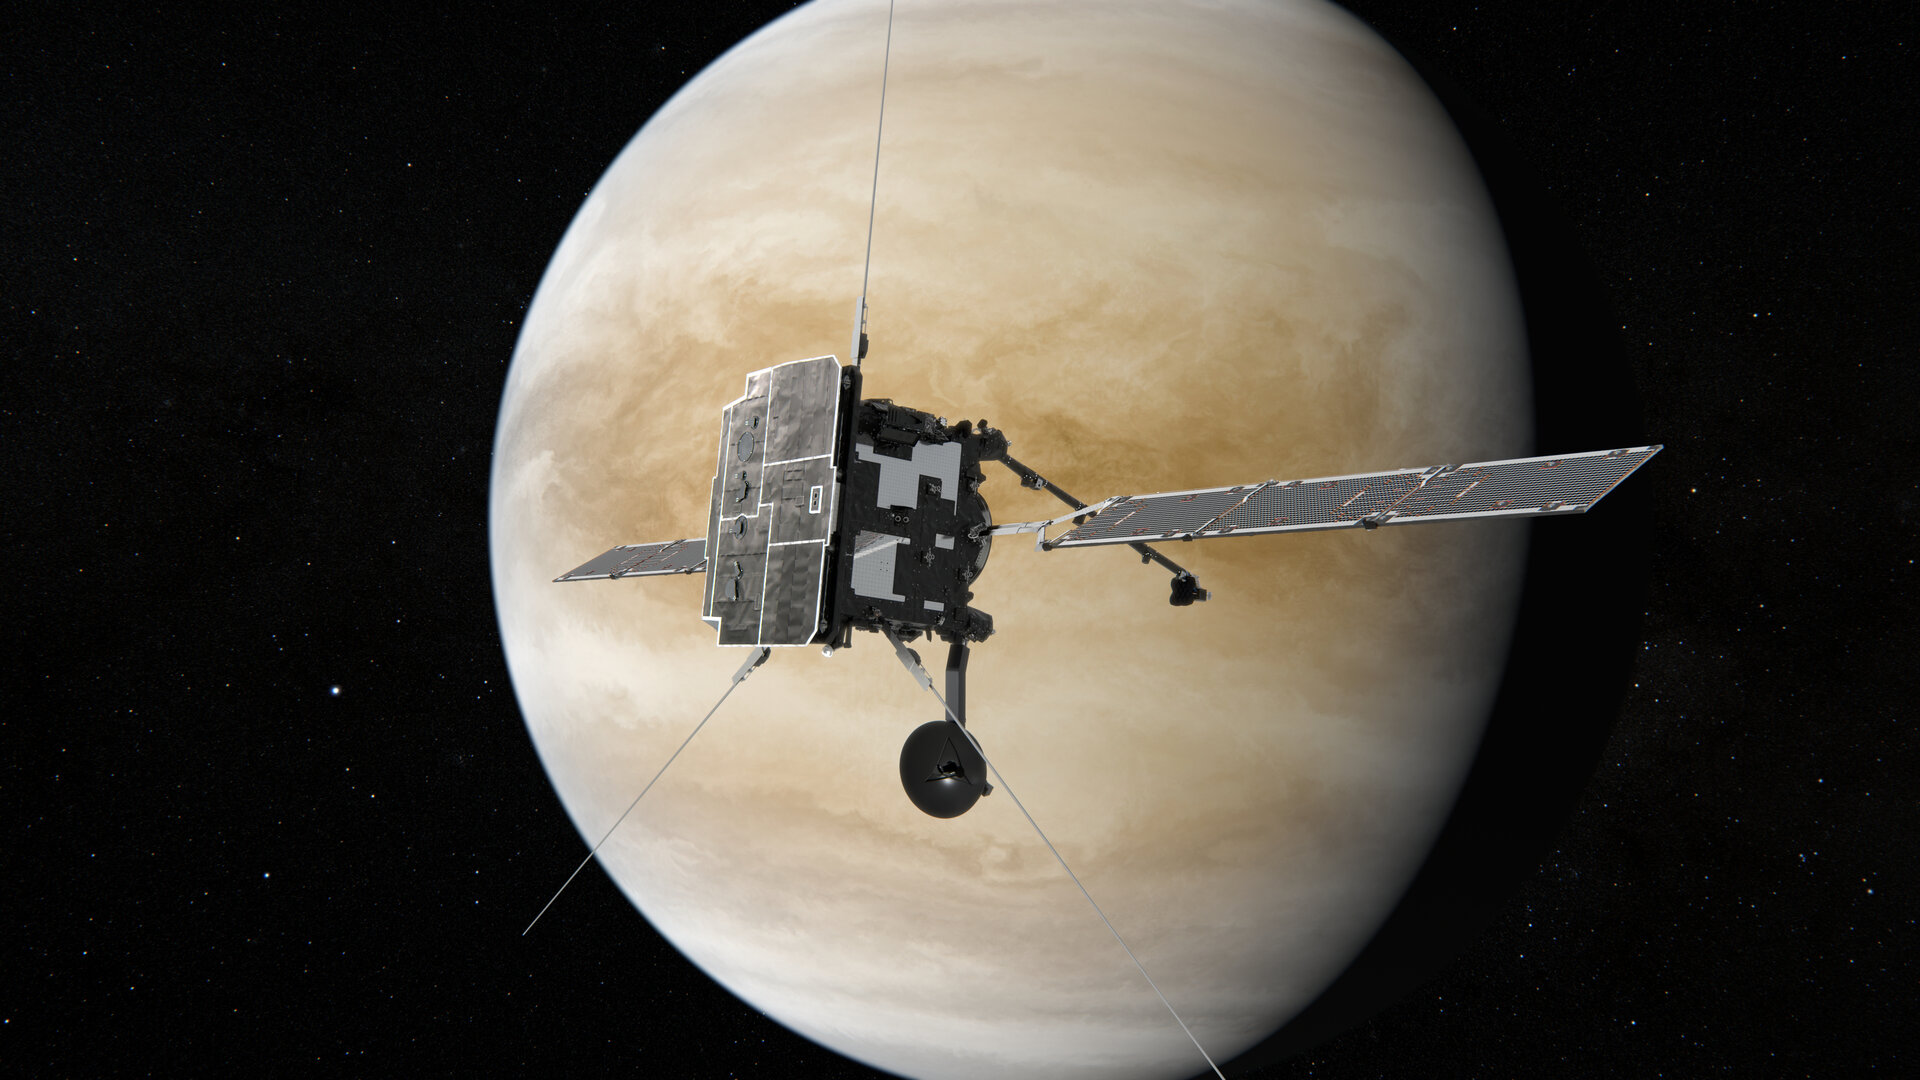
Read the ESA-story: https://www.esa.int/Enabling_Support/Operations/Solar_Orbiter_ready_for_close_encounter_with_Venus
Future Space Weather experts visiting the STCE
Twenty five toddlers between 4 and 6 years old visited the STCE, the Belgian space weather centre.
There were many wow moments: climbing the solar dome, the huge EUI image, the story about Northern lights, the heavy equatorial table (not comparable to a kitchen table), the rotating dome, satellites in all sizes.
What was remarkable, is that in a children's mind, space weather is straight forward and an easy concept.

Review of space weather
Solar Active Regions (ARs) and flares
Solar flaring activity was moderate. Six (6) M-class flares were recorded. The two strongest flares were an M1.6 (SIDC Flare 3580) and an M1.8 (SIDC Flare 3602). The first one peaked at 05:35 UTC on February 11 and was associated with SIDC Sunspot Group 391 (NOAA Active Region 3981). The second flare peaked at 20:57 UTC on February 14 and was associated with SIDC Sunspot Group 346 (NOAA Active Region 3990). Nineteen (19) active regions were observed on the side of the Sun facing Earth. The most complex were SIDC Sunspot Groups 360, 391, 397, 346, 399 (NOAA Active Regions 3978, 3981, 3988, 3990, 3992) all developing to magnetic type beta-gamma.
Coronal mass ejections
Numerous narrow or faint Coronal Mass Ejections (CMEs) were detected but were either events near the west or east limb or back-sided and had no impact on Earth. The most important events were two wide CMEs. The first was observed in LASCO/C2 and LASCO/C3 coronagraph imagery starting from around 18:30 UTC on February 11, lifting off the east limb. It was most likely associated with a C7.2 flare (SIDC Flare 3581) peaking at 18:25 UTC on February 11 and a filament eruption near SIDC Sunspot Group 398 (NOAA AR 3991). The second was back sided, observed in LASCO/C2 and LASCO/C3 coronagraph imagery at 13:25 UTC on February 15, lifting off the south limb with an estimated speed of 1255 km/s.
Coronal Holes
Two coronal holes have crossed the central meridian. The first (returning SIDC Coronal Hole 87) was an elongated, equatorial, negative polarity coronal hole that started to cross the central meridian on February 09. The second (SIDC Coronal Hole 91) was a mid-latitude, positive polarity coronal hole that started to cross the central meridian on February 16.
Proton flux levels
The greater than 10 MeV proton flux was below the 10 pfu threshold.
Electron fluxes at GEO
The greater than 2 MeV electron flux measured by GOES 16 and GOES 18 was several times above the threshold, following a diurnal variation. The 24-hour electron fluence was nominal before increasing to moderate levels from February 13 onwards.
Solar wind at L1
Due to the influence of a high-speed stream from a northern, negative polarity coronal hole (SIDC Coronal Hole 88) that crossed the central meridian on February 06, the speed of the solar wind near Earth was around 600 km/s, the interplanetary magnetic field reached 22 nT and the Bz component varied between -15 nT and 8 nT at the start of the week. Then, the solar wind gradually decreased to values around 450 km/s on February 13.
Further enhancements were observed on February 13 due to the arrival of the second high-speed stream from the elongated, negative polarity coronal hole (SIDC Coronal Hole 87). The solar wind speed reached 690 km/s, the interplanetary magnetic field was around 8-9 nT and the Bz component was between -9 nT and 6 nT.
Throughout the week, the interplanetary magnetic field was pointing predominantly towards the Sun.
Geomagnetism
Geomagnetic conditions globally and locally were unsettled to active (NOAA Kp 3-4, K Bel 3-4), with an isolated minor storm (NOAA Kp 5, K Bel 5) on February 09, 10, 14 and 15. The geomagnetic conditions reflected the influence of the two high-speed streams from the negative polarity coronal holes (SIDC Coronal Holes 88 and 87).
International Sunspot Number by SILSO

The daily Estimated International Sunspot Number (EISN, red curve with shaded error) derived by a simplified method from real-time data from the worldwide SILSO network. It extends the official Sunspot Number from the full processing of the preceding month (green line), a few days more than one solar rotation. The horizontal blue line shows the current monthly average. The yellow dots give the number of stations that provided valid data. Valid data are used to calculate the EISN. The triangle gives the number of stations providing data. When a triangle and a yellow dot coincide, it means that all the data is used to calculate the EISN of that day.
Noticeable Solar Events
| DAY | BEGIN | MAX | END | LOC | XRAY | OP | 10CM | TYPE | Cat | NOAA |
| 10 | 0030 | 0046 | 0102 | M1.0 | III/1 | 3981 | ||||
| 11 | 0522 | 0535 | 0547 | M1.6 | III/1 | 24 | 3981 | |||
| 13 | 1105 | 1109 | 1113 | M1.0 | III/2 | 35 | 3992 | |||
| 14 | 0213 | 0228 | 0243 | M1.2 | ||||||
| 14 | 0948 | 1006 | 1019 | S11E23 | M1.2 | 1F | III/1 | 38 | 3990 | |
| 14 | 2045 | 2057 | 2105 | M1.8 | III/2 | 38 | 3990 |
| LOC: approximate heliographic location | TYPE: radio burst type |
| XRAY: X-ray flare class | Cat: Catania sunspot group number |
| OP: optical flare class | NOAA: NOAA active region number |
| 10CM: peak 10 cm radio flux |
Geomagnetic Observations in Belgium

Local K-type magnetic activity index for Belgium based on data from Dourbes (DOU) and Manhay (MAB). Comparing the data from both measurement stations allows to reliably remove outliers from the magnetic data. At the same time the operational service availability is improved: whenever data from one observatory is not available, the single-station index obtained from the other can be used as a fallback system.
Both the two-station index and the single station indices are available here: http://ionosphere.meteo.be/geomagnetism/K_BEL/
The SIDC space weather briefing
The forecaster on duty presented the SIDC briefing that gives an overview of space weather from Feb 9 to 16.
The pdf of the presentation can be found here: https://www.stce.be/briefings/20250217_SWbriefing.pdf
PROBA2 Observations (10 Feb 2025 - 16 Feb 2025)
Solar Activity
Solar flare activity remained low during the week.
In order to view the activity of this week in more detail, we suggest to go to the following website from which all the daily (normal and difference) movies can be accessed: https://proba2.oma.be/ssa
This page also lists the recorded flaring events.
A weekly overview movie can be found here (SWAP week 777). https://proba2.sidc.be/swap/data/mpg/movies/weekly_movies/weekly_movie_2025_02_10.mp4
Details about some of this week's events can be found further below.
If any of the linked movies are unavailable they can be found in the P2SC movie repository here https://proba2.oma.be/swap/data/mpg/movies/
Friday Feb 14
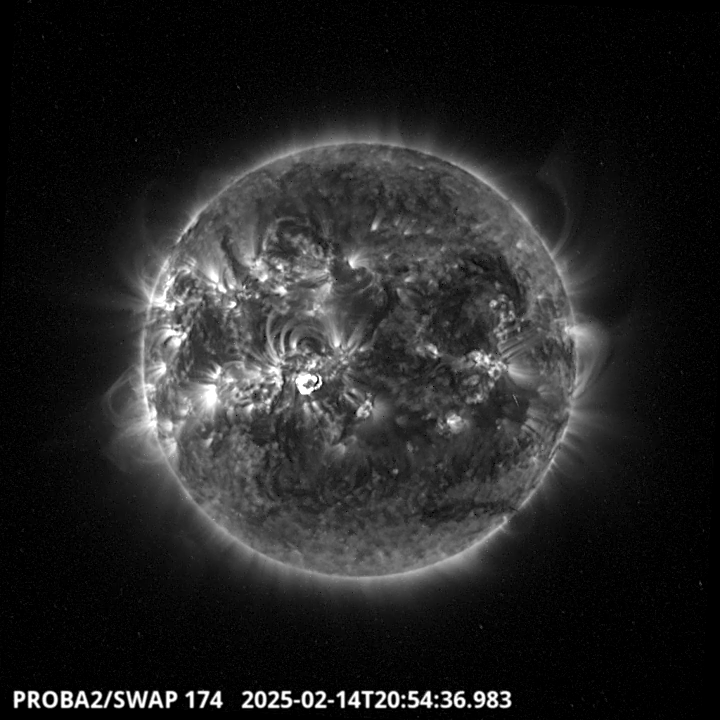
The largest flare of the week is a M1.8. It was produced by the active region 3990 located on the Meridional-East part of the solar disk. Find a SWAP movie of the event here. https://proba2.sidc.be/swap/movies/20250214_swap_movie.mp4
Review of Ionospheric Activity


VTEC time series at 3 locations in Europe from 10 Feb 2025 till 16 Feb 2025
The top figure shows the time evolution of the Vertical Total Electron Content (VTEC) (in red) during the last week at three locations:
a) in the northern part of Europe(N 61deg E 5deg)
b) above Brussels(N 50.5deg, E 4.5 deg)
c) in the southern part of Europe(N 36 deg, E 5deg)
This top figure also shows (in grey) the normal ionospheric behaviour expected based on the median VTEC from the 15 previous days.
The time series below shows the VTEC difference (in green) and relative difference (in blue) with respect to the median of the last 15 days in the North, Mid (above Brussels) and South of Europe. It thus illustrates the VTEC deviation from normal quiet behaviour.
The VTEC is expressed in TECu (with TECu=10^16 electrons per square meter) and is directly related to the signal propagation delay due to the ionosphere (in figure: delay on GPS L1 frequency).
The Sun's radiation ionizes the Earth's upper atmosphere, the ionosphere, located from about 60km to 1000km above the Earth's surface.The ionization process in the ionosphere produces ions and free electrons. These electrons perturb the propagation of the GNSS (Global Navigation Satellite System) signals by inducing a so-called ionospheric delay.
See http://stce.be/newsletter/GNSS_final.pdf for some more explanations; for more information, see https://gnss.be/SpaceWeather