- Table of Content
- 1.SolO's science...
- 2.More on SolO: ...
- 3.PROBA2 Observa...
- 4.Review of spac...
- 5.International ...
- 6.Noticeable Sol...
- 7.Geomagnetic Ob...
- 8.The SIDC Space...
- 9.Review of Iono...
- 10.STCE courses, ...
2. More on SolO: help for space weather forecasting
3. PROBA2 Observations (3 Mar 2025 - 9 Mar 2025)
4. Review of space weather
5. International Sunspot Number by SILSO
6. Noticeable Solar Events
7. Geomagnetic Observations in Belgium
8. The SIDC Space Weather Briefing
9. Review of Ionospheric Activity
10. STCE courses, lectures and seminars
SolO's science nuggets
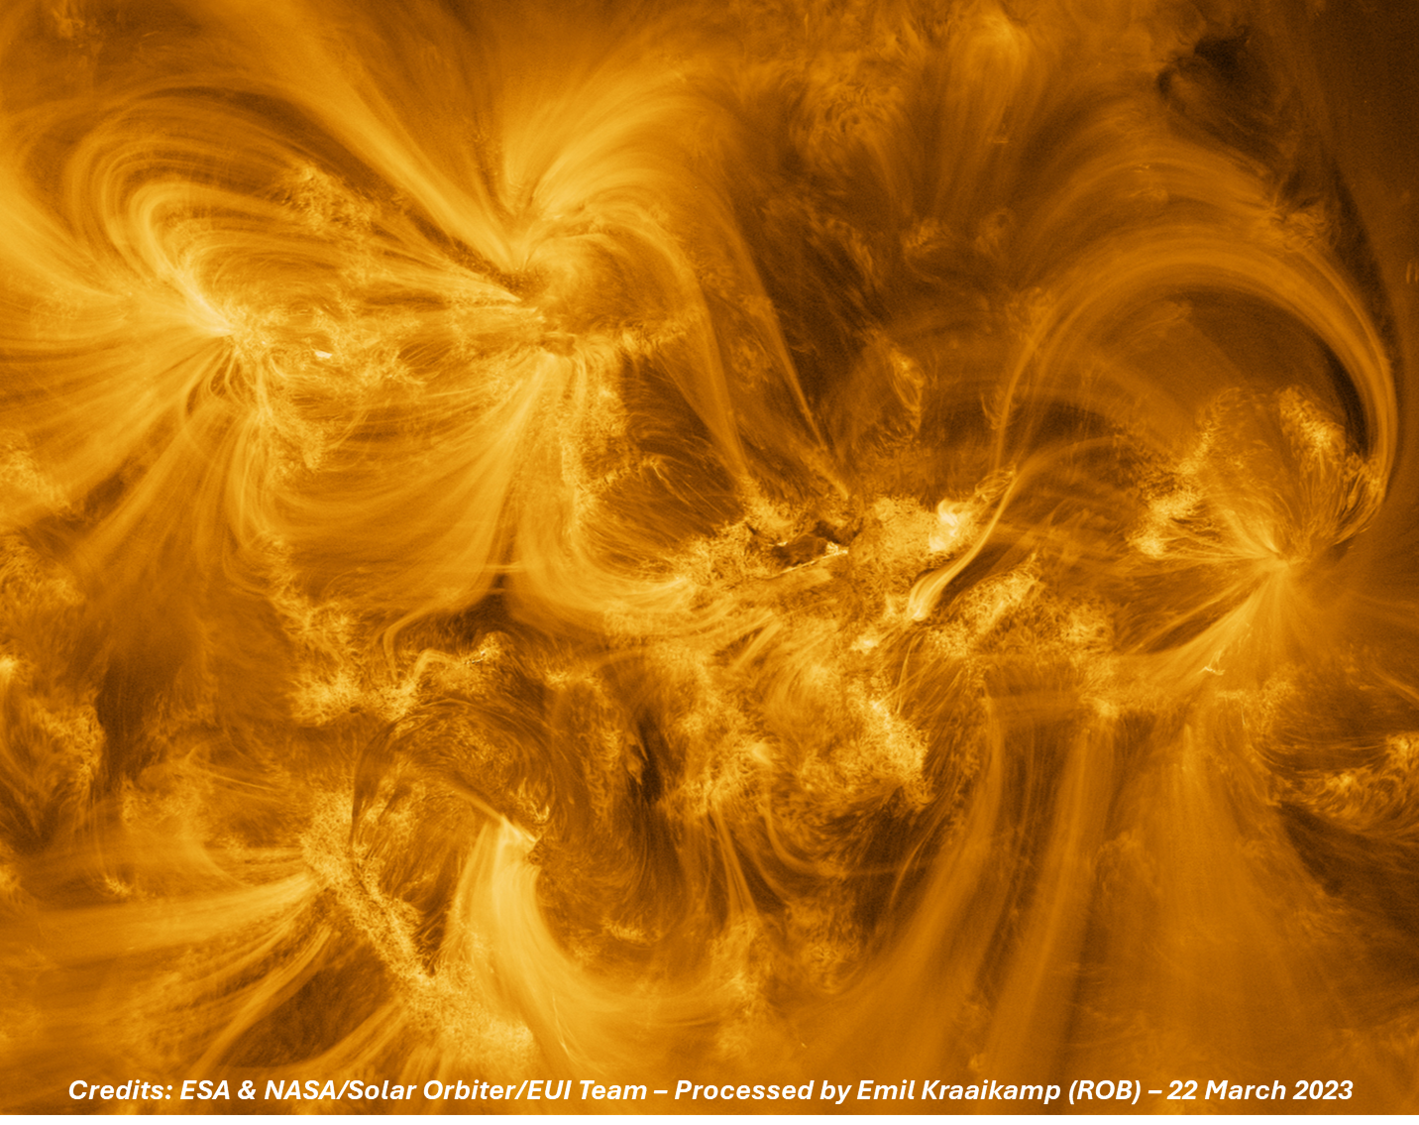
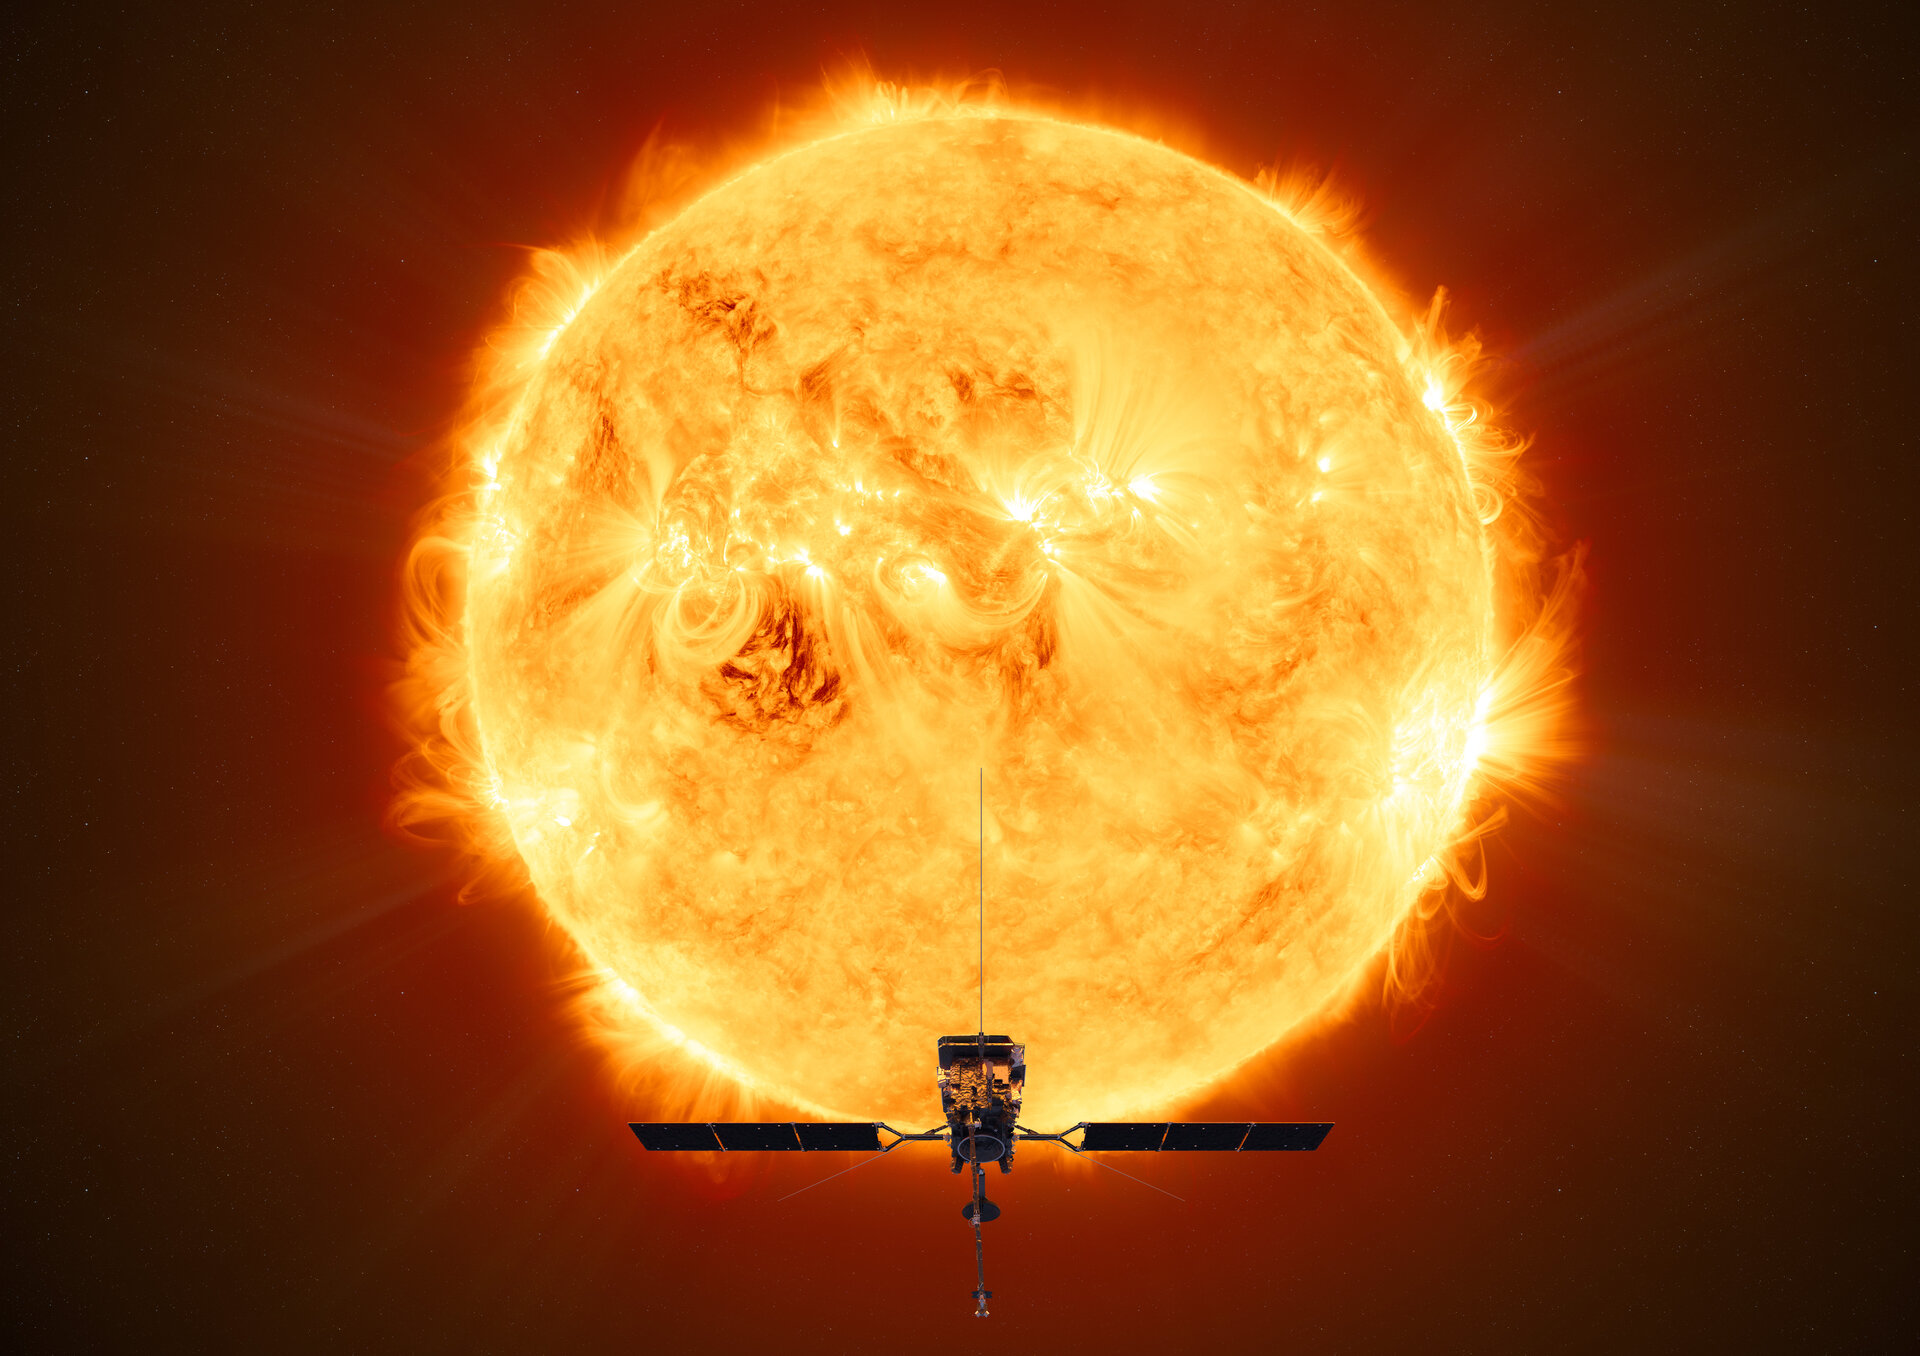
Solar Orbiter, an ESA mission with contribution from NASA, was launched on 10 February 2020 to study the Sun, the inner heliosphere and the solar wind. It hosts a suite of instruments to make both in-site and remote-sensing measurements. Over the last few years, these instruments have helped space weather forecasters in monitoring, analyzing and forecasting drivers of space weather. Typical examples have been discussed in STCE newsitems such as on the intensity of solar flares (STIX; e.g. https://www.stce.be/news/712/welcome.html ), the propagation of interplanetary coronal mass ejections and energetic particles (resp. MAG and EPD; e.g. https://www.stce.be/news/716/welcome.html ), and of course the Extreme Ultraviolet Imager EUI that helped with the identification and evolution of solar eruptions (e.g. https://www.stce.be/news/570/welcome.html , https://www.stce.be/news/605/welcome.html , and https://www.stce.be/news/625/welcome.html ). A portion from a high-resolution solar image taken by EUI can be found underneath (ESA - https://www.esa.int/ESA_Multimedia/Images/2024/11/EUI_s_view_of_the_Sun_in_UV_light ). This snippet is not even fully zoomed-in!
Nonetheless, Solar Orbiter is in the first place a science mission. SolO's instruments have already made many important scientific discoveries and contributions. Hence, early 2023, ESA started a webpage (https://www.cosmos.esa.int/web/solar-orbiter/science-nuggets ) with short informative texts based on a topic related to the use of Solar Orbiter data and answering some of the fundamental questions in solar and space physics. These nuggets are very similar to the format used by Hugh Hudson for the Yohkoh (https://www.mssl.ucl.ac.uk/surf/ydac/nuggets/ ) and then Rhessi newsitems, now called SolarNuggets (https://heliowiki.smce.nasa.gov/wiki/index.php/SolarNuggets ). The Solar Orbiter science nuggets (https://www.cosmos.esa.int/web/solar-orbiter/science-nuggets ) recently celebrated their 50th nugget (https://www.cosmos.esa.int/web/solar-orbiter/-/50th-nugget ) and fittingly dedicated it to the many contributions made in the field of solar and heliospheric physics. Indeed, Solar Orbiter has certainly advanced our knowledge in the domain of
- solar coronal heating (remember campfires? https://www.stce.be/EUI_first_light ),
- the origins of the solar wind (remember the magnetic switchbacks? - https://www.esa.int/Science_Exploration/Space_Science/Solar_Orbiter/Solar_Orbiter_solves_magnetic_switchback_mystery ),
- solar flares, CMEs and space weather (remember e.g. the picoflare jets? - https://www.stce.be/news/661/welcome.html ), and
- particle acceleration in the heliosphere (i.e. on Solar Energetic Particle (SEP) and Energetic Storm Particle (ESP) events - https://www.stce.be/news/733/welcome.html ).
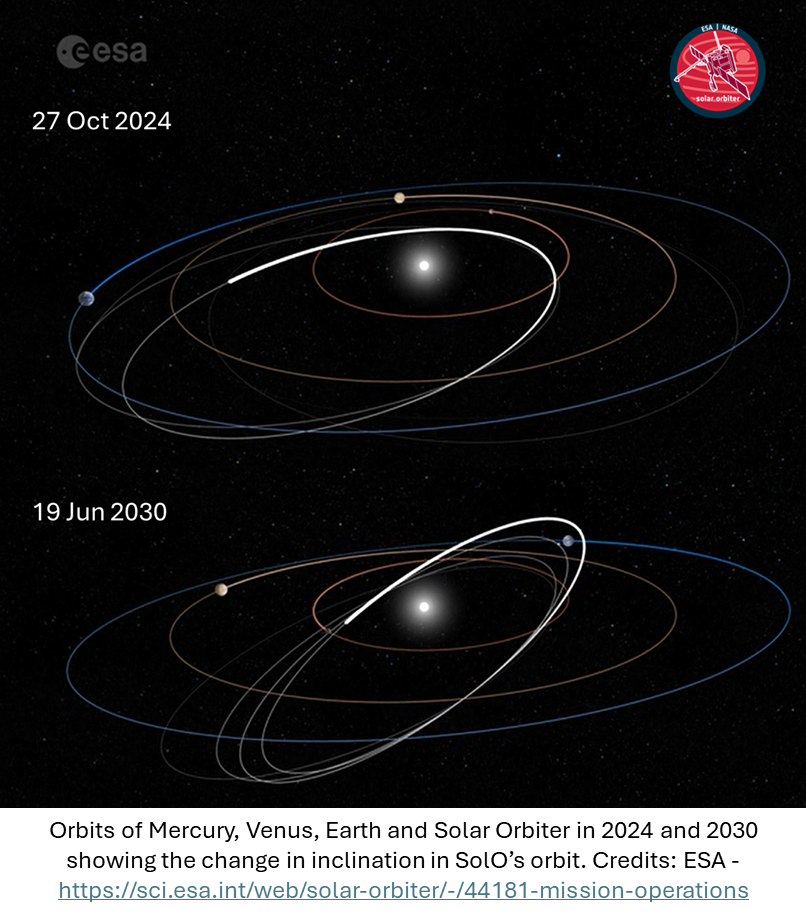
Very often, the results could only be obtained by an intense collaboration between several spacecraft such as with the Parker Solar Probe (https://www.stce.be/news/564/welcome.html ), Hinode, SDO and STEREO-A. Mid-February 2025 (https://www.esa.int/Enabling_Support/Operations/Solar_Orbiter_ready_for_close_encounter_with_Venus ), Solar Orbiter started its first gravitational manoeuvres to get into a somewhat more inclined orbit around the Sun (17 degrees), the purpose being to get a better view of the Sun's poles. By the end of the nominal science phase (already in December 2026!), the inclination should be about 24 degrees. If the mission gets extended, the inclination will be further increased to 33 degrees. That would hold the promise of a fascinating sight and many more discoveries to come!
More on SolO: help for space weather forecasting
Solar Wind watch
Solar Orbiter can serve as a solar watch for the Belgian Space Weather Centre. The EUV imager and the MAG instrument measuring the solar wind in situ onboard of Solar Orbiter help the space weather forecasters, when the satellite is as the right position at the right time.
The low-latency MAG data, while not appropriate for science use, proved to be valuable for space weather monitoring and prediction on Februari 22, 2025. The STCE forecaster on duty wrote in the solar wind section of the daily space weather bulletin:
... However, low-latency data from the MAG instrument onboard Solar Orbiter (located at 0.7 AU from the Sun and 20 degrees east of Earth) shows an increase in the interplanetary magnetic field magnitude, currently reaching 40 nT at that location. This may indicate an earlier arrival to the Earth (on 23 February) of the CME that left the Sun early on 20 February, rather than the previously predicted arrival on 24 February. ...
The MAG data is provided by Imperial College London: https://www.imperial.ac.uk/space-and-atmospheric-physics/research/missions-and-projects/space-missions/solar-orbiter/updates/
Where to find the daily space weather bulletins: https://www.sidc.be (services/bulletins and forecast/URSIgram)
Flare watch
On September 30, 2024, EUI on Solar Orbiter could catch an M-flare. The images gave a detailed view of what happened in the corona at the time of the flare from another view perspective than for example SDO/AIA which orbits Earth.
Again, Solar Orbiter as a valuable satellite for space weather monitoring.
Check out the ESA-story: https://www.esa.int/esatv/Videos/2025/03/Solar_Orbiter_spots_a_solar_flare
Where is Solar Orbiter: https://solarorbiter.esac.esa.int/where/
Enjoy!
PROBA2 Observations (3 Mar 2025 - 9 Mar 2025)
Solar Activity
Solar flare activity fluctuated from low to moderate during the week.
In order to view the activity of this week in more detail, we suggest to go to the following website from which all the daily (normal and difference) movies can be accessed: https://proba2.oma.be/ssa
This page also lists the recorded flaring events.
A weekly overview movie can be found here (SWAP week 780). https://proba2.sidc.be/swap/data/mpg/movies/weekly_movies/weekly_movie_2025_03_03.mp4
Details about some of this week's events can be found further below.
If any of the linked movies are unavailable they can be found in the P2SC movie repository here https://proba2.sidc.be/swap/data/mpg/movies/
Wednesday Mar 05
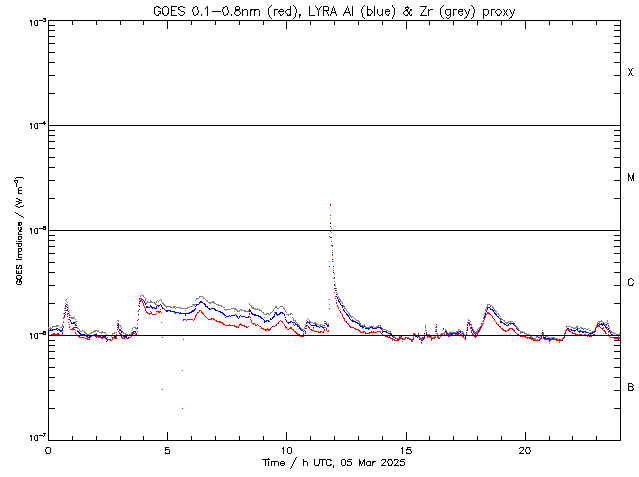
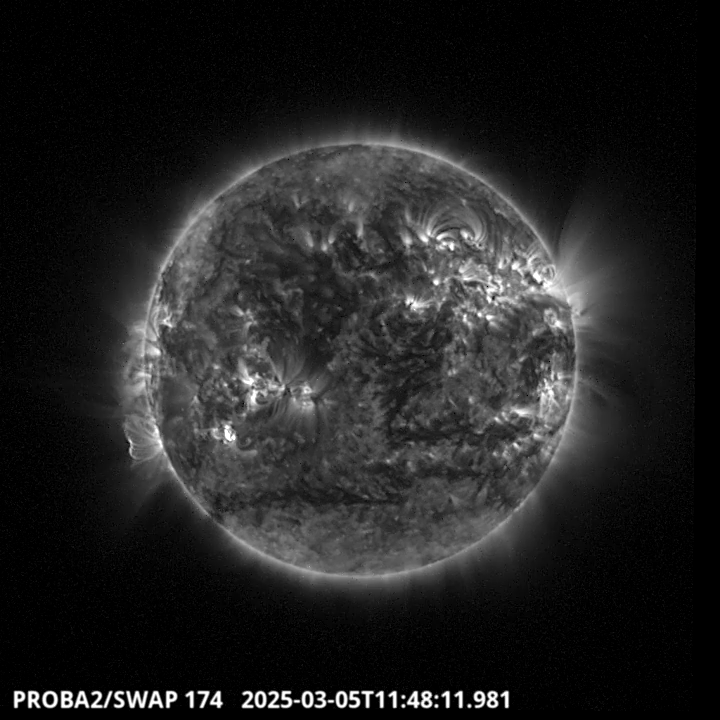
The largest flare of the week is a M1.7 flare. It was produced by the NOAA region 4016, located
on the South-East part of the solar disk. The flare was recorded by LYRA and SWAP.
Find a movie of the events here (SWAP movie) https://proba2.sidc.be/swap/data/mpg/movies/20250305_swap_movie.mp4
Friday Mar 07
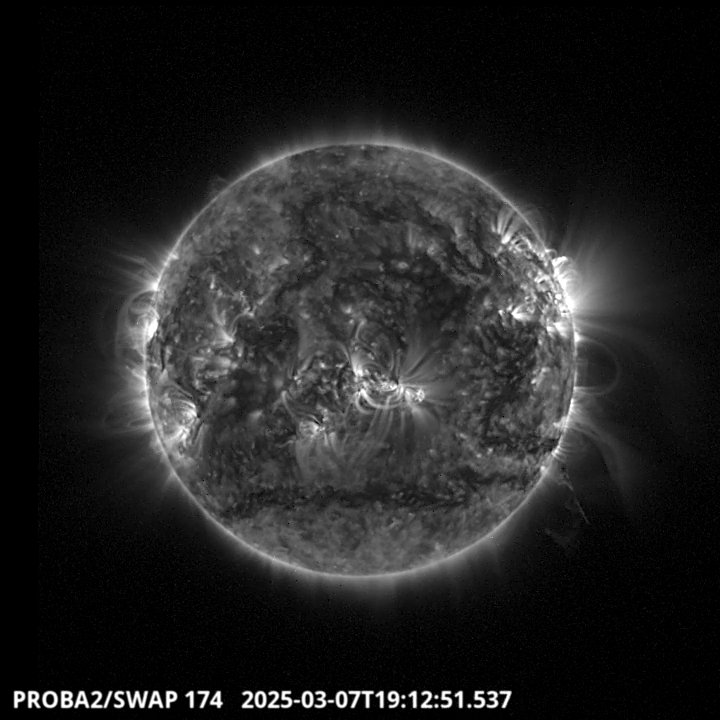
Filament eruption on the South_West limb of the solar disk around 19:13 UT.
Find a movie of the events here (SWAP movie) https://proba2.sidc.be/swap/data/mpg/movies/20250307_swap_movie.mp4
Review of space weather
Solar Active Regions (ARs) and flares
Solar flaring activity was low, with the only exception being an M1.7 on 5 Mar at 11:54 UTC and an M1.6 on 7 Mar at 21:00 UTC. Thirty (30) C-class flares were detected.
Coronal mass ejections
No Earth-directed Coronal Mass Ejection (CME) were observed.
Coronal Holes
A large equatorial Corona Hole (CH) with negative polarity crossed the central solar meridian.
Proton flux levels
The greater than 10 MeV proton flux, as measured by the GOES-18 satellite, was nominal.
Electron fluxes at GEO
The greater than 2 MeV electron flux, as measured by the GOES-18 satellite, fluctuated every day from very low values up to the 1000 pfu alert level. It marginally exceded the threshold almost daily but only for very short periods of time. The 24h electron fluence reached the moderate level lower limit (i.e. 5e7 pfu) on 4 Mar and dropped back to normal levels the next day.
Solar wind
At the beginning of the week the Solar Wind (SW) conditions were gradually returning to a slow regime, following the arrival of a High Speed Stream (HSS) earlier on. Between 3 and 8 Mar the SW speed gradually dropped from 560 to 340 km/s and the interplanetary magnetic field (B) fluctuated between 3 and 9 nT. However, at the second half of 5 Mar and for approximately 24 hours, a glancing blow from a Coronal Mass Ejection (CME) caused the North-South component of the interplanetary magnetic field (Bz) to drop as low as -8 nT. The SW conditions changed again on 8 Mar because of the arrival of a Corotating Interaction Region (CIR), followed by the HSS on 9 Mar. The SW speed increased to 720 km/s by the end of the week, while B peaked at 19 nT and Bz dropped as low as -14 nT on 8 Mar.
Geomagnetism
The global geomagnetic conditions reached moderate storm levels (NOAA Kp 6-) on 9 Mar at 03:00-06:00 and at 09:00-12:00 UTC and minor storm levels (NOAA Kp 5-) from 8 Mar 18:00 UTC to 9 Mar 03:00 UTC. This was the result of the arrival of a Corotating Interaction Region (CIR) on 8 Mar and a High Speed Stream (HSS) on 9 Mar. The rest of the week, quiet to unsettled conditions were observed (NOAA Kp up to 3+), with the exception of active levels (NOAA Kp 4+) on 5 Mar.
The local geomagnetic conditions followed the same pattern, but they were milder. They reached minor storm levels (KBEL 5) on 8 Mar at 21:00-24:00 UTC, while active conditions (K BEL 4) were observed on 4 and 9 Mar.
International Sunspot Number by SILSO

The daily Estimated International Sunspot Number (EISN, red curve with shaded error) derived by a simplified method from real-time data from the worldwide SILSO network. It extends the official Sunspot Number from the full processing of the preceding month (green line), a few days more than one solar rotation. The horizontal blue line shows the current monthly average. The yellow dots give the number of stations that provided valid data. Valid data are used to calculate the EISN. The triangle gives the number of stations providing data. When a triangle and a yellow dot coincide, it means that all the data is used to calculate the EISN of that day.
Noticeable Solar Events
| DAY | BEGIN | MAX | END | LOC | XRAY | OP | 10CM | TYPE | Cat | NOAA |
| 05 | 1145 | 1150 | 1154 | S26E43 | M1.7 | SF | III/1 | 75 | 4016 | |
| 07 | 2054 | 2100 | 2109 | S26E9 | M1.6 | SN | III/2 | 75 | 4016 |
| LOC: approximate heliographic location | TYPE: radio burst type |
| XRAY: X-ray flare class | Cat: Catania sunspot group number |
| OP: optical flare class | NOAA: NOAA active region number |
| 10CM: peak 10 cm radio flux |
Geomagnetic Observations in Belgium

Local K-type magnetic activity index for Belgium based on data from Dourbes (DOU) and Manhay (MAB). Comparing the data from both measurement stations allows to reliably remove outliers from the magnetic data. At the same time the operational service availability is improved: whenever data from one observatory is not available, the single-station index obtained from the other can be used as a fallback system.
Both the two-station index and the single station indices are available here: http://ionosphere.meteo.be/geomagnetism/K_BEL/
The SIDC Space Weather Briefing
The forecaster on duty presented the SIDC briefing that gives an overview of space weather from March 02 to 09.
The pdf of the presentation: https://www.stce.be/briefings/20250310_SWbriefing.pdf
Review of Ionospheric Activity


VTEC time series at 3 locations in Europe from 3 Mar 2025 till 9 Mar 2025
The top figure shows the time evolution of the Vertical Total Electron Content (VTEC) (in red) during the last week at three locations:
a) in the northern part of Europe(N 61deg E 5deg)
b) above Brussels(N 50.5deg, E 4.5 deg)
c) in the southern part of Europe(N 36 deg, E 5deg)
This top figure also shows (in grey) the normal ionospheric behaviour expected based on the median VTEC from the 15 previous days.
The time series below shows the VTEC difference (in green) and relative difference (in blue) with respect to the median of the last 15 days in the North, Mid (above Brussels) and South of Europe. It thus illustrates the VTEC deviation from normal quiet behaviour.
The VTEC is expressed in TECu (with TECu=10^16 electrons per square meter) and is directly related to the signal propagation delay due to the ionosphere (in figure: delay on GPS L1 frequency).
The Sun's radiation ionizes the Earth's upper atmosphere, the ionosphere, located from about 60km to 1000km above the Earth's surface.The ionization process in the ionosphere produces ions and free electrons. These electrons perturb the propagation of the GNSS (Global Navigation Satellite System) signals by inducing a so-called ionospheric delay.
See http://stce.be/newsletter/GNSS_final.pdf for some more explanations; for more information, see https://gnss.be/SpaceWeather
STCE courses, lectures and seminars
Courses, seminars and presentations with the Sun-Space-Earth system and Space Weather as the main theme. We provide occasions to get submerged in our world through educational, informative and instructive activities.
* Mar 17-18, 2025, Inleiding tot het ruimteweer, enkel voor leden van volkssterrenwachten, Brussels, Belgium - complete
* Mar 24, 2025, STCE Lecture From Physics to Forecasting, ESA Academy's Space Weather Training Course
* April 1, 2PM, STCE seminar: GRMB project: Cluster satellites in the geospace environment, RMI conference room, Brussels, Belgium
* April 28-30, 2025, STCE Space Weather Introductory Course, Brussels, Belgium - register: https://events.spacepole.be/event/214/
* May 26-27, 2025, STCE Course Space Weather impacts on aviation, online - register: https://events.spacepole.be/event/215/
* Jun 23-25, 2025, STCE Space Weather Introductory Course, Brussels, Belgium - register: https://events.spacepole.be/event/216/
* Sep 15-16, 2025, STCE Course Space Weather impacts on aviation, online - register: https://events.spacepole.be/event/218/
* Nov 17-19, 2025, STCE Space Weather Introductory Course, Brussels, Belgium - register: https://events.spacepole.be/event/217/
To register for a course and check the seminar details, navigate to the STCE Space Weather Education Center: https://www.stce.be/SWEC
If you want your event in the STCE newsletter, contact us: stce_coordination at stce.be

Website: https://www.stce.be/SWEC